Highlights
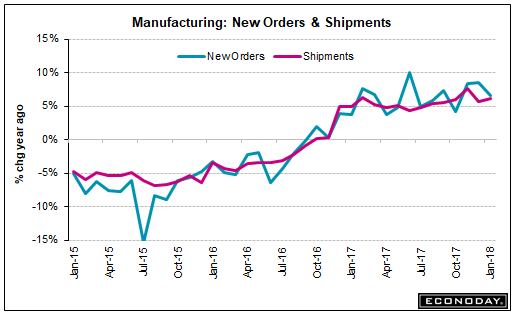
Today’s factory orders report, down 1.4 percent at the headline level but showing life underneath, closes the book on what was a mixed to soft month of January for manufacturing. Aircraft has been a bright spot for the factory sector and mitigates what is a 28 percent downswing in January. Excluding transportation equipment, where aircraft and also motor vehicles are tracked and which were also weak with a 0.5 percent decline, factory orders fell 0.3 percent but follow impressive 0.8 and 0.4 percent gains in the prior two months.
The split between the report’s two main components shows a 0.8 percent rise for nondurable goods — the new data in today’s report where strength is tied to petroleum and coal — and a 3.6 percent drop for durable orders which is 1 tenth less weak than last week’s advance report for this component.
Orders for computers and consumer products are highlights of the report as is a 0.6 percent rise in total shipments. But shipments of core capital goods (nondefense ex-aircraft) are not part of the good news, falling 0.1 percent in the month for a 2 tenth downward revision from the initial reading and which gets business investment off to a slow first-quarter start. And orders for January core capital goods are revised 1 tenth lower to a 0.3 percent decline that follows December’s 0.5 percent dip.
Unfilled orders are another of the report’s weaknesses, down 0.3 percent in a reading that, unlike regional and private surveys, does not point to capacity stresses nor immediate inflationary risks.
This report is a reminder that not all the data on the factory sector are strong and underscores the second straight no change reading in the manufacturing component of the previously released industrial production report for January.
Not a good sign for GDP:

Highlights
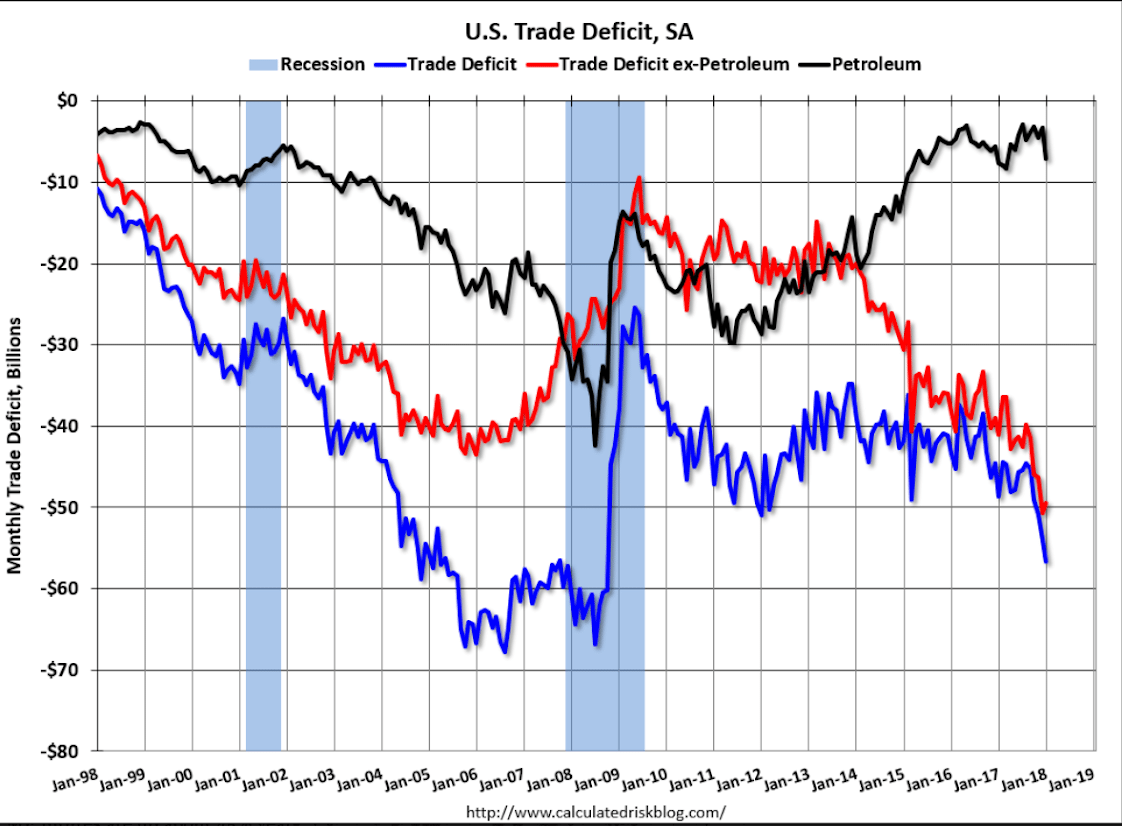
The nation’s trade deficit widened sharply in January, to $56.6 billion which is beyond Econoday’s deepest estimate and marks a negative start to first-quarter net exports.
Imports, at $257.5 billion, were unchanged in the month but not exports which fell a sharp 1.3 percent to $200.9 billion. Exports of services were steady at $66.7 billion while exports of goods fell 2.2 percent to $134.2 billion. And here to blame are industrial supplies, which includes primary metals, down $1.3 billion to $41.5 billion and also capital goods, a central focus of U.S. strength that fell $2.6 billion to $44.9 billion and includes a $1.8 billion decline in civilian aircraft exports to $3.8 billion.
Imports show a $2 billion rise in industrial supplies to $47.3 billion and a welcome $0.9 billion decline in consumer goods to $54.6 billion. Petroleum imports rose $2.2 billion to $13.2 billion reflecting both higher volumes and higher prices.
Exports are going to have to pick up in February and March otherwise first-quarter GDP will be fighting uphill against an accelerating trade deficit.
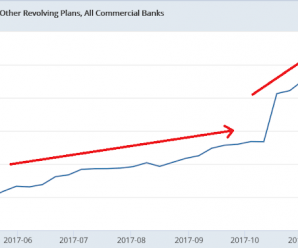
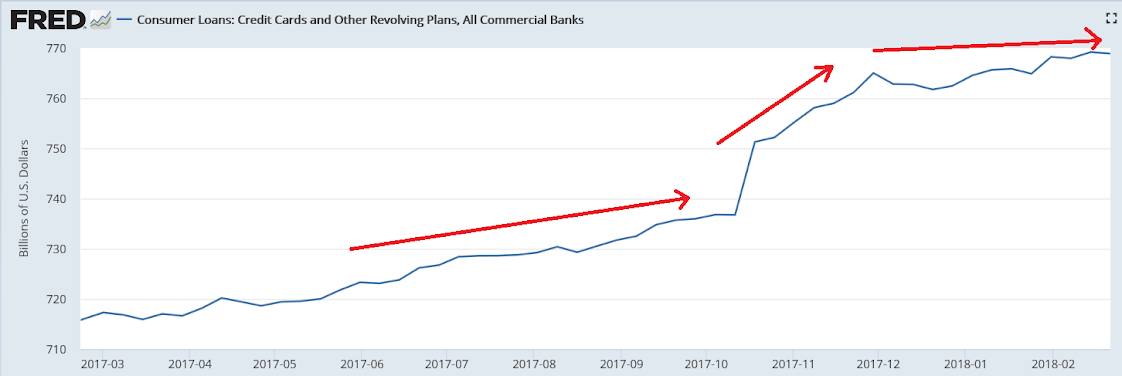
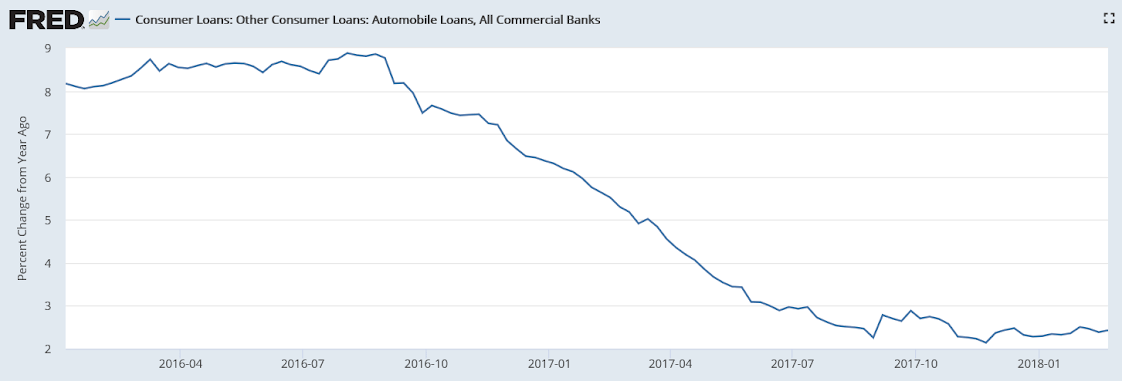
Consumer credit growth was low in 2017 until the what now looks to have been a one time ‘dip into savings’ at year end, with a pronounced flattening most recently:
Low and less than expected, inline with the above bank data above:

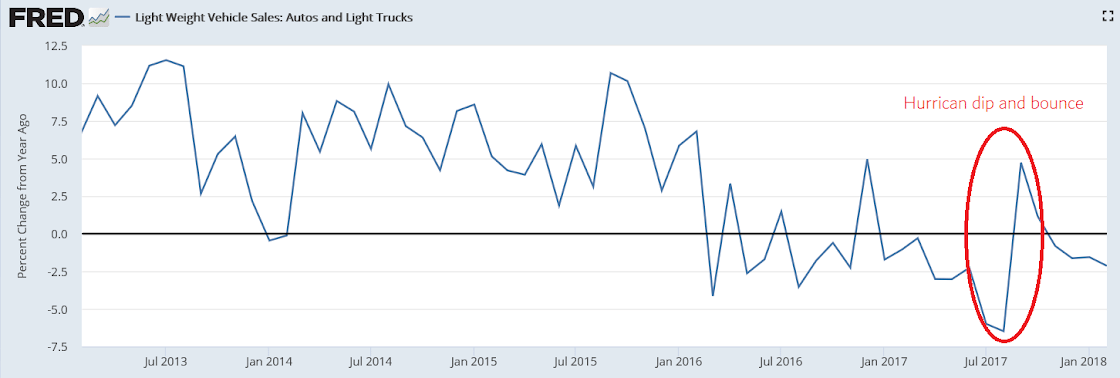
So they’ve finally noticed weakness in housing and cars:

Highlights
Reading the Beige Book can be sobering as the latest edition may be weaker than January’s when at least the Dallas Fed was reporting special strength. But now all 12 districts are back in the “modest-to-moderate” camp with especially soft descriptions for auto sales, which are said to be flat or declining in all districts, and also housing and construction which the report says, outside of isolated strength in some nonresidential markets, is being held down by labor and material shortages.
Las Vegas Real Estate in February: Sales Down 4% YoY, Inventory down 31%
by Bill McBride on 3/07/2018 10:59:00 AMThis is a key distressed market to follow since Las Vegas saw the largest price decline, following the housing bubble, of any of the Case-Shiller composite 20 cities.
Read more at http://www.calculatedriskblog.com/#So8QxRxTRVE157Y7.99
