- S&P/Case Shiller Home Price Index (Released 9:00 EST)
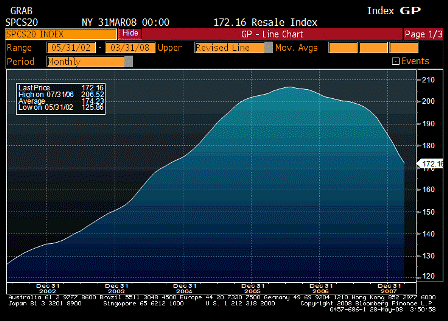
- S&P/Case Shiller Composite-20 YoY (Released 9:00 EST)
- S&P/Case Shiller US HPI (Released 9:00 EST)
- S&P/Case Shiller US HPI YoY% (Released 9:00 EST)
- New Home Sales (Released 10:00 EST)
- New Home Sales MoM (Released 10:00 EST)
- Consumer Confidence (Released 10:00 EST)
- Richmond Fed Manufacturing Index (Released 10:00 EST)
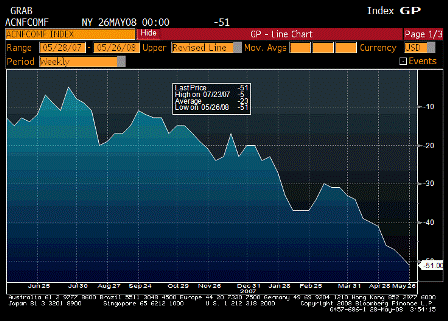
- ABC Consumer Confidence (Released 17:00 EST)
S&P/CaseShiller Home Price Index (Mar)
| Survey | n/a |
| Actual | 172.2 |
| Prior | 175.9 |
| Revised | 176.0 |
Still moving lower. The sample is the 20 largest metro areas which were the regions hit hardest by the speculative bulge.
Broader measures don’t show this kind of depreciation.
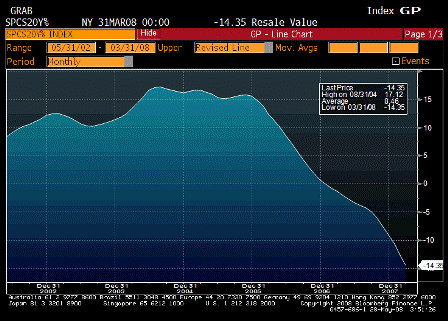
S&P/CS Composite-20 YoY (Mar)
| Survey | -14.2% |
| Actual | -14.4% |
| Prior | -12.7% |
| Revised | n/a |
Same as above.
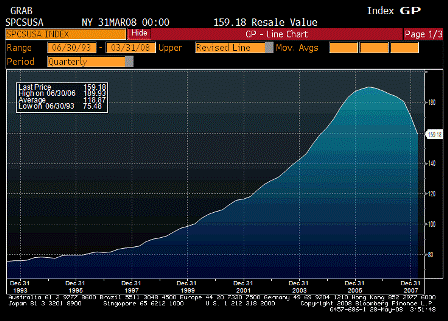
S&P/Case-Shiller US HPI (1Q)
| Survey | n/a |
| Actual | 159.2 |
| Prior | 170.6 |
| Revised | 170.6 |
Same as above.
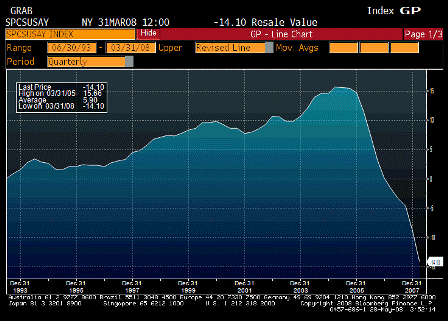
S&P/Case-Shiller US HPI YoY% (1Q)
| Survey | n/a |
| Actual | -14.1% |
| Prior | -8.9% |
| Revised | n/a |
Same as above.
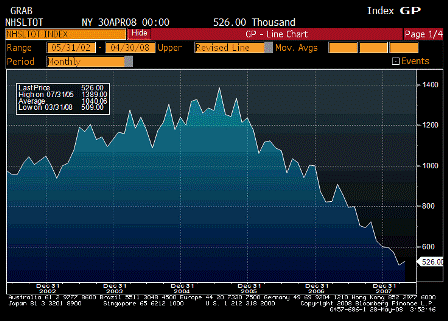
New Home Sales (Apr)
| Survey | 520K |
| Actual | 526K |
| Prior | 526K |
| Revised | 509K |
April up and higher than expected, March revised down some.
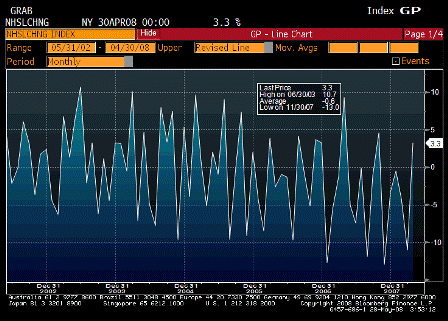
New Home Sales MoM (Apr)
| Survey | -1.1% |
| Actual | 3.3% |
| Prior | -8.5% |
| Revised | -11.0% |
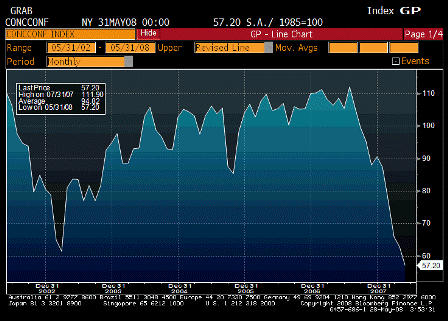
Consumer Confidence (May)
| Survey | 60.0 |
| Actual | 57.2 |
| Prior | 62.3 |
| Revised | 62.8 |
This is what an export economy looks like.
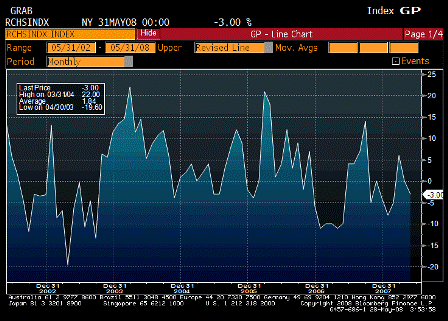
Richmond Fed Manufacturing Index (May)
| Survey | 1 |
| Actual | -3 |
| Prior | 0 |
| Revised | n/a |
[comments]
ABC Consumer Confidence (May 25)
| Survey | -49 |
| Actual | -51 |
| Prior | -49 |
| Revised | n/a |
As above. Consumers are getting squeezed by inflation, while exports boom.
[top]

