MBA Purchase Applications

Highlights
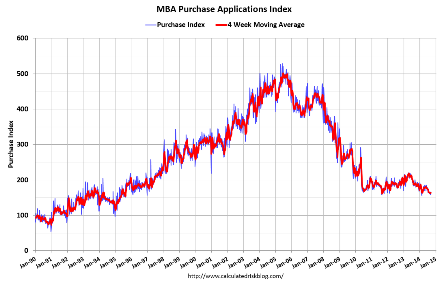
Rising rates are pulling down mortgage activity and are a new threat to the housing market. The purchase index fell 0.3 percent in the September 19 week and is down a very heavy 16 percent year-on-year.

Full size image
Good news on new home sales, but the 50% gain in the West and 29.2% gain in the East seem suspect?
In any case it’s still very low, and with both mortgage purchase apps down and cash buyers down total housing sales are unlikely to rise.
Also note new home sales are booked at signing, while existing home sales are booked at closing, so these are sales that will hopefully close about 90 days from now:
New Home Sales
Highlights
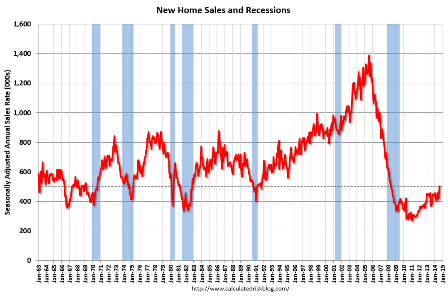
In a report that is frequently volatile, new home sales surged 18.0 percent in August to a much higher-than-expected annual rate of 504,000. To underscore the volatility, the high-end Econoday forecast was 465,000!
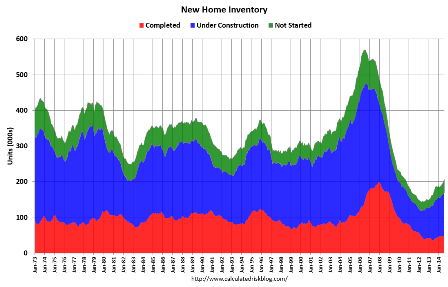
Low supply has been a stubborn problem holding down both sales of new homes and existing homes, and the surge in August sales has made this problem more pronounced. Supply of new homes at the current sales rate fell in August to 4.6 months from 5.6 months in the prior month. Builders will likely be scrambling to bring new homes onto the market which in August totaled 203,000 units vs 201,000 in July.
Prices may no longer be holding down sales, falling 1.6 percent on the median in the month to $275,600. Year-on-year, the median was up 8.0 percent in August which sounds high but not against the 33.0 percent gain in sales.
Looking regionally at sales, sales surged 50.0 percent in the West followed by a 29.2 percent gain in the East. In the South, where more new homes are sold than all other regions combined, sales rose 7.8 percent.
This report is a reminder of the home builders’ housing market index where the traffic component, which had been lagging badly, is suddenly surging. But whether the strength in today’s report can be extended and whether August’s gain will be revised downward are uncertain. Note that revisions to this series are often as volatile as any single month’s headline.
Sales were up but remain at historically low levels:

Full size image

Full size image
U.S. Architecture Billings Index falls in August
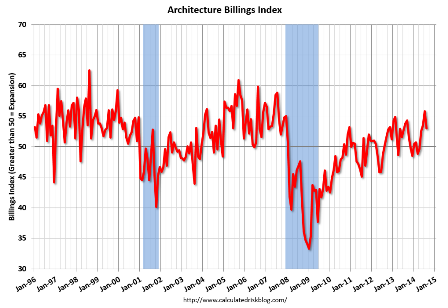
Sept 24 (Reuters) — The Architecture Billings Index, an indicator of U.S. non-residential building activity, fell slightly in August, after hitting a seven-year high the previous month.
The ABI stood at 53.0 in August, down from 55.8 in July, the American Institute of Architects said on Wednesday.
The index, based on a survey of U.S. architects, reflects the roughly nine to 12 months between architecture billings andconstruction spending.
A reading above 50 indicates an increase in billings.
The new projects inquiry index was 62.6, following a very strong mark of 66.0 the previous month.
Full size image


