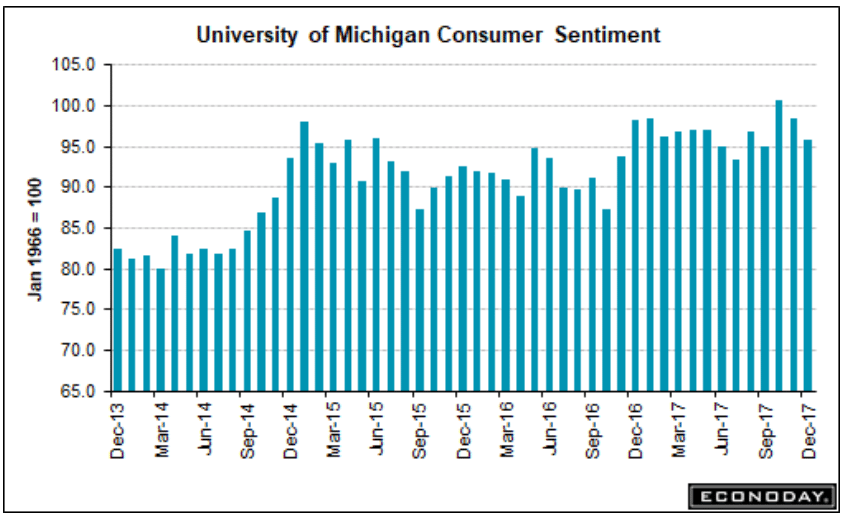
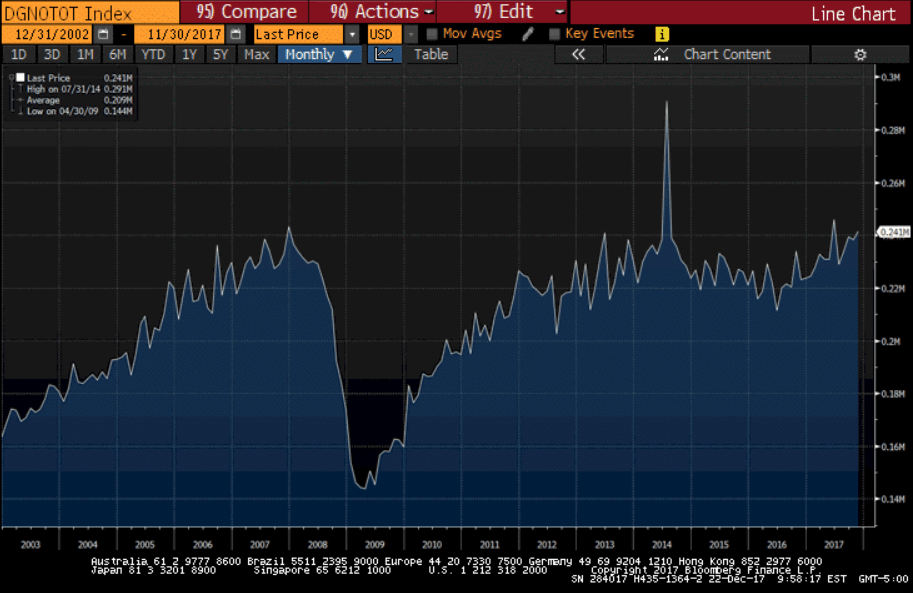
As previously discussed, durable goods and manufacturing, after dipping in 2015 with collapse of oil capex, resumed modest growth from the lower levels which continues:
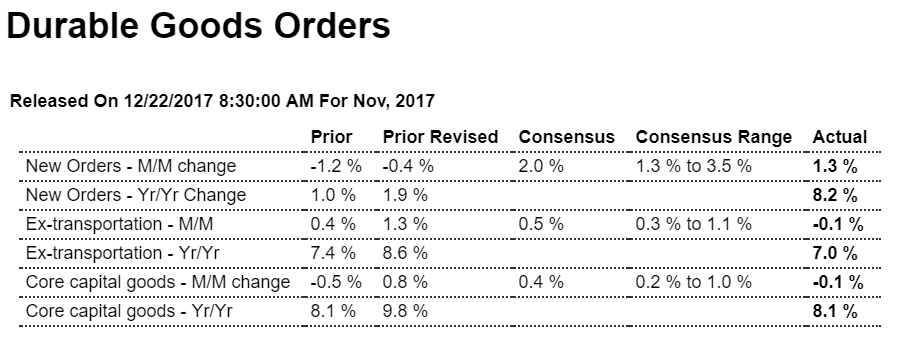
Highlights
A jump in aircraft skewed durable goods orders 1.3 percent higher in November which however is well below Econoday’s consensus for 2.0 percent and no better than the low estimate. Orders for civilian aircraft, which have been solid this year, rose 31 percent and reflect Boeing’s success at November’s Dubai Air Show. But when excluding aircraft and other transportation equipment, orders slipped 0.1 percent in a drop offset however by a large upward revision to October’s ex-transportation reading which now stands at a very strong 1.3 percent.
Weakness in the latest month and an upward revision to the prior month is also the story for core capital goods orders (nondefense ex-aircraft) which also slipped 0.1 percent in November but with October now up an impressive 0.8 percent. Shipments of core capital goods, which will be part of the business spending component of fourth-quarter GDP, are only moderate, up 0.2 percent and 0.3 percent in November and October respectively.
Both vehicle orders and vehicle shipments have been strong the past two reports, up 1.4 percent for each in November following 1.6 percent gains for each in October. Orders for electrical equipment, reflecting demand for both capital goods and construction, have also been strong as have orders and shipments for primary metals. Orders for machinery, computers and defense aircraft have been mixed.
Other data include a strong 1.0 percent rise in total shipments against only a 0.2 percent build for inventories which drives down the inventory-to-shipments ratio to a yet leaner 1.66 from 1.67. Low inventories in times of expanding demand are a positive for the production and employment outlooks. A disappointment in the report, as it has been all year, are unfilled orders which managed to inch only 0.1 percent in the month.
This is very much like this morning’s personal income & outlays report, mostly strong but still not as strong as expected and with weak spots here and there. And like last week’s release of the 0.2 percent gain for November manufacturing production, the data are pointing to a favorable but perhaps still moderate factory contribution to the fourth-quarter economy.
This is where it still doesn’t add up for me. With personal spending exceeding personal income, spending has been sustained by dipping into savings (and in this latest month spending was ‘forced’ by higher gas prices). And even then this spending more than income usually takes the form of accelerating consumer borrowing, where this time around consumer borrowing is decelerating, making the total prior spending even less probable.
A few things could typically happen. Prior spending could be revised substantially lower, which would make all the pieces fit. Or subsequent spending could sufficiently collapse to restore a more normal savings rate.
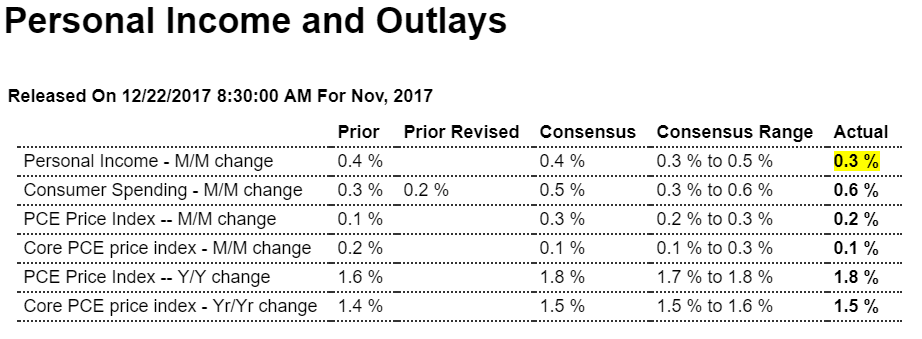
Highlights
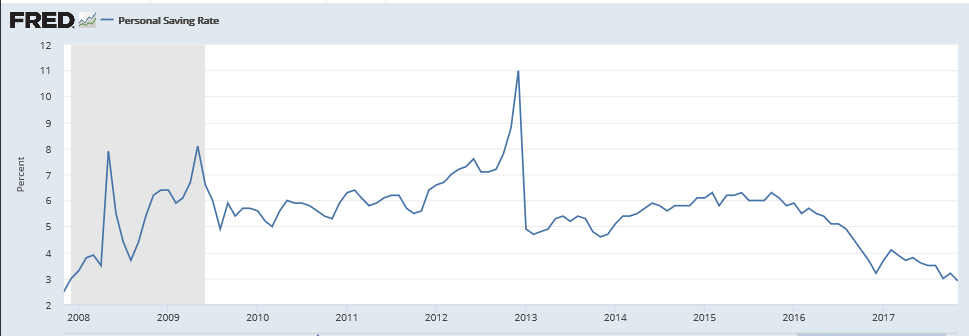
Consumer spending, up 0.6 percent in November, is strong but there are still soft spots in the personal income and outlays report. Income rose only 0.3 percent as transfer receipts from the government fell sharply to offset a respectable 0.4 percent gain in wages and salaries. And behind the rise in consumer spending is a 1.2 percent spike in nondurable spending that reflects higher gasoline prices in the month. Durable spending, held down by a slowing in vehicle sales, was unchanged in November though service spending accelerated 4 tenths to a strong 0.6 percent monthly gain. Behind all the spending was a sharp 3 tenths drawdown in the savings rate to only 2.9 percent which is the weakest showing in 10 years, since November 2007.
The central trouble is once again in the report’s inflation data as the core PCE price index, the most closely followed of any inflation indicator and which excludes energy and food, inched only 0.1 percent higher with the year-on-year rate also 1 tenth higher at 1.5 percent and still far below the Federal Reserve’s 2 percent target. The overall PCE price index rose 0.2 percent with this year-on-year rate up 2 tenths to 1.8 percent.
The inflation data are moving in the right direction but just barely. And while the spending and wage data are favorable, the low level of the savings rate may become a concern especially if the labor market begins to lose strength. For retailers and holiday spending, today’s report is solid but still less than robust. Watch later this morning at 10:00 a.m. ET for the latest update on consumer sentiment.
Not how when income growth slowed savings began to collapse:
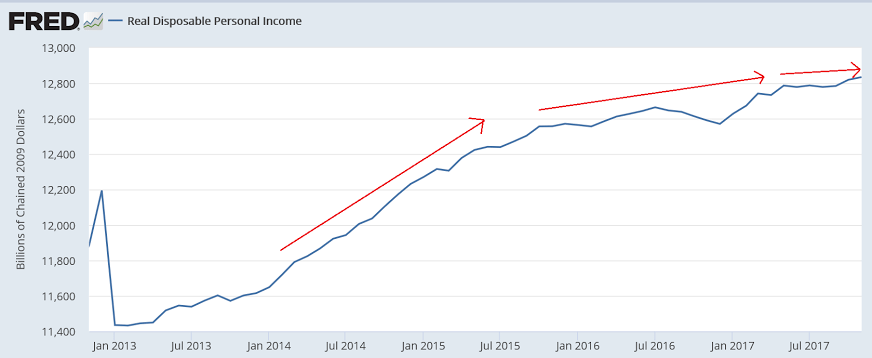
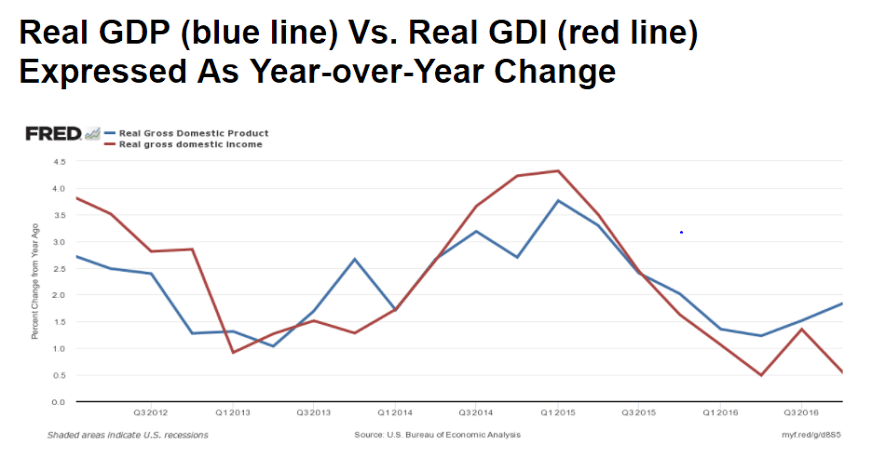
GDP=GDI as the $ received from selling things are also the income from selling those things. But the information for the two series come from different sources, with quite a bit of estimating so the two reports often diverge, etc. Currently reported GDI growth has been decelerating more in line with the above discussions, so it wouldn’t surprise me if future GDP reports quickly work their way lower:
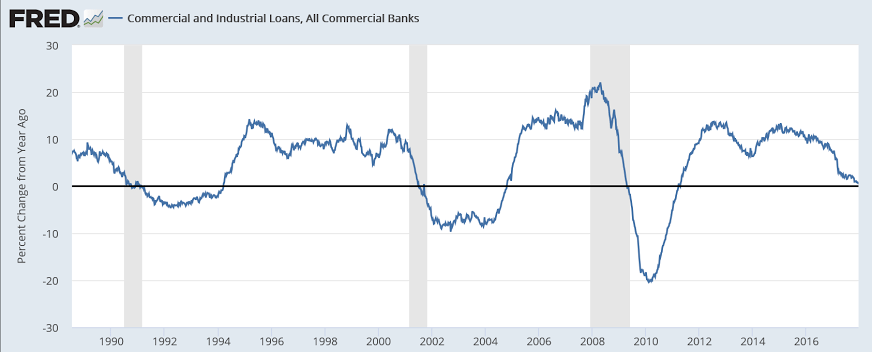
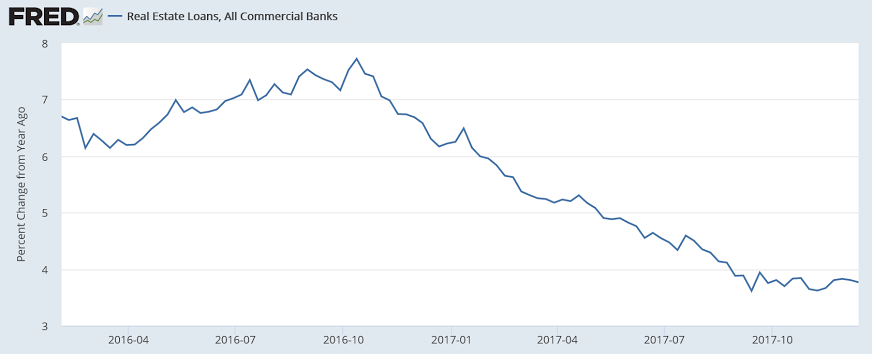
The deceleration in bank lending could be telling us this cycle has ended:
Seems best to wait for the revisions to this month’s report after seeing how much lower the prior reports were revised and how improbably large the increases for the month were:

Highlights
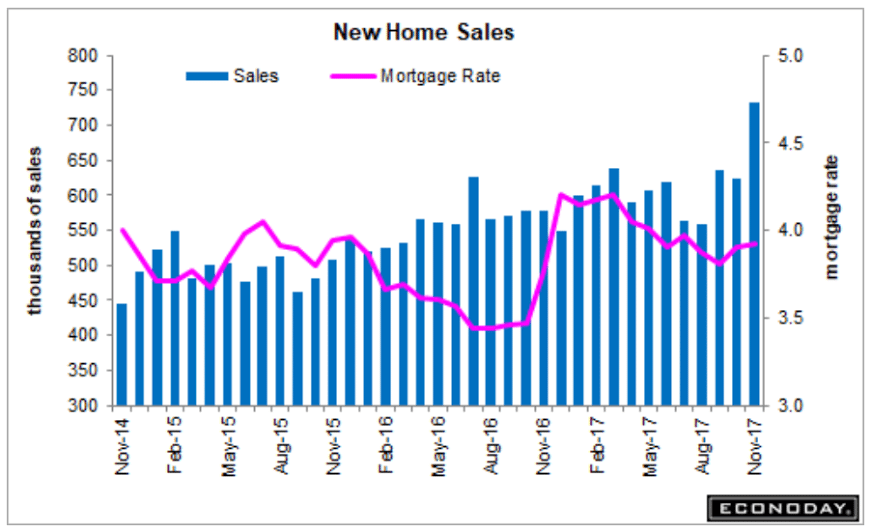
New home sales rose to a 733,000 annualized rate in November for a 17.5 percent monthly spike that is the largest in 25 years. Revisions are only limited offsets, down a net 71,000 in October and September to still 600,000 plus rates of 624,000 in October and 635,000 in September. Acceleration over the last three reports is the strongest since 2003.
But home builders do seem to be giving discounts as the median price fell 0.3 percent in the month to $318,700. Year-on-year, the median is up only 1.2 percent against a 26.6 percent sales surge. On supply, builders are managing to keep pace with the number of new homes on the market unchanged at 283,000 and also unchanged relative to sales, at 4.6 months.
The West and South, the two key regions for new homes, are showing special strength. Sales in the West rose 31.1 percent in the month to a 194,000 rate and a 22.8 percent year-on-year gain, while sales in the South rose a monthly 14.9 percent to 416,000 for a yearly 32.5 percent gain. Sales in the Northeast, both for new homes and existing homes, have been showing unusual acceleration, rising 9.5 percent in the month but to a 46,000 rate that in size is far below other regions.
New home sales are always volatile due to low sample sizes but the report right now is easily the hottest of any economic indicator, in what is certainly a reflection of the strong labor and stock markets as well as favorable pricing. Together with the gains for permits and existing home sales earlier in the week, housing clearly looks to be a leading force for the fourth-quarter economy.
Prior to this latest data point, sales are now looking much weaker than before today’s downward revisions:
Trumped up expectations coming back down again:
