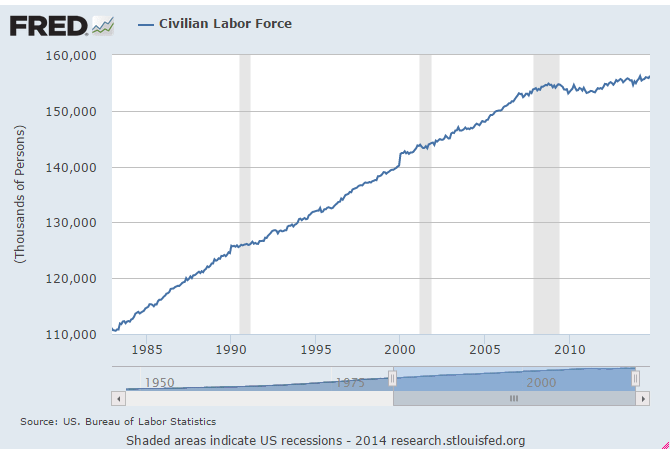
Note the labor force grew continuously then hit a brick wall with the collapse in aggregate demand in 2008 and has yet to resume it’s prior rate of growth. This has all been attributed to ‘demographics’ by the mainstream:

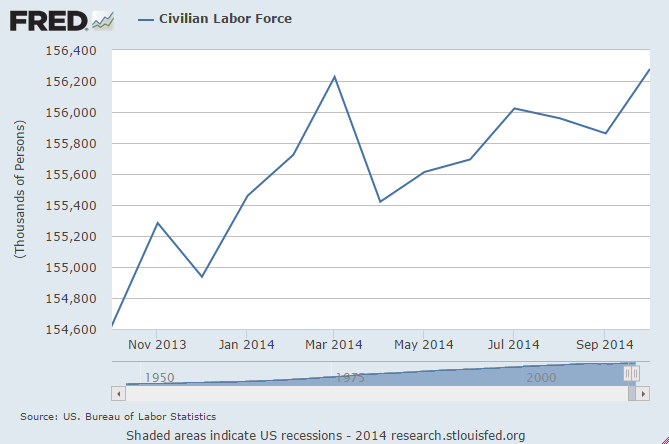
This is the same chart but just for the last year. Note the drop off at the end of 2013 as cold weather hit and subsequent increase through the peak in April when the new jobs report peaked as well.

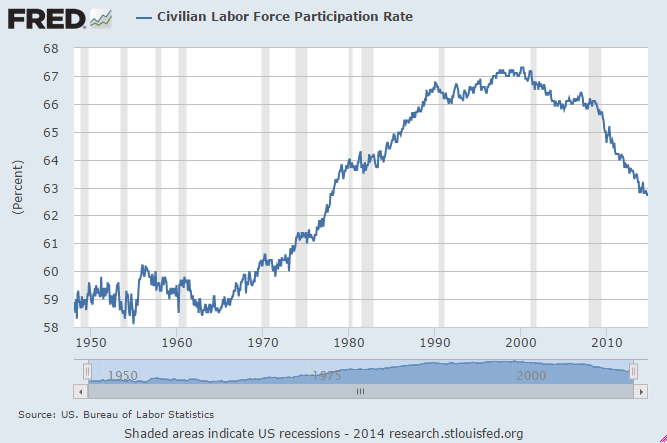
So what’s happened is that most new hires came from ‘new entries’ into the labor force rather than the ‘unemployed’ and unemployment has gone down largely as a function of the growing labor force. The participation rate tells the same story:

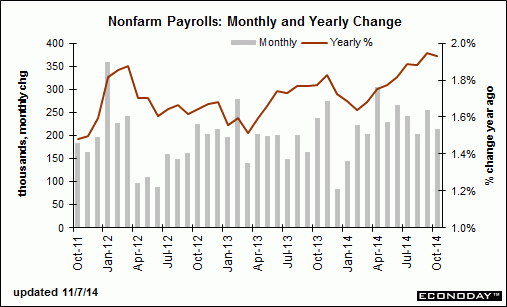
New jobs peaked in April and have been working their way lower. We’ll see Friday if that continues.

