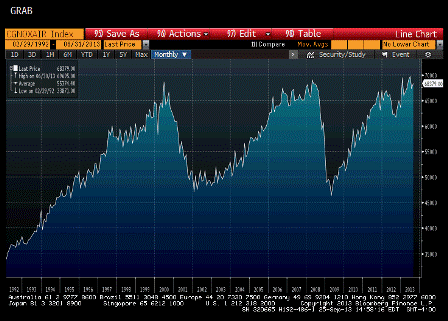
This chart from today’s release is the proxy for capital expenditures.
It looks like it’s leveled off this year after climbing only back to prior peaks from 2000 and 2008, which means on a inflation adjusted and per capita basis it’s stalled at seriously depressed levels? And for the year it’s only growing at about 4%.

Full size image
