- Housing Starts (Released 8:30 EST)
- Building Permits (Released 8:30 EST)
- Initial Jobless Claims (Released 8:30 EST)
- Continuing Claims (Released 8:30 EST)
- Jobless Claims ALLX (Released 8:30 EST)
- Philadelphia Fed (Released 10:00 EST)
- Philadelphia Fed TABLE 1 (Released 10:00 EST)
- Philadelphia Fed TABLE 2 (Released 10:00 EST)
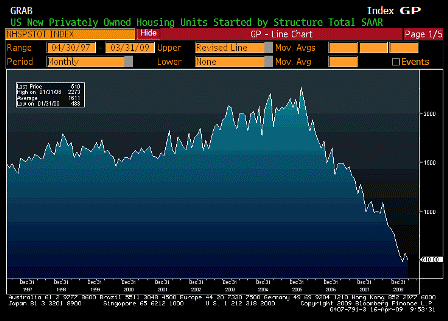
Housing Starts (Mar)
| Survey | 540K |
| Actual | 510K |
| Prior | 583K |
| Revised | 572K |
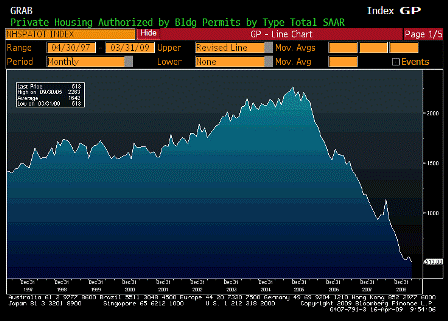
Building Permits (Mar)
| Survey | 549K |
| Actual | 513K |
| Prior | 547K |
| Revised | 564K |
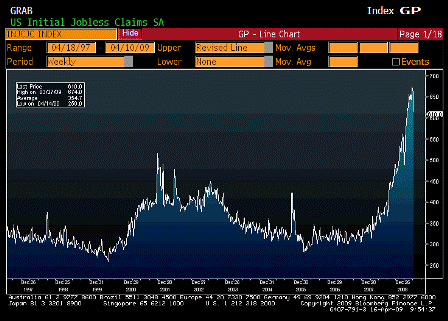
Initial Jobless Claims (Apr 11)
| Survey | 660K |
| Actual | 610K |
| Prior | 654K |
| Revised | 663K |
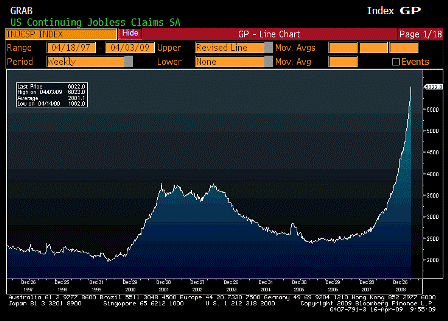
Continuing Claims (Apr 4)
| Survey | 5893K |
| Actual | 6022K |
| Prior | 5840K |
| Revised | 5850K |
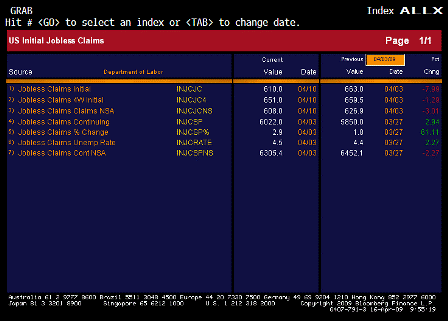
Jobless Claims ALLX (Apr 11)

Philadelphia Fed (Apr)
| Survey | -32.0 |
| Actual | -24.4 |
| Prior | -35.0 |
| Revised | n/a |
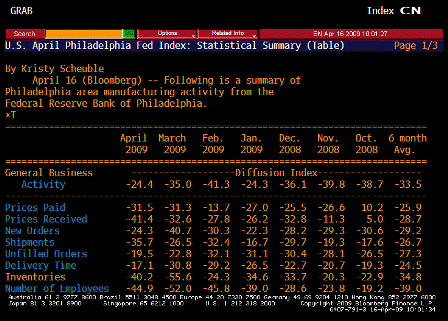
Philadelphia Fed TABLE 1 (Apr)
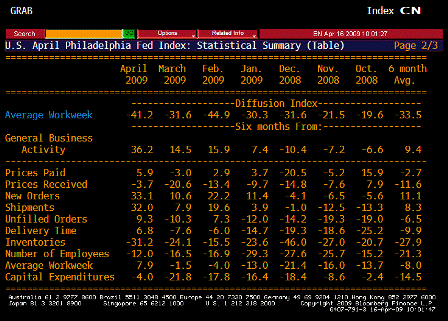
Philadelphia Fed TABLE 2 (Apr)
[top]


