- MBA Mortgage Applications (Released 7:00 EST)
- MBA Purchasing Applications (Released 7:00 EST)
- MBA Refinancing Applications (Released 7:00 EST)
- Consumer Price Index MoM (Released 8:30 EST)
- CPI Ex Food and Energy MoM (Released 8:30 EST)
- Consumer Price Index YoY (Released 8:30 EST)
- CPI Ex Food and Energy YoY (Released 8:30 EST)
- CPI Core Index SA (Released 8:30 EST)
- Consumer Price Index NSA (Released 8:30 EST)
- Empire State Manufacturing Survey (Released 8:30 EST)
- Empire State Manufacturing Survey ALLX 1 (Released 8:30 EST)
- Empire State Manufacturing Survey ALLX 2 (Released 8:30 EST)
- Net Long Term TIC Flows (Released 9:00 EST)
- Total Net TIC Flows (Released 9:00 EST)
- Industrial Production MoM (Released 9:15 EST)
- Industrial Production YoY (Released 9:15 EST)
- Capacity Utilization (Released 9:15 EST)
- Capacity Utilization TABLE 1 (Released 9:15 EST)
- Capacity Utilization TABLE 2 (Released 9:15 EST)
- Capacity Utilization TABLE 3 (Released 9:15 EST)
- NAHB Housing Market Index (Released 13:00 EST)
- NAHB Housing Market Index TABLE 1 (Released 13:00 EST)
- NAHB Housing Market Index TABLE 2 (Released 13:00 EST)
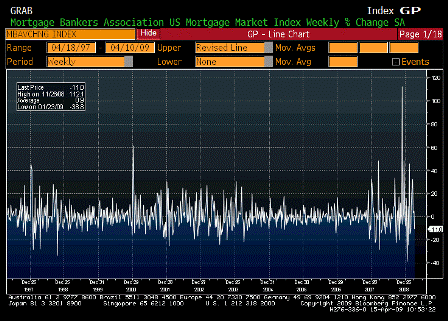
MBA Mortgage Applications (Apr 10)
| Survey | n/a |
| Actual | -11.0% |
| Prior | 4.7% |
| Revised | n/a |
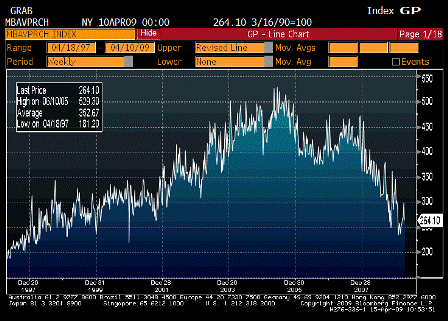
MBA Purchasing Applications (Apr 10)
| Survey | n/a |
| Actual | 264.10 |
| Prior | 297.70 |
| Revised | n/a |
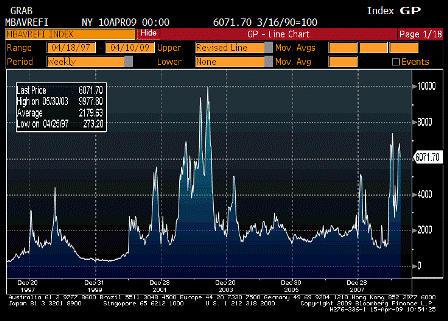
MBA Refinancing Applications (Apr 10)
| Survey | n/a |
| Actual | 6071.70 |
| Prior | 6813.50 |
| Revised | n/a |
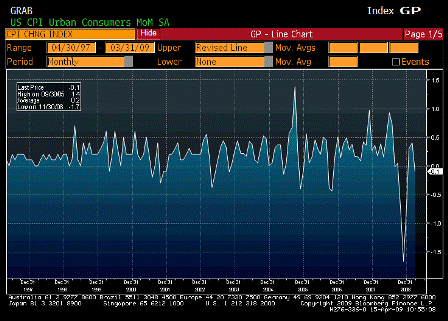
Consumer Price Index MoM (Mar )
| Survey | 0.1% |
| Actual | -0.1% |
| Prior | 0.4% |
| Revised | n/a |
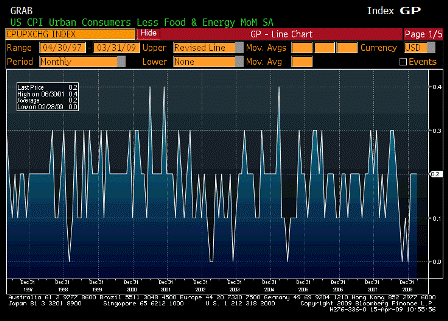
CPI Ex Food and Energy MoM (Mar)
| Survey | 0.1% |
| Actual | 0.2% |
| Prior | 0.2% |
| Revised | n/a |
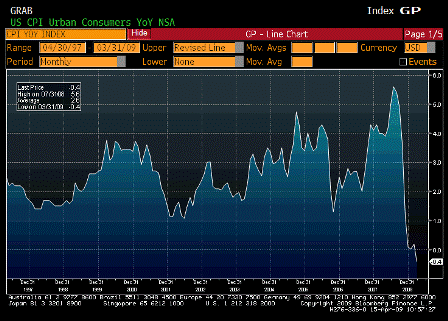
Consumer Price Index YoY (Mar)
| Survey | -0.1% |
| Actual | -0.4% |
| Prior | 0.2% |
| Revised | n/a |
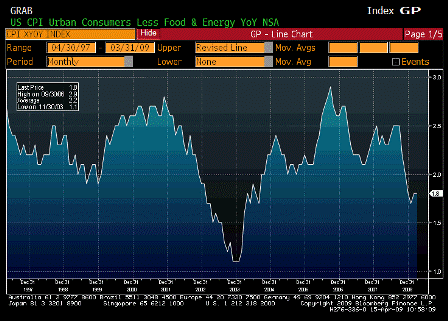
CPI Ex Food and Energy YoY (Mar)
| Survey | 1.7% |
| Actual | 1.8% |
| Prior | 1.8% |
| Revised | n/a |
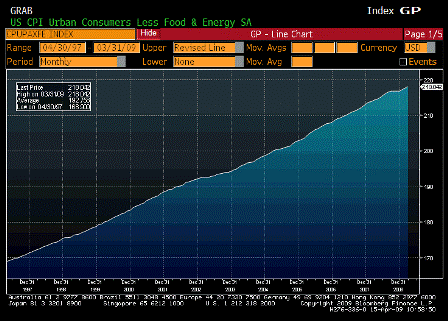
CPI Core Index SA (Mar)
| Survey | n/a |
| Actual | 218.042 |
| Prior | 217.670 |
| Revised | n/a |
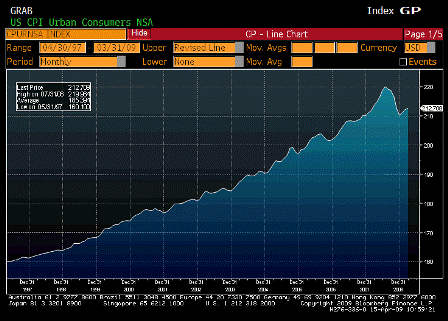
Consumer Price Index NSA (Mar)
| Survey | 212.900 |
| Actual | 212.709 |
| Prior | 212.193 |
| Revised | n/a |
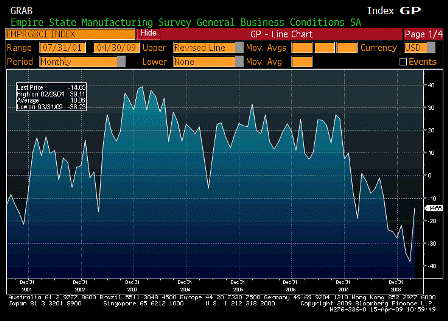
Empire State Manufacturing Survey (Apr)
| Survey | -35.00 |
| Actual | -14.65 |
| Prior | -38.23 |
| Revised | n/a |
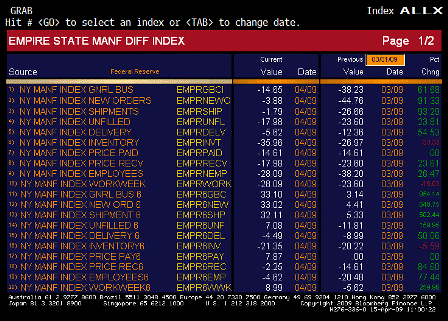
Empire State Manufacturing Survey ALLX 1 (Apr)
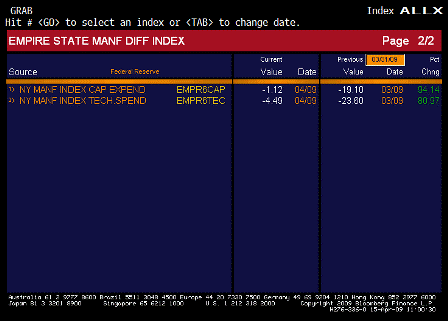
Empire State Manufacturing Survey ALLX 2 (Apr)
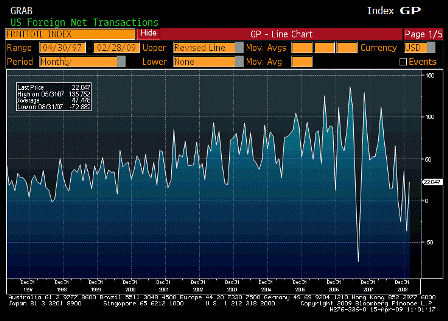
Net Long Term TIC Flows (Feb)
| Survey | $14.0B |
| Actual | $22.0B |
| Prior | -$43.0B |
| Revised | -$36.8B |
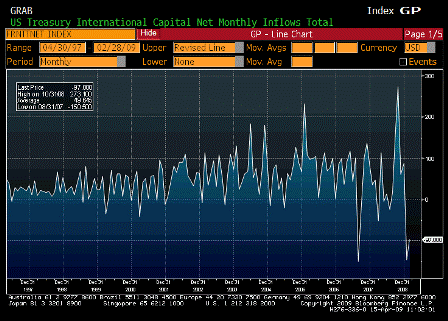
Total Net TIC Flows (Feb)
| Survey | n/a |
| Actual | -$97.0B |
| Prior | -$148.9B |
| Revised | -$146.8B |
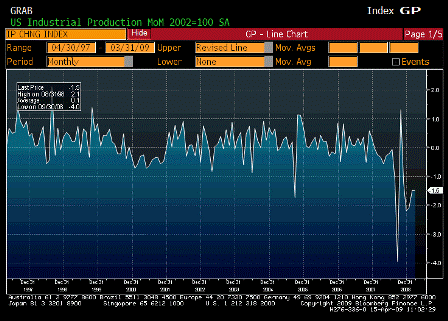
Industrial Production MoM (Mar)
| Survey | -0.9% |
| Actual | -1.5% |
| Prior | -1.4% |
| Revised | -1.5% |
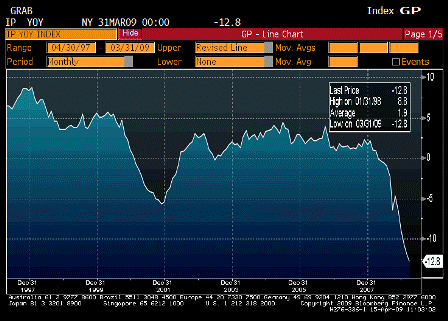
Industrial Production YoY (Mar)
| Survey | n/a |
| Actual | -12.8% |
| Prior | -11.8% |
| Revised | n/a |
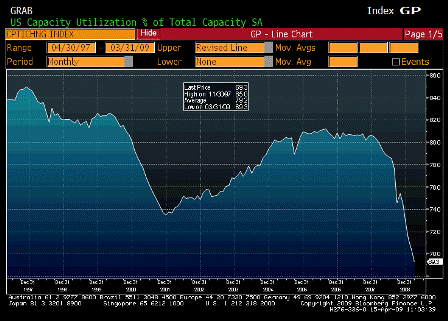
Capacity Utilization (Mar)
| Survey | 69.6% |
| Actual | 69.3% |
| Prior | 70.9% |
| Revised | 70.3% |
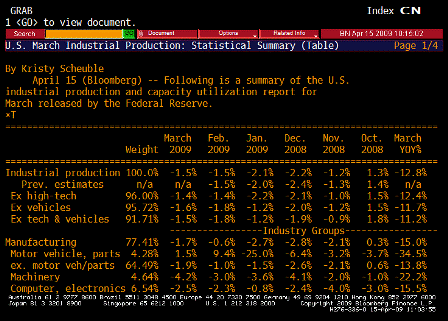
Capacity Utilization TABLE 1 (Mar)
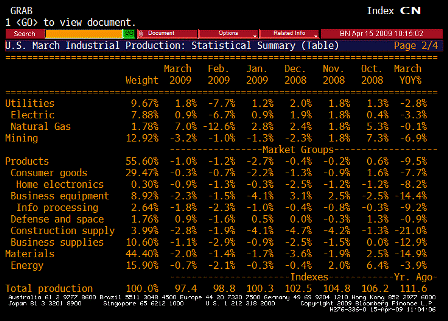
Capacity Utilization TABLE 2 (Mar)
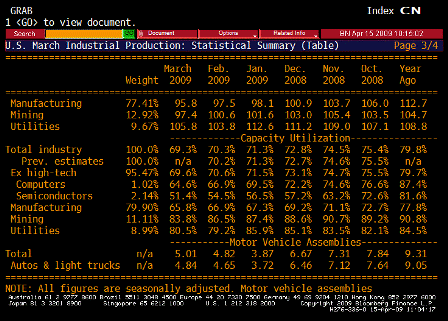
Capacity Utilization TABLE 3 (Mar)
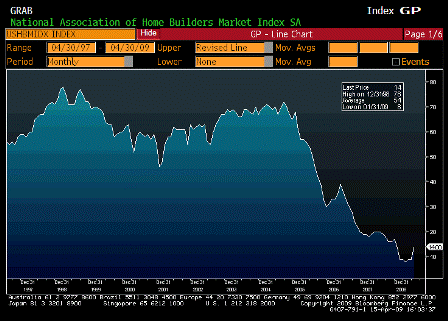
NAHB Housing Market Index (Apr)
| Survey | 10 |
| Actual | 14 |
| Prior | 9 |
| Revised | n/a |
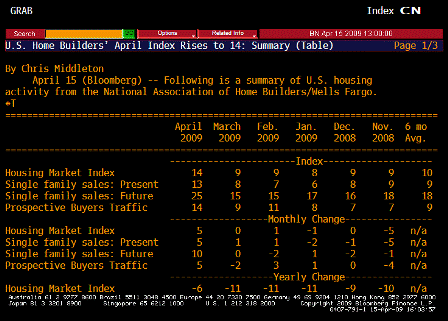
NAHB Housing Market Index TABLE 1 (Mar)
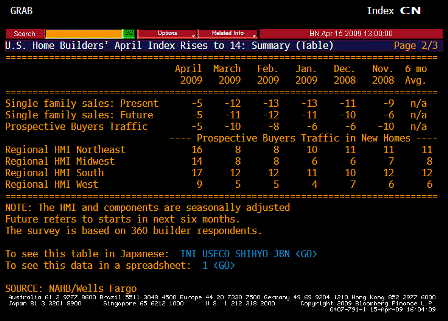
NAHB Housing Market Index TABLE 2 (Mar)
[top]


