- ICSC UBS Store Sales YoY (Released 7:45 EST)
- ICSC UBS Store Sales WoW (Released 7:45 EST)
- Redbook Store Sales Weekly YoY (Released 8:55 EST)
- Redbook Store Sales MoM (Released 8:55 EST)
- ICSC UBS Redbook Comparison TABLE (Released 8:55 EST)
- Producer Price Index MoM (Released 8:30 EST)
- PPI Ex Food and Energy MoM (Released 8:30 EST)
- Producer Price Index YoY (Released 8:30 EST)
- PPI Ex Food and Energy YoY (Released 8:30 EST)
- Housing Starts (Released 8:30 EST)
- Building Permits (Released 8:30 EST)
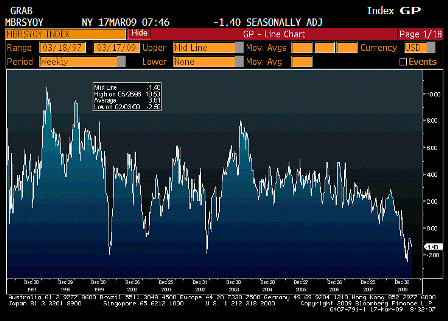
ICSC UBS Store Sales YoY (Mar 17)
| Survey | n/a |
| Actual | -1.4% |
| Prior | -0.9% |
| Revised | n/a |
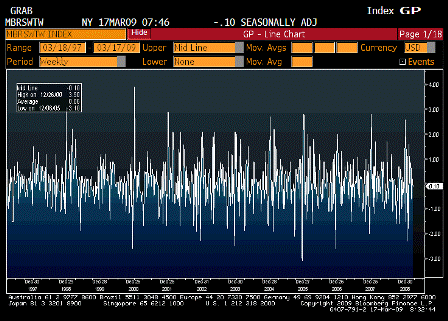
ICSC UBS Store Sales WoW (Mar 17)
| Survey | n/a |
| Actual | -0.1% |
| Prior | 0.2% |
| Revised | n/a |
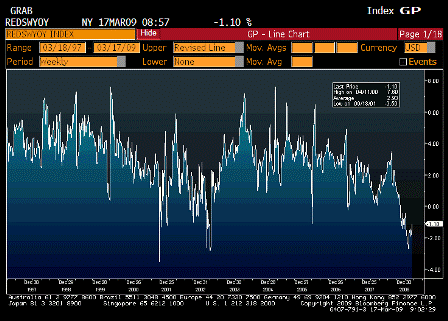
Redbook Store Sales Weekly YoY (Mar 17)
| Survey | n/a |
| Actual | -1.1% |
| Prior | -1.4% |
| Revised | n/a |
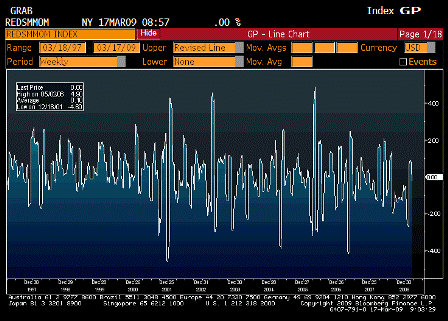
Redbook Store Sales MoM (Mar 17)
| Survey | n/a |
| Actual | 0.0% |
| Prior | -0.2% |
| Revised | n/a |

ICSC UBS Redbook Comparison TABLE (Mar 17)
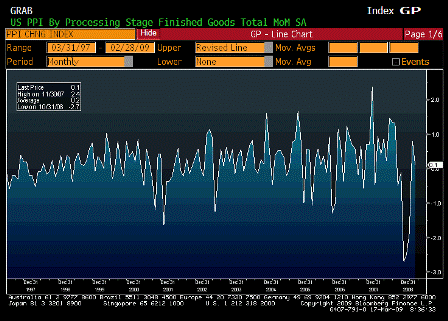
Producer Price Index MoM (Feb)
| Survey | 0.4% |
| Actual | 0.1% |
| Prior | 0.8% |
| Revised | n/a |
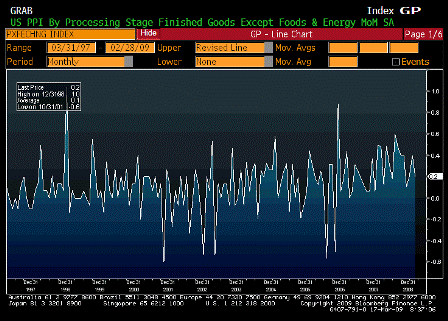
PPI Ex Food and Energy MoM (Feb)
| Survey | 0.1% |
| Actual | 0.2% |
| Prior | 0.4% |
| Revised | n/a |
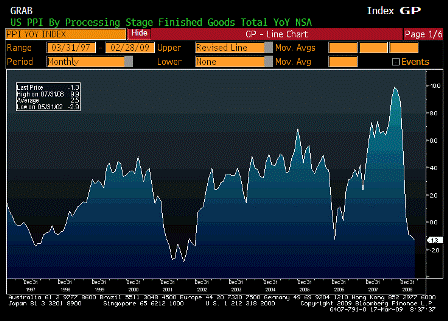
Producer Price Index YoY (Feb)
| Survey | -1.4% |
| Actual | -1.3% |
| Prior | -1.0% |
| Revised | n/a |
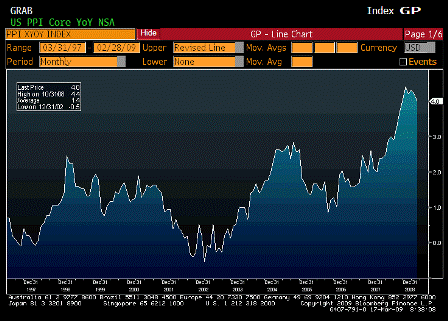
PPI Ex Food and Energy YoY (Feb)
| Survey | 3.8% |
| Actual | 4.0% |
| Prior | 4.2% |
| Revised | n/a |
Core coming down very slowly, given the extent of the drop in headline CPI.
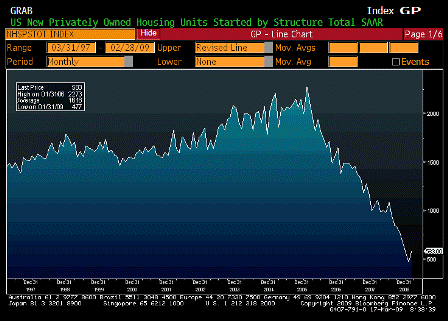
Housing Starts (Feb)
| Survey | 450K |
| Actual | 583K |
| Prior | 466K |
| Revised | 477K |
Probably the end of the housing bust.
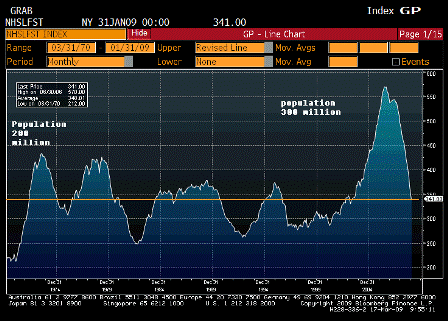
New Homes Inventory (Feb)
New home inventories are exceptionally low, especially population adjusted.
This was a very severe inventory liquidation.
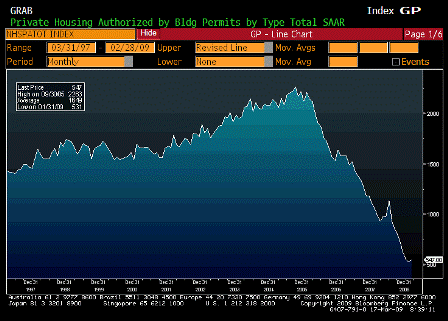
Building Permits (Feb)
| Survey | 500K |
| Actual | 547K |
| Prior | 521K |
| Revised | 531K |
[top]


