- ICSC UBS Store Sales WoW (Released 7:45 EST)
- ICSC UBS Store Sales YoY (Released 7:45 EST)
- Redbook Store Sales Weekly YoY (Released 8:55 EST)
- Redbook Store Sales MoM (Released 8:55 EST)
- ICSC UBS Redbook Comparison TABLE (Released 8:55 EST)
- MBA Mortgage Applications (Released 7:00 EST)
- MBA Purchasing Applications (Released 7:00 EST)
- MBA Refinancing Applications (Released 7:00 EST)
- Import Price Index MoM (Released 8:30 EST)
- Import Price Index YoY (Released 8:30 EST)
- Import Price Index ALLX 1 (Released 8:30 EST)
- Import Price Index ALLX 2 (Released 8:30 EST)
- Housing Starts (Released 8:30 EST)
- Building Permits (Released 8:30 EST)
- Industrial Production MoM (Released 9:15 EST)
- Industrial Production YoY (Released 8:30 EST)
- Capacity Utilization (Released 9:15 EST)
- Capacity Utilization TABLE 1 (Released 9:15 EST)
- Capacity Utilization TABLE 2 (Released 9:15 EST)
- Capacity Utilization TABLE 3 (Released 9:15 EST)
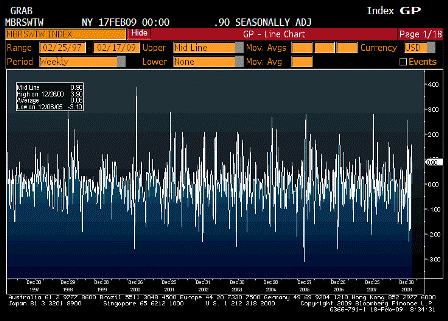
ICSC UBS Store Sales WoW (Feb 10)
| Survey | n/a |
| Actual | 0.90% |
| Prior | 0.00% |
| Revised | n/a |
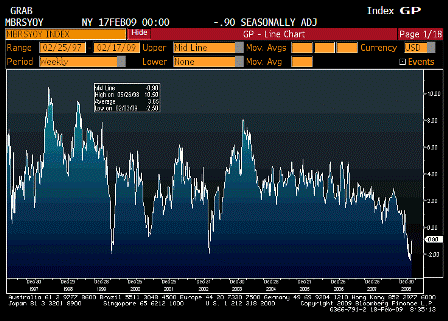
ICSC UBS Store Sales YoY (Feb 10)
| Survey | n/a |
| Actual | -0.90% |
| Prior | -1.80% |
| Revised | n/a |
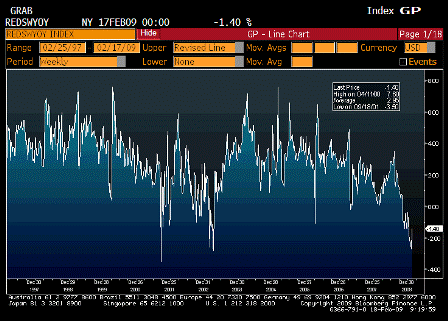
Redbook Store Sales Weekly YoY (Feb 10)
| Survey | n/a |
| Actual | -1.40% |
| Prior | -1.70% |
| Revised | n/a |
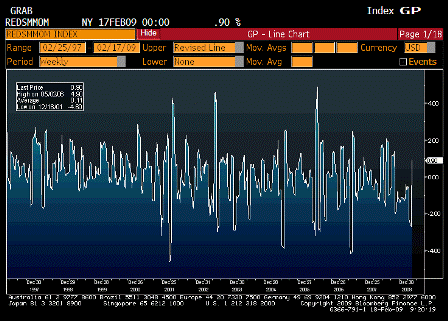
Redbook Store Sales MoM (Feb 10)
| Survey | n/a |
| Actual | 0.90% |
| Prior | 0.70% |
| Revised | n/a |
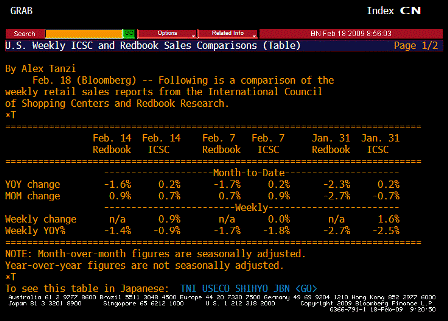
ICSC UBS Redbook Comparison TABLE (Feb 10)
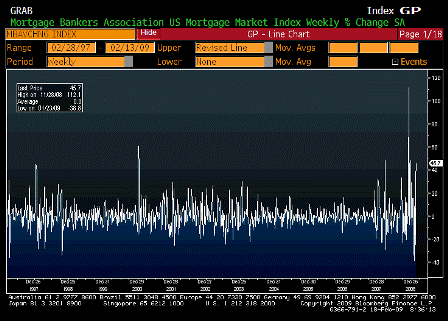
MBA Mortgage Applications (Feb 13)
| Survey | n/a |
| Actual | 45.7% |
| Prior | -24.5% |
| Revised | n/a |
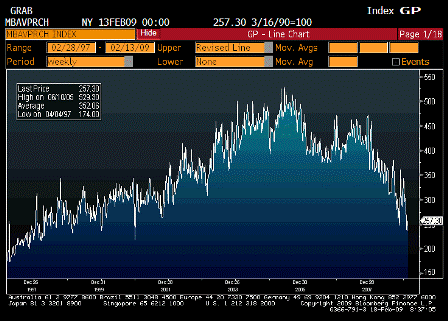
MBA Purchasing Applications (Feb 13)
| Survey | n/a |
| Actual | 257.30 |
| Prior | 235.90 |
| Revised | n/a |
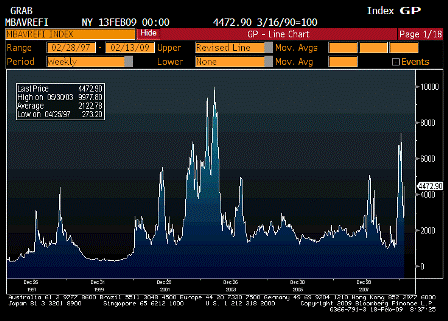
MBA Refinancing Applications (Feb 13)
| Survey | n/a |
| Actual | 4472.90 |
| Prior | 2722.70 |
| Revised | n/a |
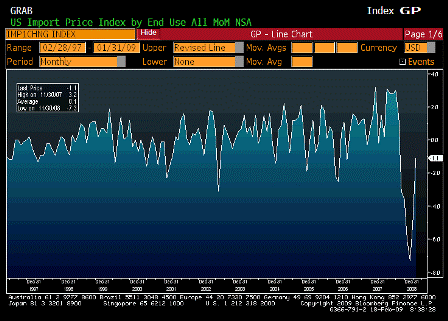
Import Price Index MoM (Jan)
| Survey | -1.2% |
| Actual | -1.1% |
| Prior | -4.2% |
| Revised | -5.0% |
Karim writes:
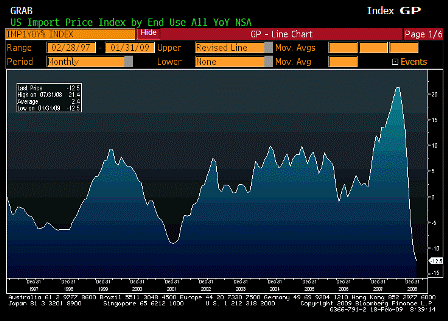
Import Price Index YoY (Jan)
| Survey | -11.2% |
| Actual | -12.5% |
| Prior | -9.3% |
| Revised | -10.3% |
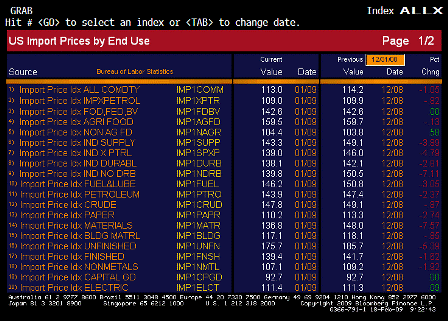
Import Price Index ALLX 1 (Jan)
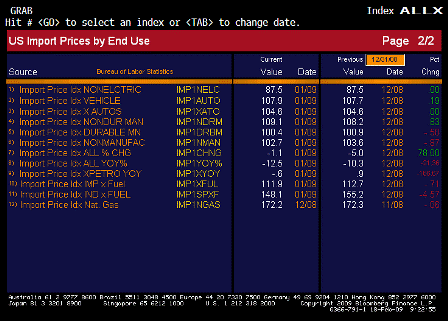
Import Price Index ALLX 2 (Jan)
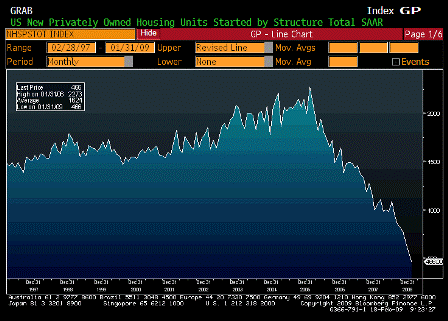
Housing Starts (Jan)
| Survey | 529K |
| Actual | 466K |
| Prior | 550K |
| Revised | 560K |
Karim writes:
Housing starts and building permits fall to all-time lows.
- Starts -16.8% m/m (all 4 regions down) and -56.2% y/y; 3rd consecutive double digit m/m decline
- Permits -4.8% m/m (all 4 regions down)
- When adding the supply of vacant homes (over 1mm) to starts, excess supply (relative to new household formation and obsolesence) still exists and in turn downward pressure on home prices
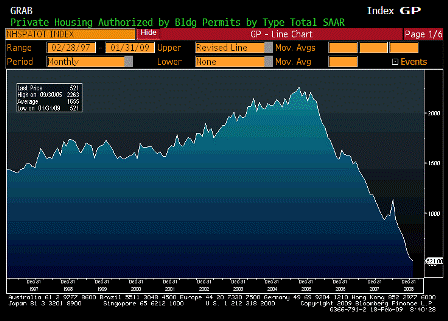
Building Permits (Jan)
| Survey | 525K |
| Actual | 521K |
| Prior | 549K |
| Revised | 547K |
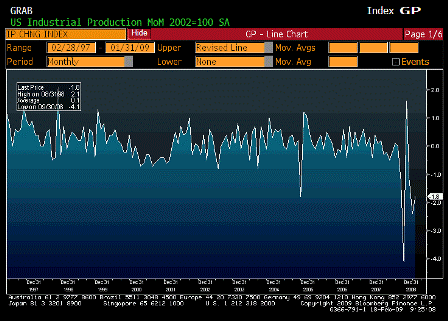
Industrial Production MoM (Jan)
| Survey | -1.5% |
| Actual | -1.8% |
| Prior | -2.0% |
| Revised | -2.4% |
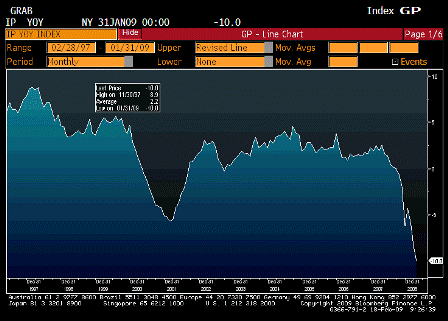
Industrial Production YoY (Jan)
| Survey | n/a |
| Actual | -10.0% |
| Prior | -8.2% |
| Revised | n/a |
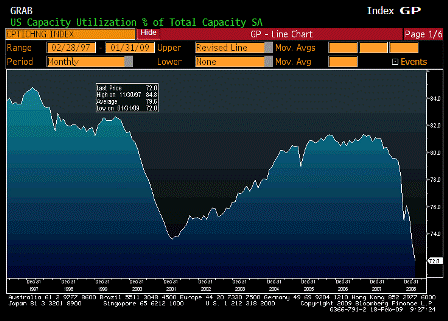
Capacity Utilization (Jan)
| Survey | 72.4% |
| Actual | 72.0% |
| Prior | 73.6% |
| Revised | 73.3% |
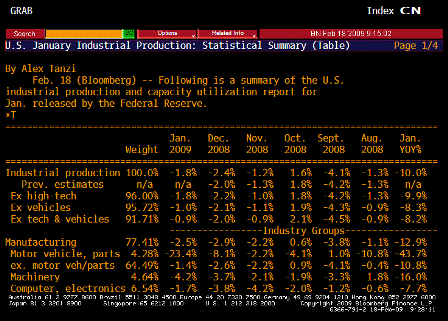
Capacity Utilization TABLE 1 (Jan)
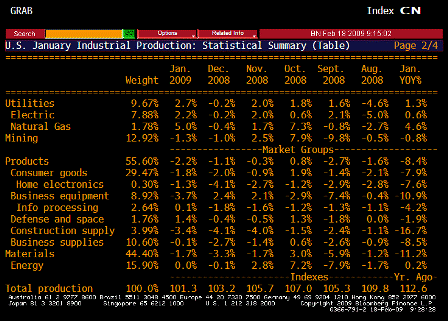
Capacity Utilization TABLE 2 (Jan)
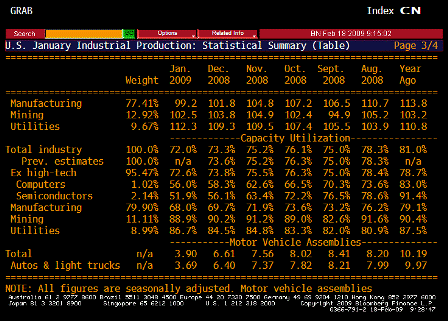
Capacity Utilization TABLE 3 (Jan)
[top]


