- MBA Mortgage Applications (Released 7:00 EST)
- MBA Purchasing Applications (Released 7:00 EST)
- MBA Refinancing Applications (Released 7:00 EST)
- Housing Starts (Released 8:30 EST)
- Building Permits (Released 8:30 EST)
- Initial Jobless Claims (Released 8:30 EST)
- Continuing Claims (Released 8:30 EST)
- Jobless Claims ALLX (Released 8:30 EST)
- House Price Index MoM (Released 10:00 EST)
- House Price Index YoY (Released 10:00 EST)
- House Price Index ALLX (Released 10:00 EST)
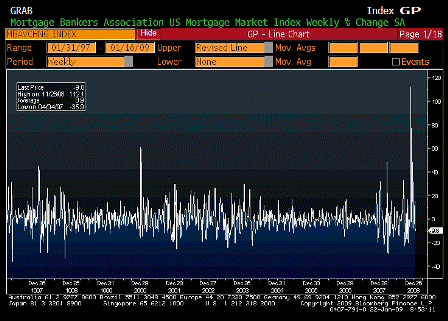
MBA Mortgage Applications (Jan 16)
| Survey | n/a |
| Actual | -9.8% |
| Prior | 15.8% |
| Revised | n/a |
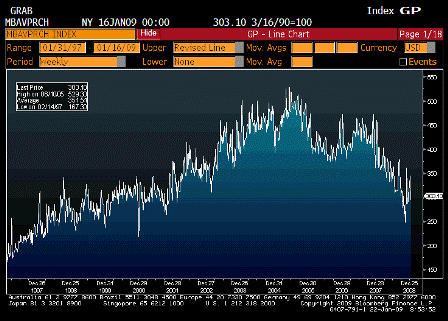
MBA Purchasing Applications (Jan 16)
| Survey | n/a |
| Actual | 303.10 |
| Prior | 295.10 |
| Revised | n/a |
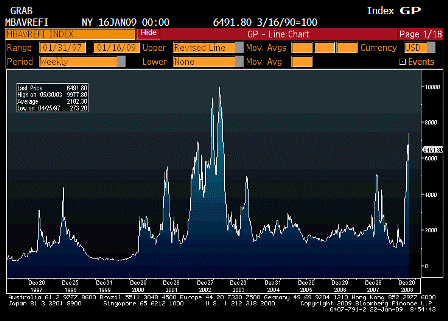
MBA Refinancing Applications (Jan 16)
| Survey | n/a |
| Actual | 6491.80 |
| Prior | 7414.10 |
| Revised | n/a |
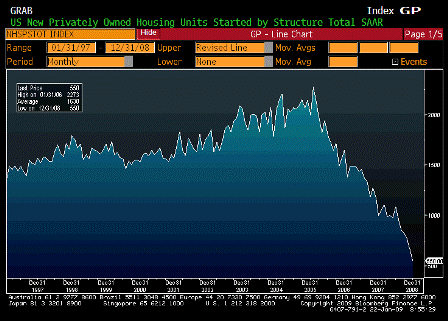
Housing Starts (Dec)
| Survey | 605K |
| Actual | 550K |
| Prior | 625K |
| Revised | 651K |
Karim writes:
- Housing starts fell 16% in December and building permits fell 10.7%, and both to all-time lows in nominal terms.
- These numbers indicate that housing will be a drag on the economy in terms of GDP accounting at least through year-end.
- The level of starts consistent with new household formation (and adjusting for obsolescence of the existing housing stock) is about 1.25mm.
- But what the current level of starts of 550k does not reflect is the record level of vacant homes (about 1mm more than the 1985-2005 average).
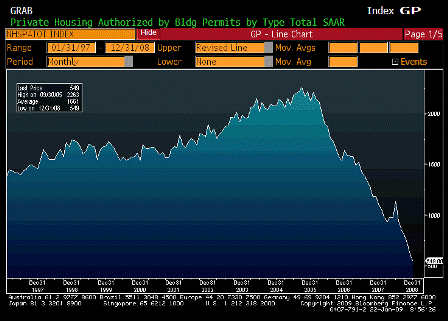
Building Permits (Dec)
| Survey | 600K |
| Actual | 549K |
| Prior | 616K |
| Revised | 615K |
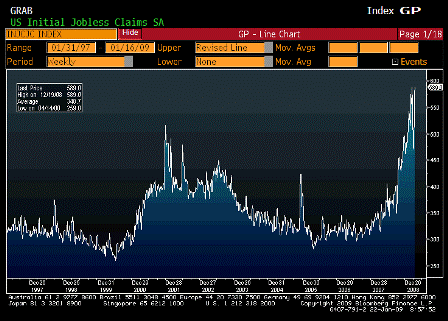
Initial Jobless Claims (Jan 17)
| Survey | 543K |
| Actual | 589K |
| Prior | 524K |
| Revised | 527K |
Karim writes:
- Initial claims jumped 62k to 589k, and continuing claims by 93k to 4607k.
- Both are new highs for the current cycle and the highest since 1982.
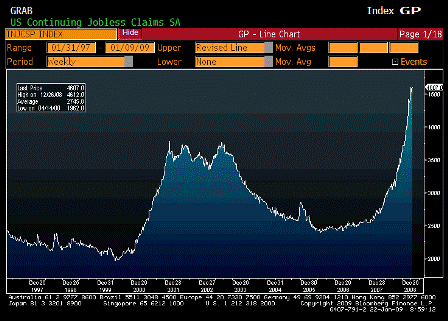
Continuing Claims (Jan 10)
| Survey | 4534K |
| Actual | 4607K |
| Prior | 4497K |
| Revised | 4510K |
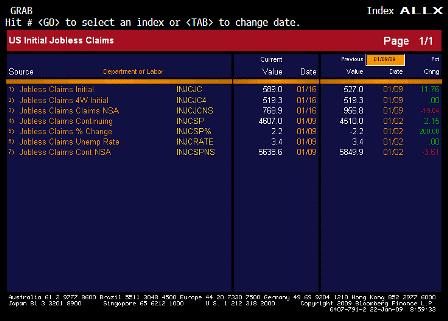
Jobless Claims ALLX (Jan 17)
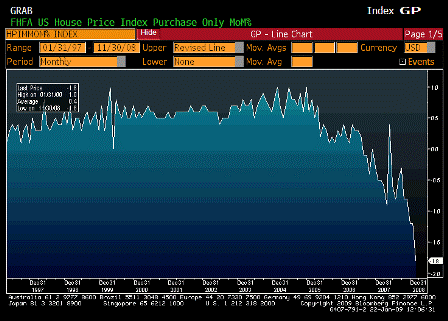
House Price Index MoM (Nov)
| Survey | -1.2% |
| Actual | -1.8% |
| Prior | -1.1% |
| Revised | n/a |
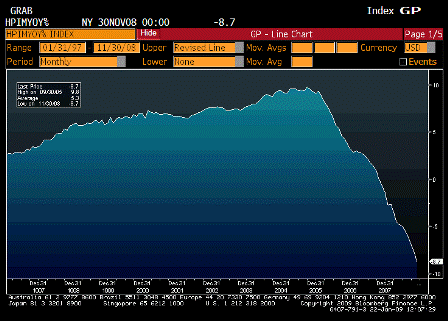
House Price Index YoY (Nov)
| Survey | n/a |
| Actual | -8.7% |
| Prior | -7.6% |
| Revised | n/a |
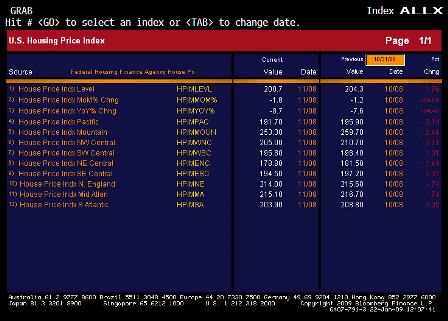
House Price Index ALLX (Nov)
[top]


