- Empire State Manufacturing Survey (Released 8:30 EST)
- Empire State Manufacturing Survey ALLX 1 (Released 8:30 EST)
- Empire State Manufacturing Survey ALLX 2 (Released 8:30 EST)
- Net Long Term TIC Flows (Released 9:00 EST)
- Total Net TIC Flows (Released 9:00 EST)
- TIC ALLX (Released 9:00 EST)
- TIC TABLE 1 (Released 9:00 EST)
- TIC TABLE 2 (Released 9:00 EST)
- TIC TABLE 3 (Released 9:00 EST)
- Industrial Production MoM (Released 9:15 EST)
- Industrial Production YoY (Released 9:15 EST)
- Capacity Utilization (Released 9:15 EST)
- Capacity Utilization TABLE 1 (Released 9:15 EST)
- Capacity Utilization TABLE 2 (Released 9:15 EST)
- Capacity Utilization TABLE 3 (Released 9:15 EST)
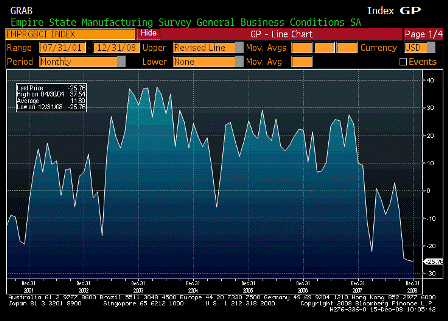
Empire State Manufacturing Survey (Dec)
| Survey | -28.00 |
| Actual | -25.76 |
| Prior | -25.43 |
| Revised | n/a |
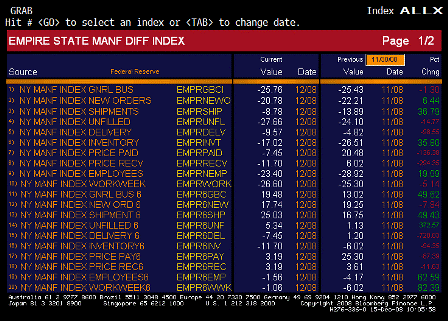
Empire State Manufacturing Survey ALLX 1 (Dec)
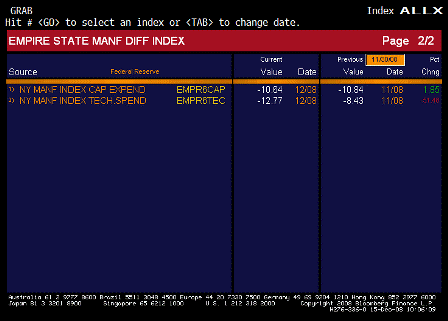
Empire State Manufacturing Survey ALLX 2 (Dec)
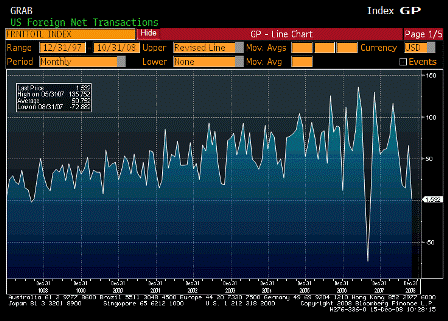
Net Long Term TIC Flows (Oct)
| Survey | $40.0B |
| Actual | $1.5B |
| Prior | $66.2B |
| Revised | $65.4B |
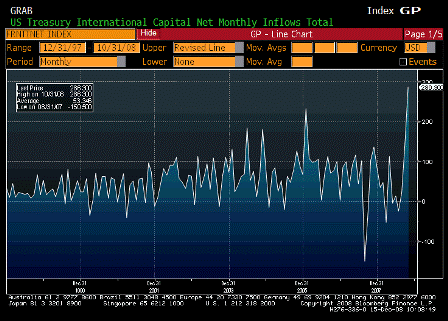
Total Net TIC Flows (Oct)
| Survey | n/a |
| Actual | $286.3B |
| Prior | $143.4B |
| Revised | $142.6B |
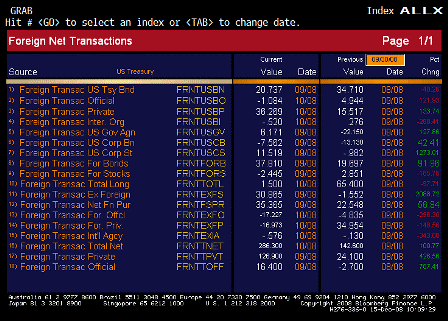
TIC ALLX (Oct)
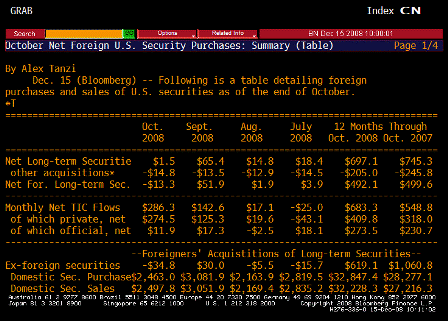
TIC TABLE 1 (Oct)
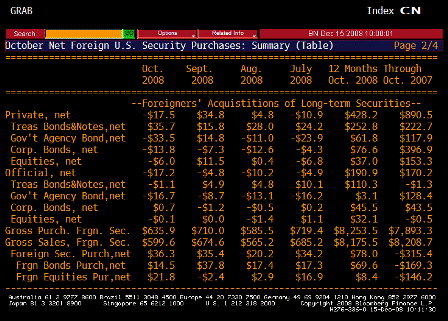
TIC TABLE 2 (Oct)
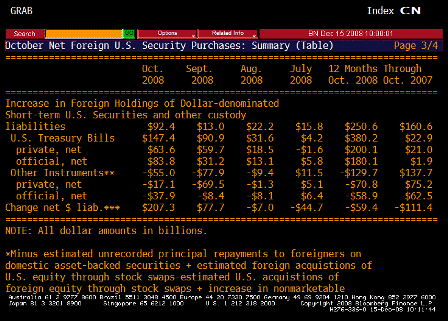
TIC TABLE 3 (Oct)
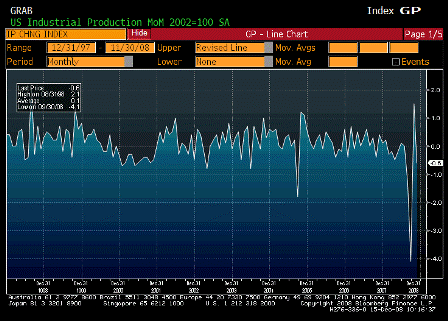
Industrial Production MoM (Nov)
| Survey | -0.8% |
| Actual | -0.6% |
| Prior | 1.3% |
| Revised | 1.5% |
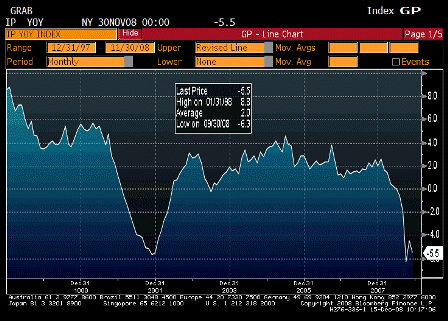
Industrial Production YoY (Nov)
| Survey | n/a |
| Actual | -5.5% |
| Prior | -4.5% |
| Revised | n/a |
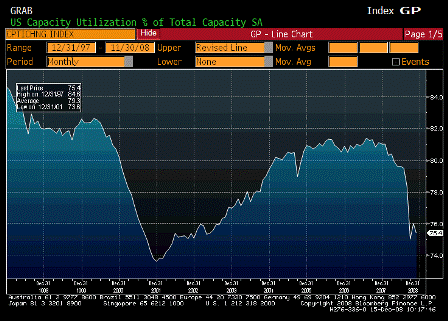
Capacity Utilization (Nov)
| Survey | 75.6% |
| Actual | 75.4% |
| Prior | 76.4% |
| Revised | 76.0% |
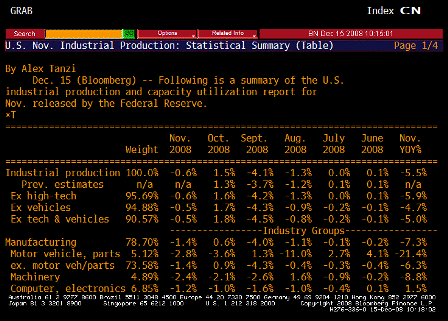
Capacity Utilization TABLE 1 (Nov)
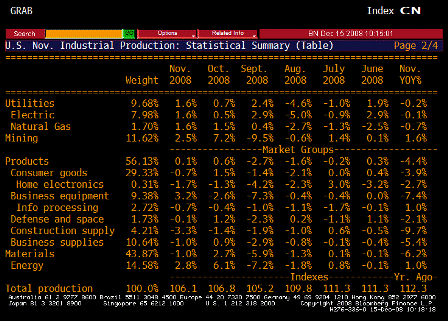
Capacity Utilization TABLE 2 (Nov)
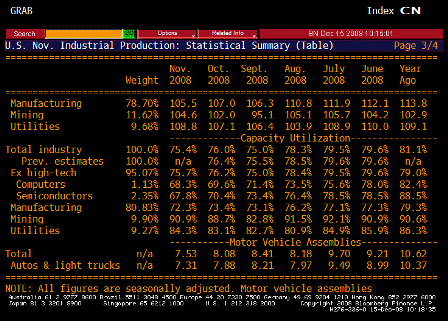
Capacity Utilization TABLE 3 (Nov)
[top]


