- Empire State Manufacturing Survey (Released 8:30 EST)
- Empire State Manufacturing Survey ALLX 1 (Released 8:30 EST)
- Empire State Manufacturing Survey ALLX 2 (Released 8:30 EST)
- Industrial Production MoM (Released 9:15 EST)
- Industrial Production YoY (Released 9:15 EST)
- Capacity Utilization (Released 9:15 EST)
- Capacity Utilization TABLE 1 (Released 9:15 EST)
- Capacity Utilization TABLE 2 (Released 9:15 EST)
- Capacity Utilization TABLE 3 (Released 9:15 EST)
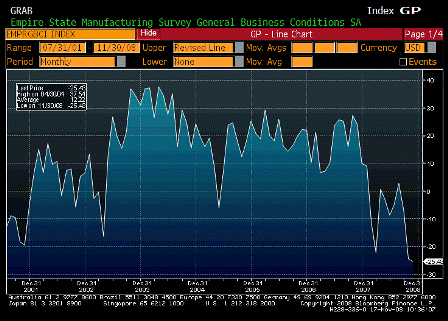
Empire State Manufacturing Survey (Nov)
| Survey | -26.00 |
| Actual | -25.43 |
| Prior | -24.62 |
| Revised | n/a |
Remains depressed.
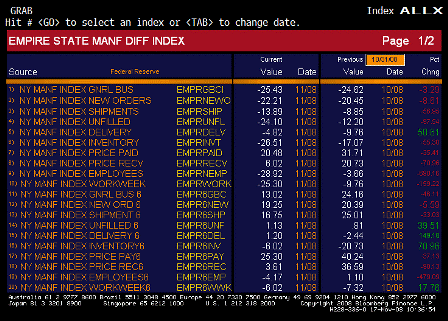
Empire State Manufacturing Survey ALLX 1 (Nov)
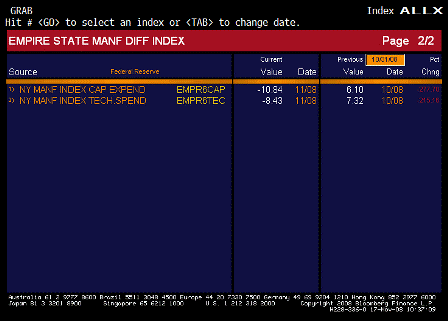
Empire State Manufacturing Survey ALLX 2 (Nov)
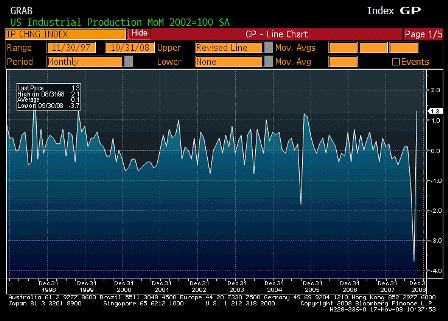
Industrial Production MoM (Oct)
| Survey | 0.2% |
| Actual | 1.3% |
| Prior | -2.8% |
| Revised | -3.7% |
Routine bounce back of a volatile series.
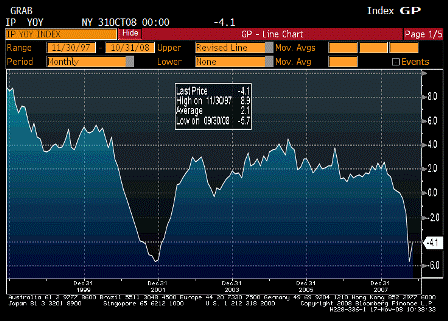
Industrial Production YoY (Oct)
| Survey | n/a |
| Actual | -4.1% |
| Prior | -5.7% |
| Revised | n/a |
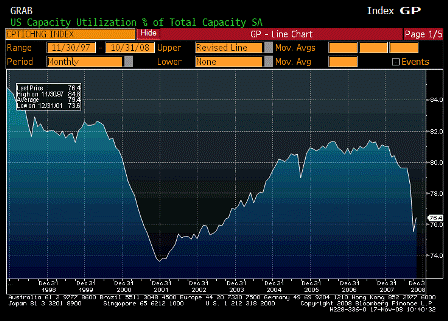
Capacity Utilization (Oct)
| Survey | 76.5% |
| Actual | 76.4% |
| Prior | 76.4% |
| Revised | 75.5% |
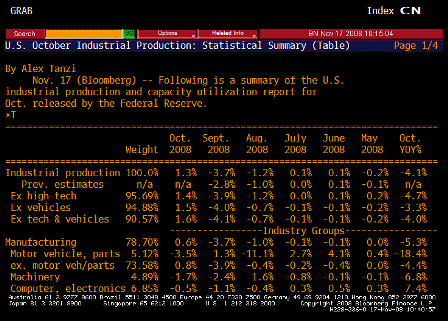
Capacity Utilization TABLE 1 (Oct)
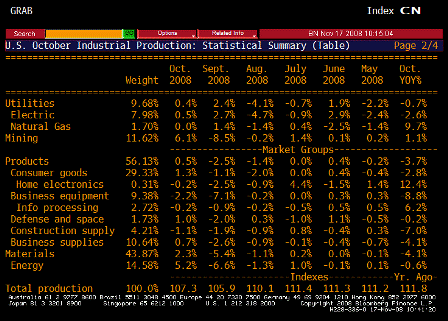
Capacity Utilization TABLE 2 (Oct)
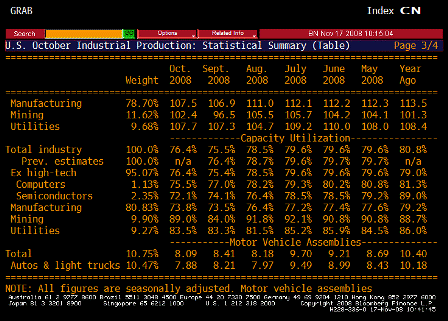
Capacity Utilization TABLE 3 (Oct)
[top]


