- MBA Mortgage Applications (Released 7:00 EST)
- MBA Purchasing Applications (Released 7:00 EST)
- MBA Refinancing Applications (Released 7:00 EST)
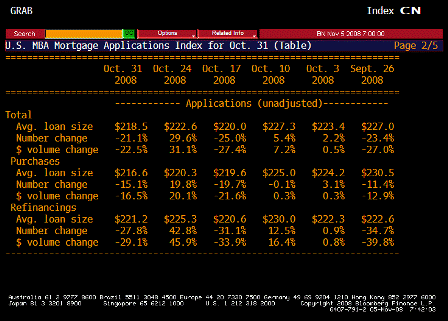
- MBA TABLE 1 (Released 7:00 EST)
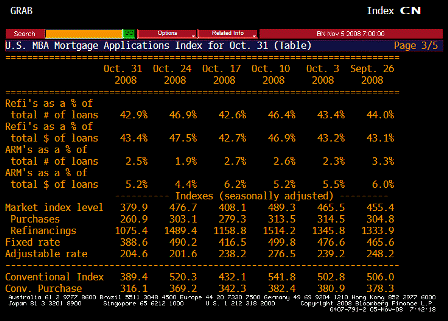
- MBA TABLE 2 (Released 7:00 EST)
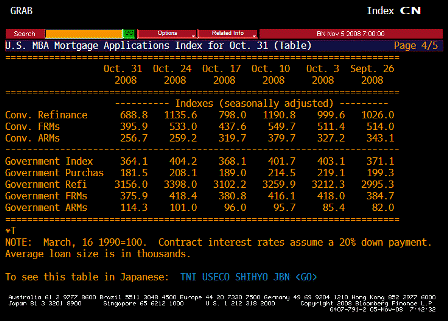
- MBA TABLE 3 (Released 7:00 EST)
- MBA TABLE 4 (Released 7:00 EST)
- Challenger Job Cuts YoY (Released 7:30 EST)
- Challenger Job Cuts TABLE 1 (Released 7:30 EST)
- Challenger Job Cuts TABLE 2 (Released 7:45 EST)
- Challenger Job Cuts TABLE 3 (Released 7:45 EST)
- Challenger Job Cuts TABLE 4 (Released 7:45 EST)
- ISM Non Manufacturing Composite (Released 10:00 EST)
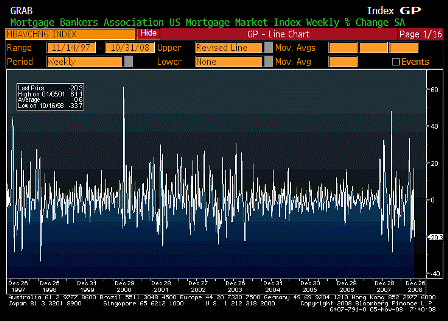
MBA Mortgage Applications (Oct 31)
| Survey | n/a |
| Actual | -20.3% |
| Prior | 16.8% |
| Revised | n/a |
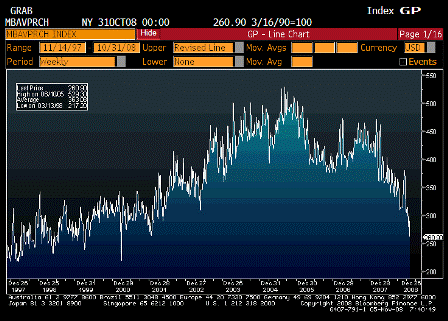
MBA Purchasing Applications (Oct 31)
| Survey | n/a |
| Actual | 260.90 |
| Prior | 303.10 |
| Revised | n/a |
Down through the lows- looking like housing is taking a second leg down.
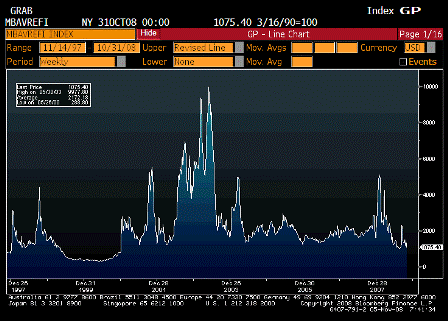
MBA Refinancing Applications (Oct 31)
| Survey | n/a |
| Actual | 1075.40 |
| Prior | 1489.40 |
| Revised | n/a |
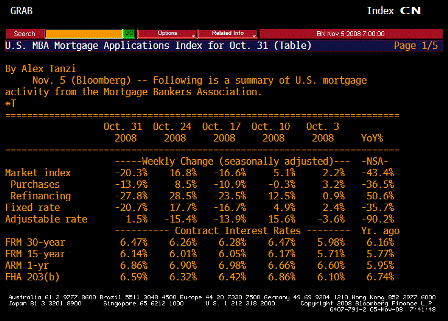
MBA TABLE 1 (Oct 31)
MBA TABLE 2 (Oct 31)
MBA TABLE 3 (Oct 31)
MBA TABLE 4 (Oct 31)
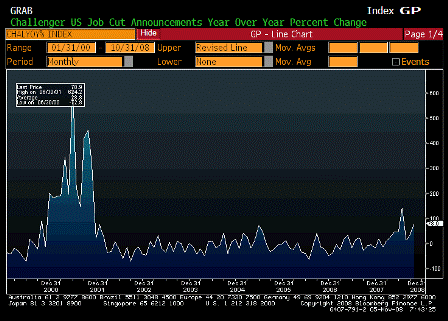
Challenger Job Cuts YoY (Oct)
| Survey | n/a |
| Actual | 78.9% |
| Prior | 32.6% |
| Revised | n/a |
Trending higher along with other employment indicators.
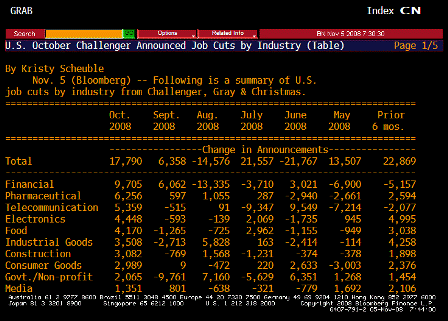
Challenger Job Cuts TABLE 1 (Oct)
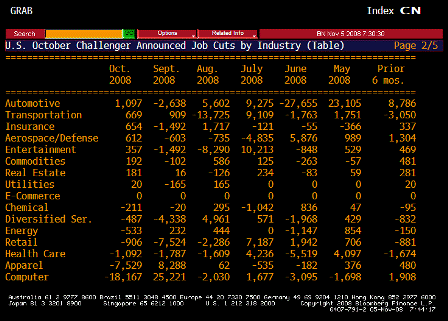
Challenger Job Cuts TABLE 2 (Oct)
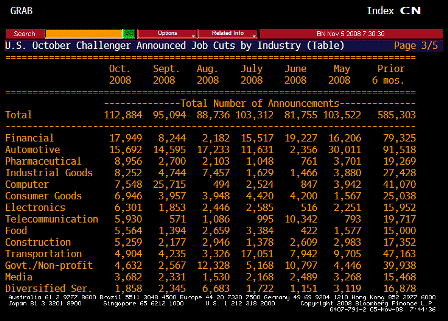
Challenger Job Cuts TABLE 3 (Oct)
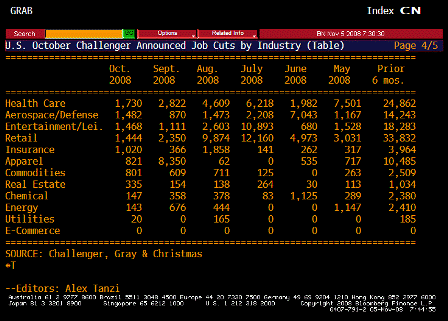
Challenger Job Cuts TABLE 4 (Oct)
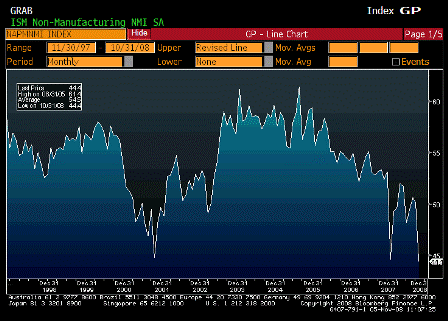
ISM Non Manufacturing Composite (Oct)
| Survey | 47.0 |
| Actual | 44.4 |
| Prior | 50.2 |
| Revised | n/a |
[top]


