- ICSC-UBS Store Sales YoY (Released 7:45 EST)
- ICSC-UBS Store Sales WoW (Released 7:45 EST)
- Redbook Store Sales Weekly YoY (Released 8:55 EST)
- Redbook Store Sales MoM (Released 8:55 EST)
- ICSC-UBS Redbook Comparison TABLE (Released 8:55 EST)
- Richmond Fed Manufacturing Index (Released 10:00 EST)
- Richmond Fed Manufacturing Index ALLX (Released 10:00 EST)
- House Price Index MoM (Released 10:00 EST)
- House Price Index YoY (Released 10:00 EST)
- House Price Index TABLE (Released 10:00 EST)
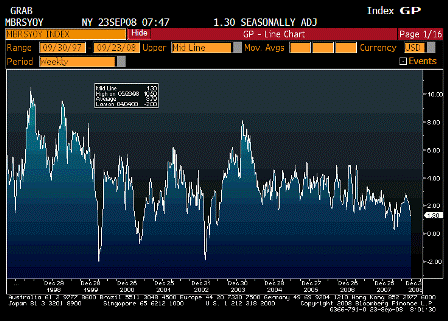
ICSC-UBS Store Sales YoY (Sep. 23)
| Survey | n/a |
| Actual | 1.3% |
| Prior | 1.3% |
| Revised | n/a |
Holding steady off the lows.
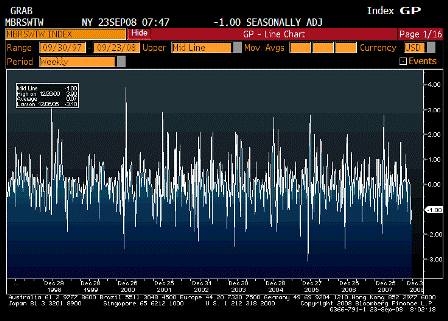
ICSC-UBS Store Sales WoW (Sep 23)
| Survey | n/a |
| Actual | -1.00% |
| Prior | -1.60% |
| Revised | n/a |
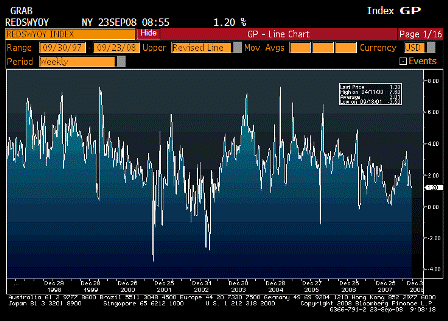
Redbook Store Sales Weekly YoY (Sep 23)
| Survey | n/a |
| Actual | 1.2% |
| Prior | 1.4% |
| Revised | n/a |
Steady and off the lows as well.
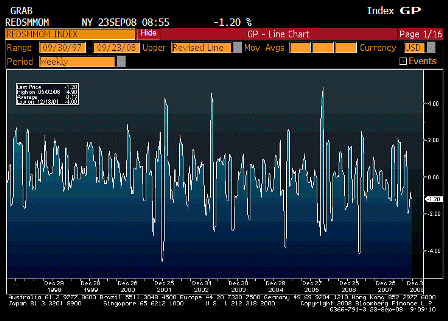
Redbook Store Sales MoM (Sep 23)
| Survey | n/a |
| Actual | -1.20% |
| Prior | -1.10% |
| Revised | n/a |
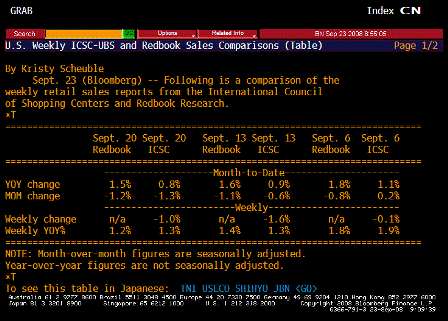
ICSC-UBS Redbook Comparison TABLE (Sep 23)
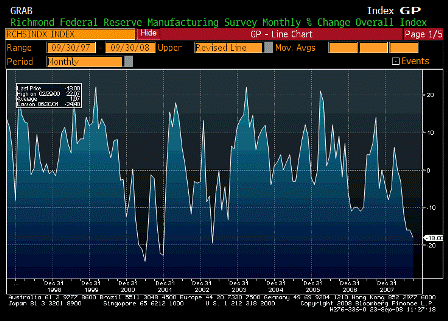
Richmond Fed Manufacturing Index (Sep)
| Survey | -12 |
| Actual | -18 |
| Prior | -16 |
| Revised | n/a |
Worse than expected and looking very weak.
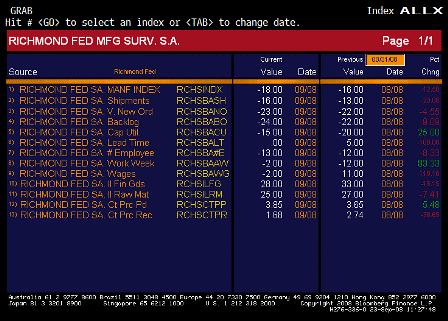
Richmond Fed Manufacturing Index ALLX (Sep)
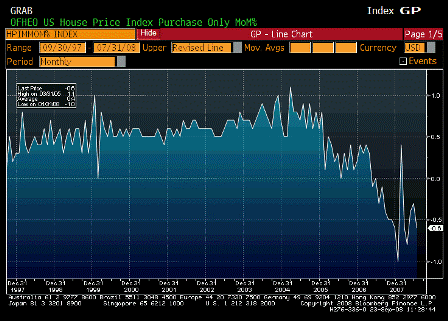
House Price Index MoM (Jul)
| Survey | -0.2% |
| Actual | -0.6% |
| Prior | 0.0% |
| Revised | -0.3% |
Weaker than expected but still off the lows and seems to be working it’s way irregularly higher.
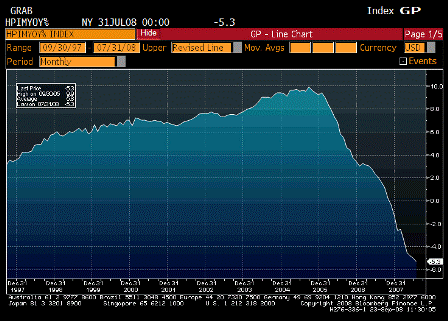
House Price Index YoY (Jul)
| Survey | n/a |
| Actual | -5.3% |
| Prior | -5.0% |
| Revised | n/a |
Losing 5.3% year over year is a lot for this index.
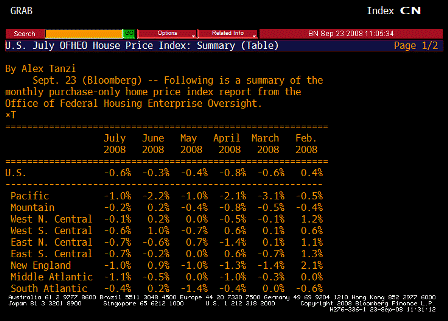
House Price Index TABLE (Jul)
[top]


