- ICSC-UBS Store Sales WoW (Released 7:45 EST)
- ICSC-UBS Store Sales YoY (Released 7:45 EST)
- Redbook Store Sales Weekly YoY (Released 8:55 EST)
- ICSC-UBS Redbook Comparison TABLE (Released 8:55 EST)
- Producer Price Index MoM (Released 8:30 EST)
- PPI Ex Food & Energy MoM (Released 8:30 EST)
- Producer Price Index YoY (Released 8:30 EST)
- PPI Ex Food & Energy YoY (Released 8:30 EST)
- PPI TABLE 1 (Released 8:30 EST)
- PPI TABLE 2 (Released 8:30 EST)
- PPI TABLE 3 (Released 8:30 EST)
- Housing Starts (Released 8:30 EST)
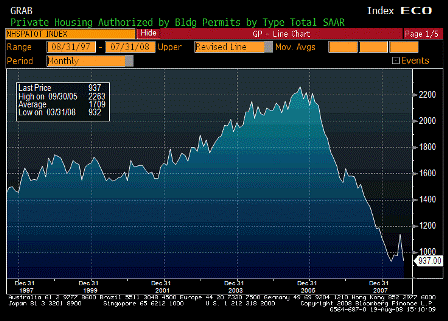
- Building Permits (Released 8:30 EST)
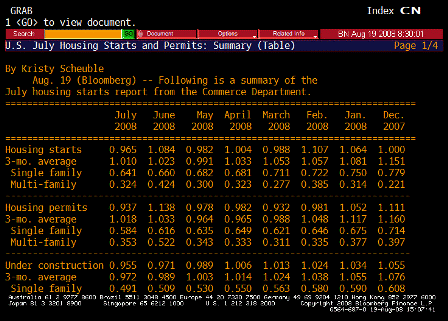
- Housing Starts TABLE 1 (Released 8:30 EST)
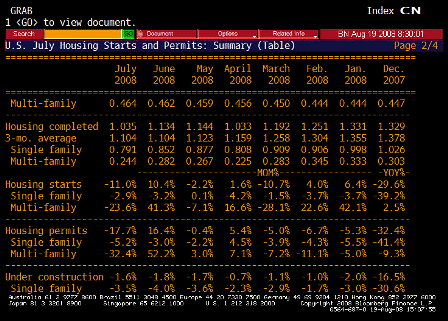
- Housing Starts TABLE 2 (Released 8:30 EST)
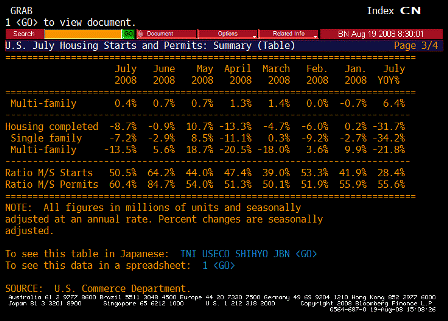
- Housing Starts TABLE 3 (Released 8:30 EST)
- ABC Consumer Confidence (Released 17:00 EST)
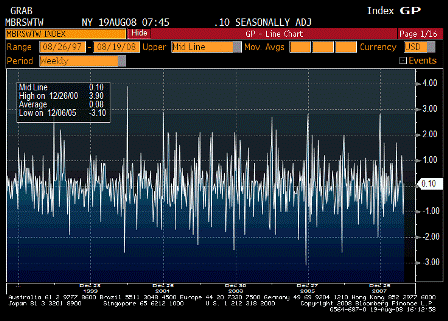
ICSC-UBS Store Sales WoW (Aug 19)
| Survey | n/a |
| Actual | 0.1% |
| Prior | 1.1% |
| Revised | n/a |
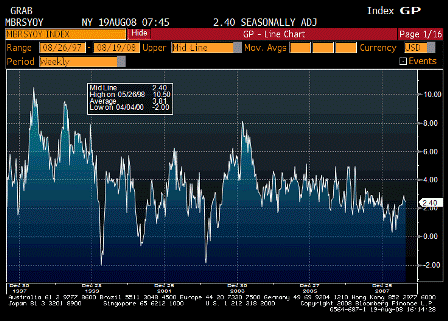
ICSC-UBS Store Sales YoY (Aug 19)
| Survey | n/a |
| Actual | 2.4% |
| Prior | 2.6% |
| Revised | n/a |
Doing just fine, especially considering the financial sector is gone.
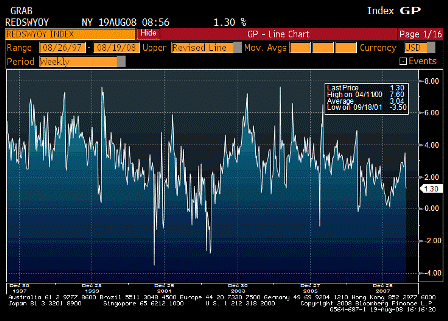
Redbook Store Sales Weekly YoY (Aug 19)
| Survey | n/a |
| Actual | 1.3% |
| Prior | 1.5% |
| Revised | n/a |
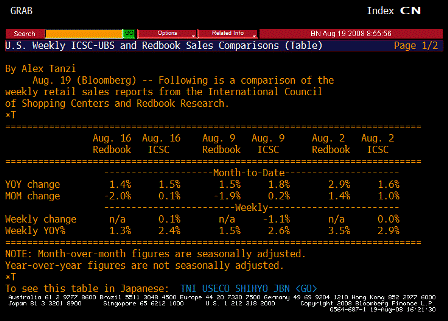
ICSC-UBS Redbook Comparison TABLE (Aug 19)
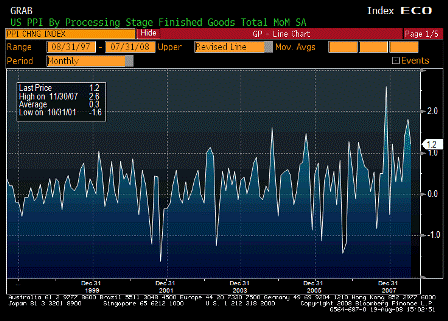
Producer Price Index MoM (Jul)
| Survey | 0.6% |
| Actual | 1.2% |
| Prior | 1.8% |
| Revised | n/a |
Up more than expected.
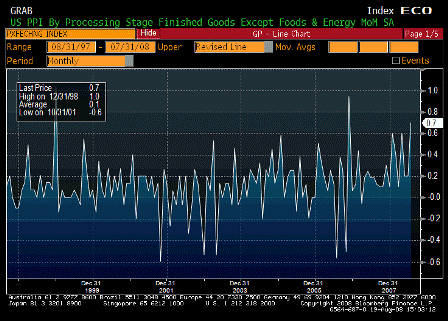
PPI Ex Food & Energy MoM (Jul)
| Survey | 0.2% |
| Actual | 0.7% |
| Prior | 0.2% |
| Revised | n/a |
Core nudging up a touch…
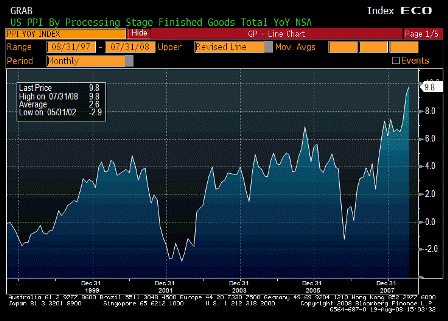
Producer Price Index YoY (Jul)
| Survey | 9.3% |
| Actual | 9.8% |
| Prior | 9.2% |
| Revised | n/a |
Just a little blip up that’s starting to make the 1970s look tame.
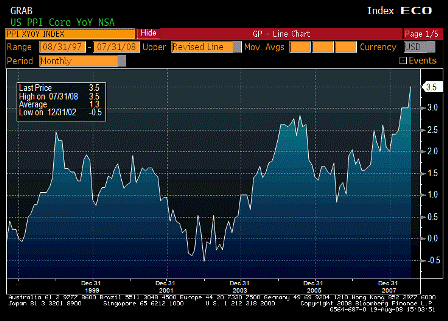
PPI Ex Food & Energy YoY (Jul)
| Survey | 3.2% |
| Actual | 3.5% |
| Prior | 3.0% |
| Revised | n/a |
Cute little break out here too.
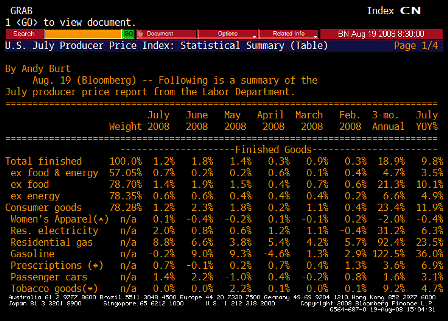
PPI TABLE 1 (Jul)
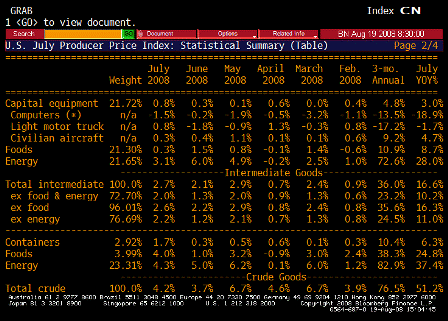
PPI TABLE 2 (Jul)
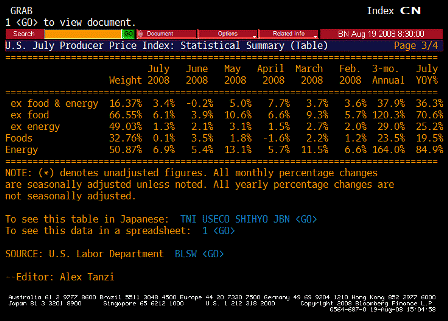
PPI TABLE 3 (Jul)
Karim writes:
- PPI for July up 1.2% and 0.7% ex-food and energy
- Core driven by cars and trucks the past 2mths (seems out of line w/cpi data) and medical
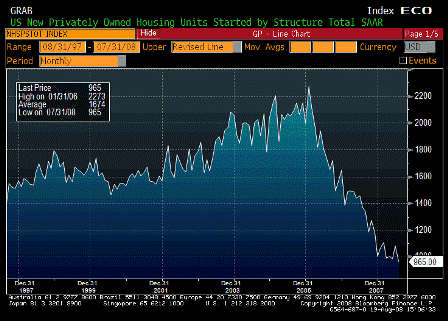
Housing Starts (Jul)
| Survey | 960K |
| Actual | 965K |
| Prior | 1066K |
| Revised | 1084K |
A bit higher than expected, and last month revised up.
Averaging out the last couple of months or so to smooth the NY situation indicates a leveling off and probably a bottom.
Building Permits (Jul)
| Survey | 970K |
| Actual | 937K |
| Prior | 1091K |
| Revised | 1138K |
Down, but last month revised up. Same as above.
Housing Starts TABLE 1 (Jul)
Housing Starts TABLE 2 (Jul)
Housing Starts TABLE 3 (Jul)
Karim writes:
- Starts fall 11% after upward revision to June (now up 10.4%)
- Noise in data still surrounds multi-family due to change in NYC building code (multi-family dropped 23.6% after rising 41.3% in June)
- Single family drops another 2.9% after 3.2% drop in June and now down 39.2% y/y
- Same story with permits, down 17.7% m/m after 16.4% rise in June
- Single family permits down 5.2% m/m after -3% in June and down 41.4% y/y
- Multi-family down 32.4% m/m after up 52.2% m/m in June
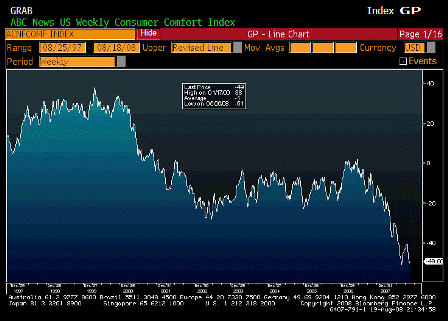
ABC Consumer Confidence (Aug 17)
| Survey | -50 |
| Actual | -49 |
| Prior | -50 |
| Revised | n/a |
very low, may be bottoming, confidence being hurt by inflation.
[top]


