- Consumer Price Index MoM (Released 8:30 EST)
- CPI Ex Food & Energy MoM (Released 8:30 EST)
- Consumer Price Index YoY (Released 8:30 EST)
- CPI Ex Food & Energy YoY (Released 8:30 EST)
- CPI Core Index SA (Released 8:30 EST)
- Consumer Price Index NSA (Released 8:30 EST)
- CPI TABLE 1 (Released 8:30 EST)
- CPI TABLE 2 (Released 8:30 EST)
- CPI TABLE 3 (Released 8:30 EST)
- Initial Jobless Claims (Released 8:30 EST)
- Continuing Jobless Claims (Released 8:30 EST)
- Jobless Claims TABLE 1 (Released 8:30 EST)
- Jobless Claims TABLE 2 (Released 8:30 EST)
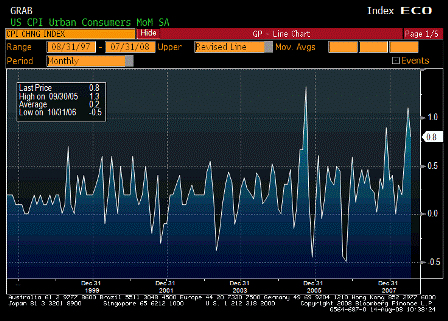
Consumer Price Index MoM (Jul)
| Survey | 0.4% |
| Actual | 0.8% |
| Prior | 1.1% |
| Revised | n/a |
Out of control, but if the recent commodity sell off holds headline will moderate some for awhile. Lots of pass-throughs and cost push forces in place.
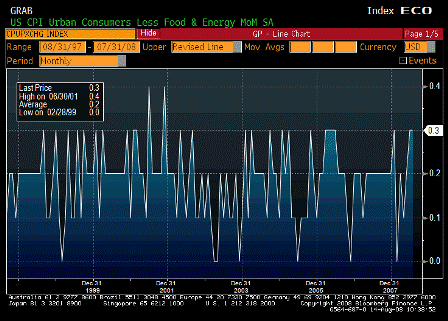
CPI Ex Food & Energy MoM (Jul)
| Survey | 0.2% |
| Actual | 0.3% |
| Prior | 0.3% |
| Revised | n/a |
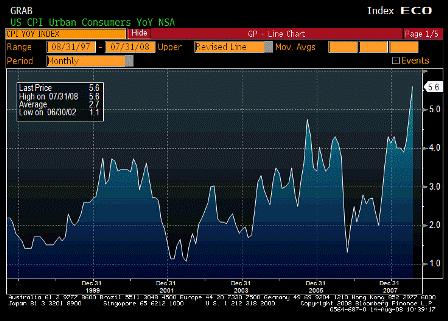
Consumer Price Index YoY (Jul)
| Survey | 5.1% |
| Actual | 5.6% |
| Prior | 5.0% |
| Revised | n/a |
The Fed has to be concerned that the 2% FF rate is way too accommodative, especially with Q2 GDP no forecast at over 3% and Q3 looking like 2%.
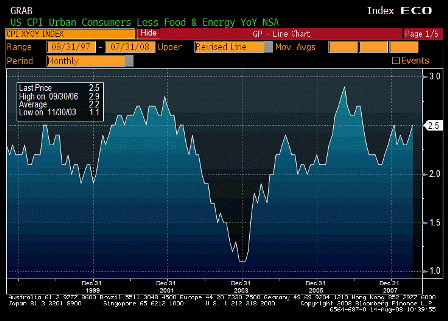
CPI Ex Food & Energy YoY (Jul)
| Survey | 2.4% |
| Actual | 2.5% |
| Prior | 2.4% |
| Revised | n/a |
Could be headed much higher as cost push pass-throughs starting to register.
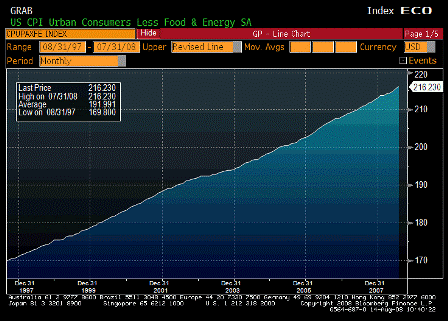
CPI Core Index SA (Jul)
| Survey | n/a |
| Actual | 216.230 |
| Prior | 215.526 |
| Revised | n/a |
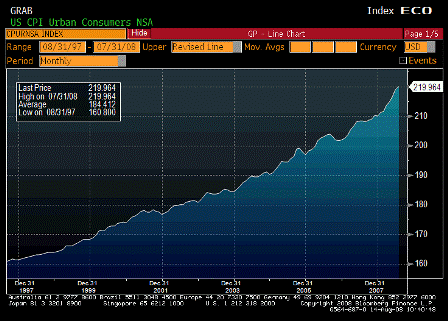
Consumer Price Index NSA (Jul)
| Survey | 219.075 |
| Actual | 219.964 |
| Prior | 218.815 |
| Revised | n/a |
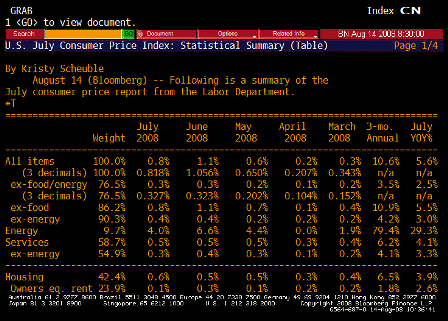
CPI TABLE 1 (Jul)
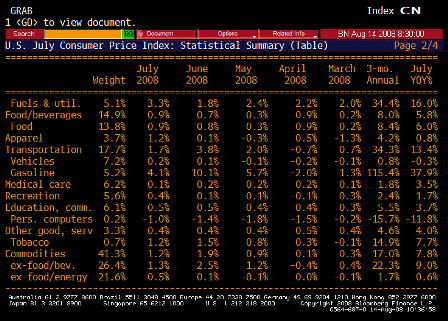
CPI TABLE 2 (Jul)
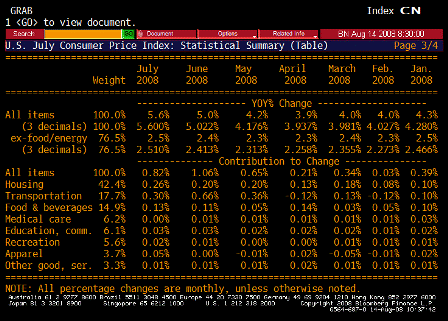
CPI TABLE 3 (Jul)
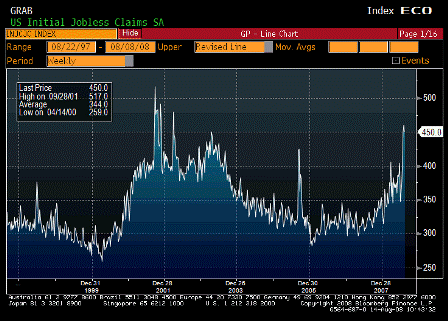
Initial Jobless Claims (Aug 9)
| Survey | 435K |
| Actual | 450K |
| Prior | 455K |
| Revised | 460K |
Up, but confused by new extended benefits.
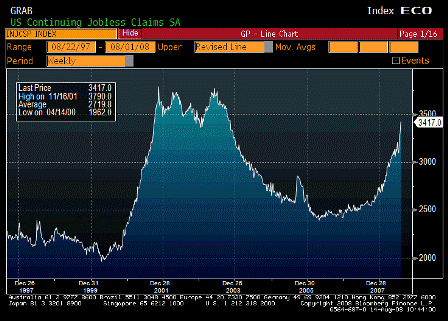
Continuing Jobless Claims (Aug 2)
| Survey | 3310K |
| Actual | 3417K |
| Prior | 3311K |
| Revised | 3303K |
Not looking good either, but how bad can it actually be with GDP north of 3%?
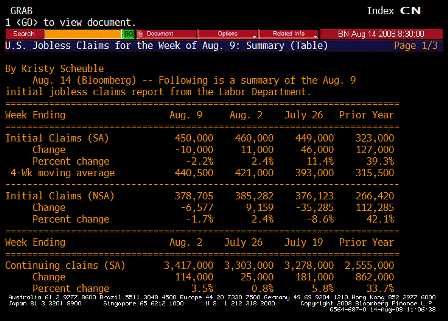
Jobless Claims TABLE 1 (Aug 9)
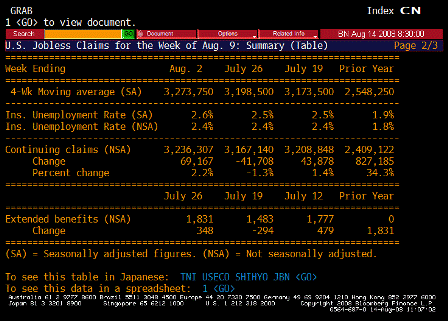
Jobless Claims TABLE 2 (Aug 9)
[top]


