- Nonfarm Productivity QoQ (Released 8:30 EST)
- Nonfarm Productivity TABLE 1 (Released 8:30 EST)
- Nonfarm Productivity TABLE 2 (Released 8:30 EST)
- Unit Labor Costs QoQ (Released 8:30 EST)
- Unit Labor Costs ALLX (Released 8:30 EST)
- Wholesale Inventories MoM (Released 10:00 EST)
- Wholesale Inventories YoY (Released 10:00 EST)
- Wholesale Inventories ALLX 1 (Released 10:00 EST)
- Wholesale Inventories ALLX 2 (Released 10:00 EST)
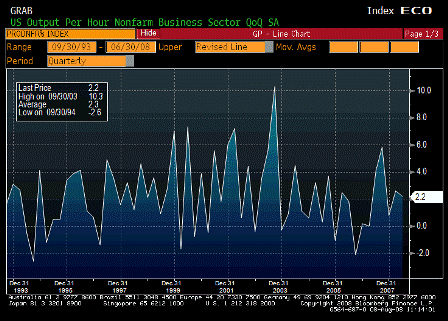
Nonfarm Productivity QoQ (2Q P)
| Survey | 2.5% |
| Actual | 2.2% |
| Prior | 2.6% |
| Revised | n/a |
GDP gains are coming from productivity as hours worked decline.
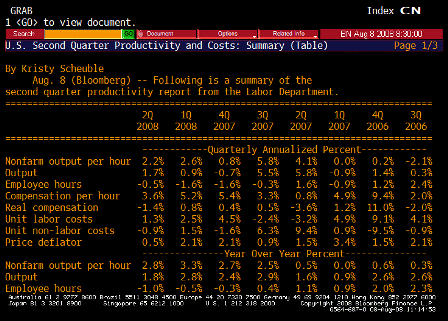
Nonfarm Productivity TABLE 1 (2Q P)
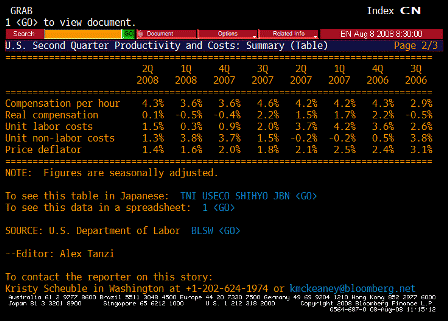
Nonfarm Productivity TABLE 2 (2Q P)
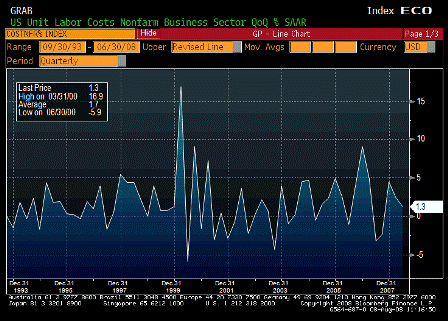
Unit Labor Costs QoQ (2Q P)
| Survey | 1.4% |
| Actual | 1.3% |
| Prior | 2.2% |
| Revised | 2.5% |
Better than expected due to productivity increases.
If the USD stays strong, it could help import prices moderate as well.
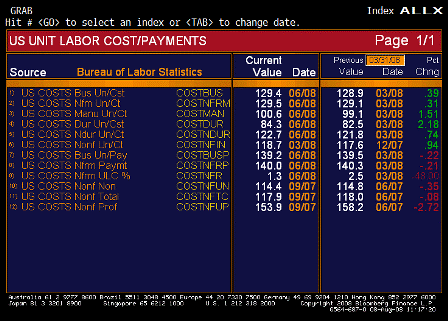
Unit Labor Costs ALLX (2Q P)
Karim writes:
Productivity based on hours, not employment; so we should see productivity in q2 of about 3.5% vs gdp of 1.9%.
Right, makes sense. More output from fewer workers and fewer hours is keeping GDP positive (and that much demand, which includes demand for exports, is supporting prices) even as labor markets soften.
Same as in prior 2 qtrs as hours were cut more aggressively than employment>Q4 gdp was -0.2% and productivity was +0.9%: Q1 GDP of 0.9% and productivity of 2.4%
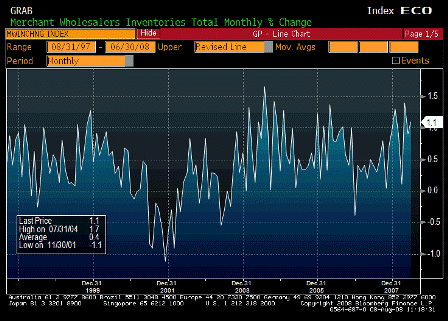
Wholesale Inventories MoM (Jun)
| Survey | 0.6% |
| Actual | 1.1% |
| Prior | 0.8% |
| Revised | 0.9% |
Higher than expected. Might mean upward Q2 GDP revision.
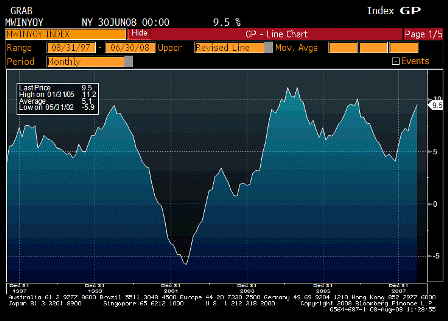
Wholesale Inventories YoY (Jun)
| Survey | n/a |
| Actual | 9.5% |
| Prior | 8.8% |
| Revised | n/a |
With all the talk of weakness, increased inventories are most likely due to increased order flow.
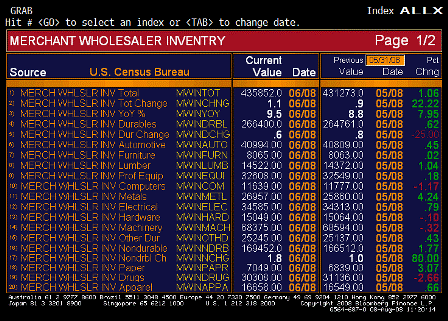
Wholesale Inventories ALLX 1 (Jun)
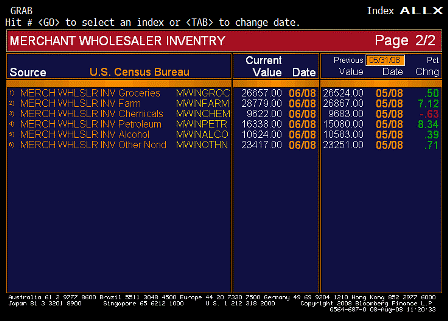
Wholesale Inventories ALLX 2 (Jun)
[top]


