- Initial Jobless Claims (Released 8:30 EST)
- Initial Jobless Claims – 4 Week Moving Average (Released 8:30 EST)
- Continuing Jobless Claims (Released 8:30 EST)
- Existing Home Sales (Released 10:00 EST)
- Existing Home Sales MoM (Released 10:00 EST)
- Existing Home Sales YoY (Released 10:00 EST)
- Existing Home Sales – Median Price (Released 10:00 EST)
- Existing Home Sales – Inventory (Released 10:00 EST)
- Existing Home Sales ALLX (Released 10:00 EST)
- Existing Home Sales ALLX cont (Released 10:00 EST)
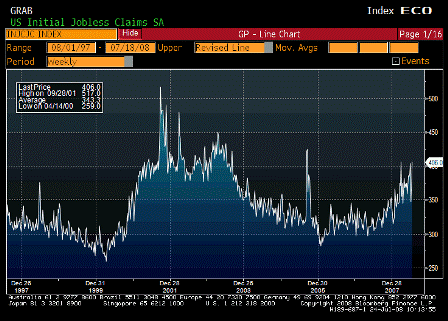
Initial Jobless Claims (Jul 19)
| Survey | 380K |
| Actual | 406K |
| Prior | 366K |
| Revised | 372K |
4 week moving average up a few thousand and drifting higher.
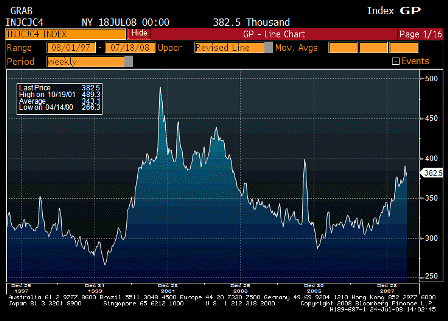
Initial Jobless Claims – 4 Week Moving Average (Jul 18)
| Survey | n/a |
| Actual | 382.5 |
| Prior | 378.0 |
| Revised | n/a |
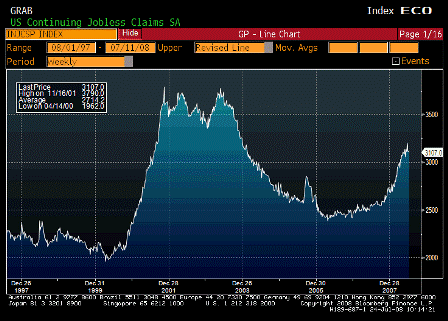
Continuing Jobless Claims (Jul 12)
| Survey | 3160K |
| Actual | 3107K |
| Prior | 3122K |
| Revised | 3116K |
But these are now coming down some.
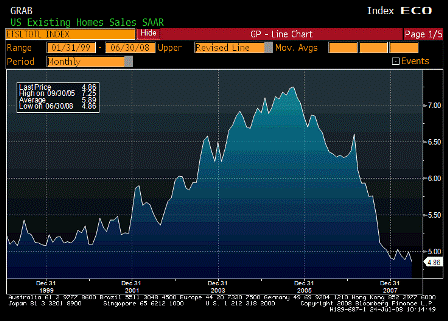
Existing Home Sales (Jun)
| Survey | 4.94M |
| Actual | 4.86M |
| Prior | 4.99M |
| Revised | n/a |
Less than expected, and bumping along the bottom as foreclosures dominate.
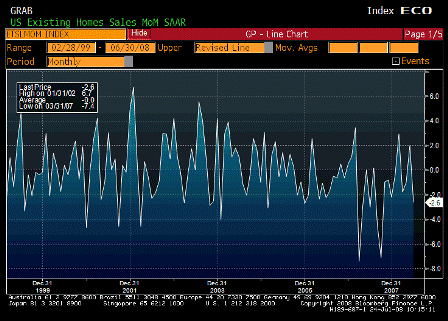
Existing Home Sales MoM (Jun)
| Survey | -1.0% |
| Actual | -2.6% |
| Prior | 2.0% |
| Revised | n/a |
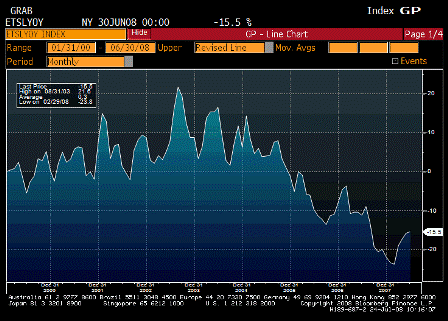
Existing Home Sales YoY (Jun)
| Survey | n/a |
| Actual | -15.9% |
| Prior | -17.5% |
| Revised | n/a |
Still falling but not quite as fast.
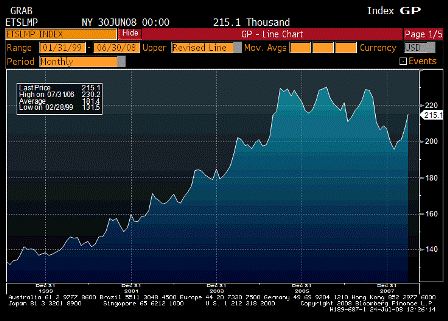
Existing Home Sales – Median Price (Jun)
| Survey | n/a |
| Actual | 215.1 |
| Prior | 207.9 |
| Revised | n/a |
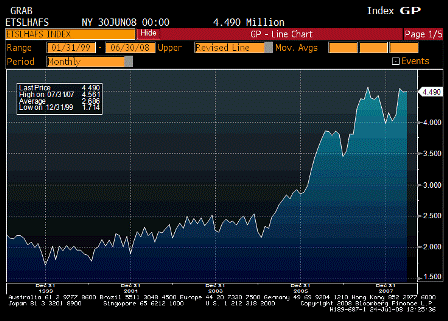
Existing Home Sales – Inventory (Jun)
| Survey | n/a |
| Actual | 4.490 |
| Prior | 4.482 |
| Revised | n/a |
Foreclosers addind to inventories.
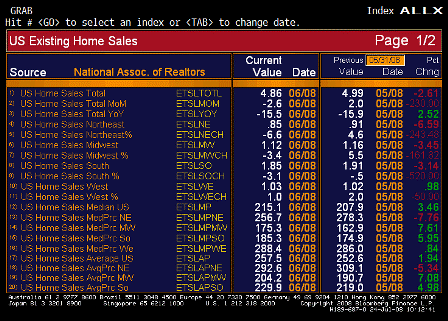
Existing Home Sales ALLX (Jun)
Median prices up in all regions.
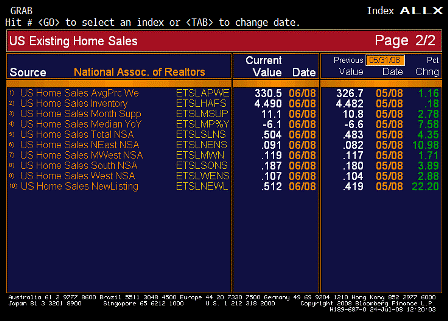
Existing Home Sales ALLX cont (Jun)
[top]


