- MBA Mortgage Applications (Released 7:00 EST)
- MBA Purchasing Index (Released 7:00 EST)
- MBA Refinancing Index (Released 7:00 EST)
- Bloomberg Global Confidence (Released 7:00 EST)
- Consumer Price Index MoM (Released 8:30 EST)
- CPI Ex Food & Energy MoM (Released 8:30 EST)
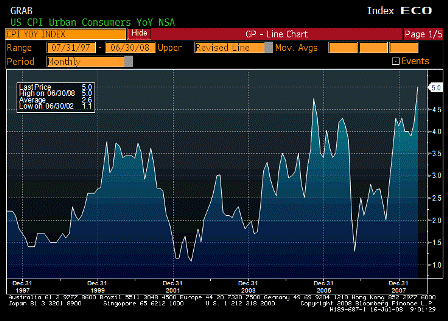
- Consumer Price Index YoY (Released 8:30 EST)
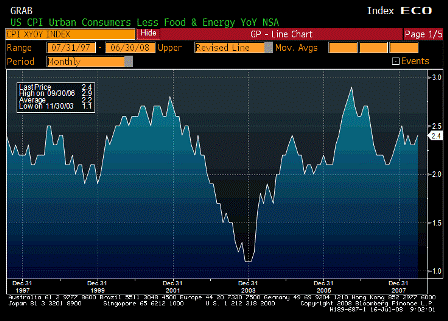
- CPI Ex Food & Energy YoY (Released 8:30 EST)
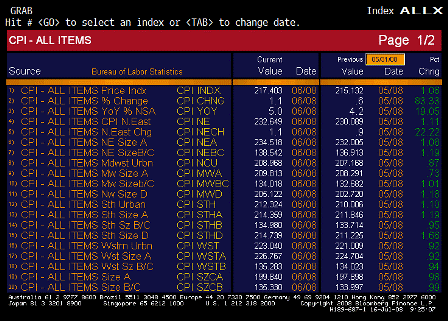
- CPI ALLX (Released 8:30 EST)
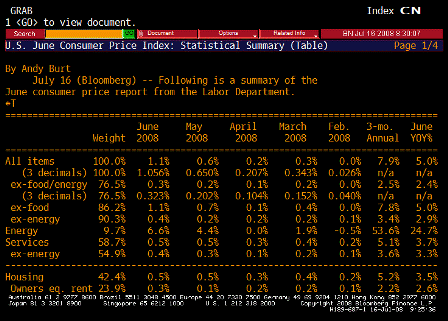
- CPI TABLE (Released 8:30 EST)
- CPI Core Index SA (Released 8:30 EST)
- Consumer Price Index NSA (Released 8:30 EST)
- Net Long-term TIC Flows (Released 9:00 EST)
- Total Net TIC Flows (Released 9:00 EST)
- Industrial Production MoM (Released 9:15 EST)
- Industrial Production YoY (Released 9:15 EST)
- Capacity Utilization (Released 9:15 EST)
- NAHB Housing Market Index (Released 13:00 EST)
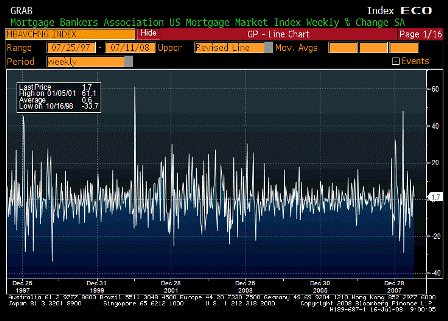
MBA Mortgage Applications (Jul 11)
| Survey | n/a |
| Actual | 1.7% |
| Prior | 7.5% |
| Revised | n/a |

MBA Purchasing Index (Jul 11)
| Survey | n/a |
| Actual | 359.7 |
| Prior | 365.8 |
| Revised | n/a |
Minor down tic, still in a range that used to be indicative of 1.5 million housing starts per year, vs today’s approx 1 million.

MBA Refinancing Index (Jul 11)
| Survey | n/a |
| Actual | 1474.9 |
| Prior | 1379.3 |
| Revised | n/a |
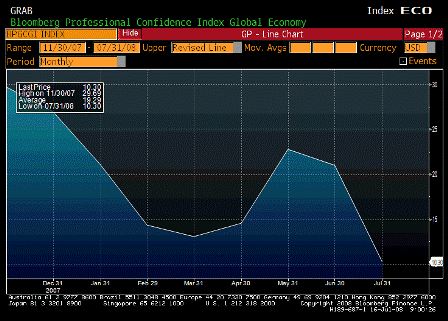
Bloomberg Global Confidence (Jul)
| Survey | n/a |
| Actual | 10.30 |
| Prior | 21.01 |
| Revised | n/a |
Inflation and falling equity markets are getting everyone down.
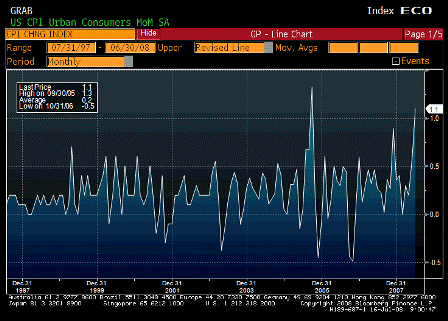
Consumer Price Index MoM (Jun)
| Survey | 0.7% |
| Actual | 1.1% |
| Prior | 0.6% |
| Revised | n/a |
Higher than expected.
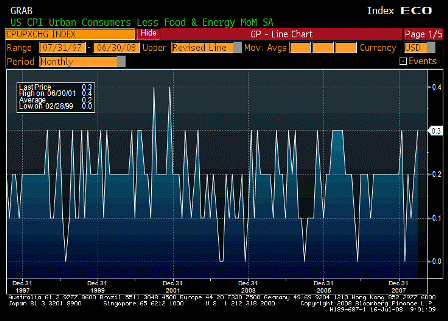
CPI Ex Food & Energy MoM (Jun)
| Survey | 0.2% |
| Actual | 0.3% |
| Prior | 0.2% |
| Revised | n/a |
Headline leaking into core.
Consumer Price Index YoY (Jun)
| Survey | 4.5% |
| Actual | 5.0% |
| Prior | 4.2% |
| Revised | n/a |
Breakout!
CPI Ex Food & Energy YoY (Jun)
| Survey | 2.3% |
| Actual | 2.4% |
| Prior | 2.3% |
| Revised | n/a |
If it was a relative value story, this would be a lot lower and going down.
CPI ALLX (Jun)
CPI TABLE (Jun)
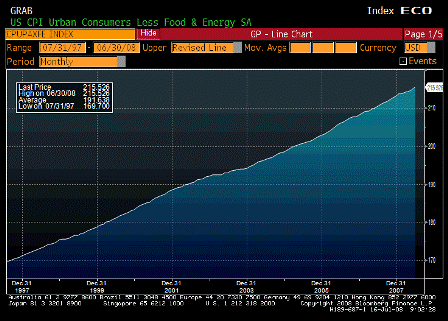
CPI Core Index SA (Jun)
| Survey | n/a |
| Actual | 215.526 |
| Prior | 214.832 |
| Revised | n/a |
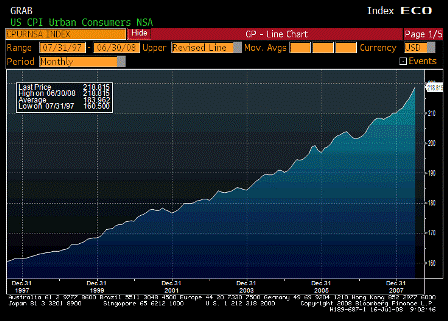
Consumer Price Index NSA (Jun)
| Survey | 217.903 |
| Actual | 218.815 |
| Prior | 216.632 |
| Revised | n/a |
Karim writes:
- Headline up 1.1% and 5.0% y/y
Above Fed’s comfort zones.
- Core up 0.323% m/m and 2.4% y/y
In the 70’s I recall core passing 3% about the time headline passed 6%.
Click to see CPI Charts and CPI Table from the 1970s.
The difference there is no supply response for crude oil in sight this time.
- Largest contributor to core was housing, where first 0.3% rise in oer this year was posted, and also a 1.8% rise in the fuel and utility component of housing.
Weak demand isn’t yet bringing CPI down as the Fed has been forecasting.
- Lodging away from home (0.7%) had its second straight strong gain; this is usually +/- more than 1% each month, so likely to give back next month.
Weak occupancy hasn’t brought this measure down.
- Tobacco up 1.5% due to tax hike in NY
- Other items likely to reverse next month based on usual patterns are apparel (0.1%) and vehicle prices (0.1%)
Maybe, but lower car sales may not bring prices down over time due to cost issues.
- Education (+0.5) also above trend
Costs rising here at well. And most employees probably get CPI increases.
- Bernanke probably knew this number yesterday when he said inflation would be ‘temporarily higher’ in short-term.
Yes, and he and Vice Chair Kohn will have their hands full with the hawks at the August
- Also, chain-weighted core CPI rose 0.1% and 2.1% y/y. This is a better proxy for core PCE (Fed’s preferred measure) as its not a fixed-weight time series and thus picks up substitution of one good versus another in consumer purchasing behavior.
Yes. Keeps this series lower than CPI until we’re down to eating bread and water, as deteriorating real terms of trade weigh on our standard of living.

Net Long-term TIC Flows (May)
| Survey | $70.0B |
| Actual | $67.0B |
| Prior | $115.1B |
| Revised | n/a |

Total Net TIC Flows (May)
| Survey | n/a |
| Actual | -$2.5B |
| Prior | $60.6B |
| Revised | $61.6B |
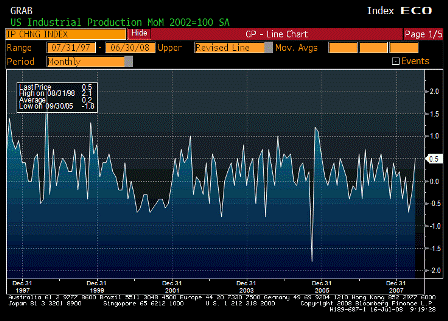
Industrial Production MoM (Jun)
| Survey | 0.1% |
| Actual | 0.5% |
| Prior | -0.2% |
| Revised | n/a |
Better then expected.
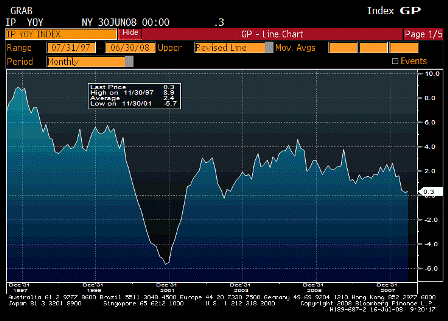
Industrial Production YoY (Jun)
| Survey | n/a |
| Actual | 0.3% |
| Prior | 0.1% |
| Revised | 0.2% |
Seems to be working its way lower over time. May be stabilizing with the weak USD.
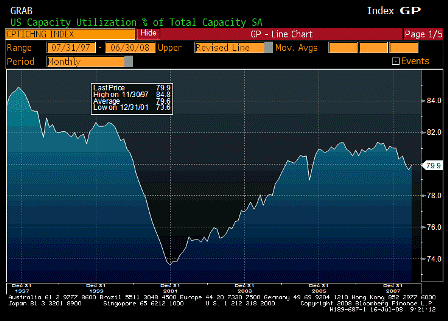
Capacity Utilization (Jun)
| Survey | 79.4% |
| Actual | 79.9% |
| Prior | 79.4% |
| Revised | 79.6% |
Higher than expected. The Fed is counting on slack to bring ‘inflation’ down.

NAHB Housing Market Index (Jul)
| Survey | 18 |
| Actual | – |
| Prior | 18 |
| Revised | – |
[top]


