- GDP QoQ Annualized (Released 8:30 EST)
- Personal Consumption (Released 8:30 EST)
- GDP Price Index (Released 8:30 EST)
- Core PCE QoQ (Released 8:30 EST)
- Initial Jobless Claims (Released 8:30 EST)
- Continiuing Jobless Claims (Released 8:30 EST)
- Help Wanted Index (Released 10:00 EST)
- Existing Home Sales (Released 10:00 EST)
- Existing Home Sales MoM (Released 10:00 EST)
- Existing Home Sales Median Price (Released 10:00 EST)
- Existing Home Sales Median Price YoY (Released 10:00 EST)
- Existing Home Sales Inventories (Released 10:00 EST)
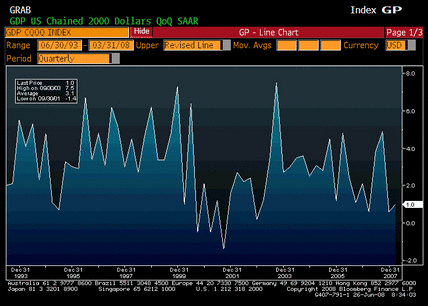
GDP QoQ Annualized (1Q F)
| Survey | 1.0% |
| Actual | 1.0% |
| Prior | 0.9% |
| Revised | n/a |
As expected. Weak but no recession.
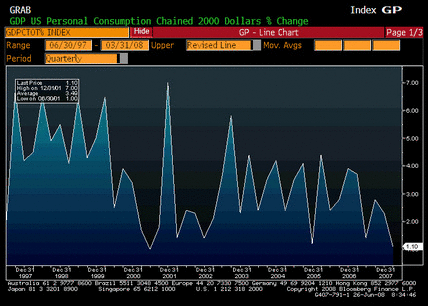
Personal Consumption (1Q F)
| Survey | 1.0% |
| Actual | 1.1% |
| Prior | 1.0% |
| Revised | n/a |
A touch better than expected with further improvement in Q2 still expected.
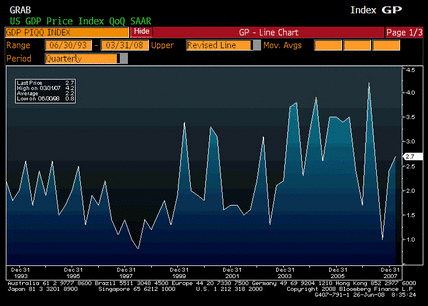
GDP Price Index (1Q F)
| Survey | 2.6% |
| Actual | 2.7% |
| Prior | 2.6% |
| Revised | n/a |
A bit worse than expected.
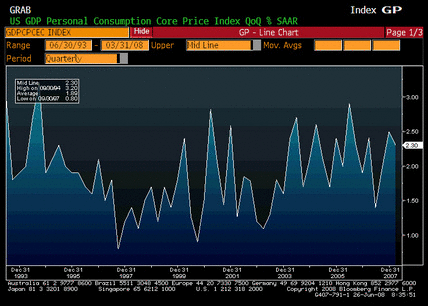
Core PCE QoQ (1Q F)
| Survey | 2.1% |
| Actual | 2.3% |
| Prior | 2.1% |
| Revised | n/a |
More than a bit worse than expected.
ÂÂÂ
GDP better than expected, and inflation worse than expected was reflected in the Fed statement, but not in Fed action.
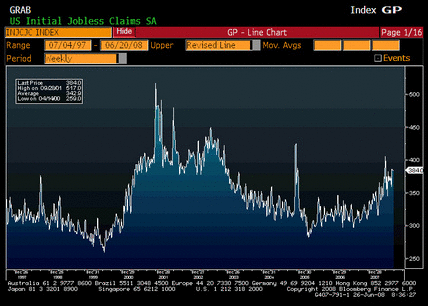
Initial Jobless Claims (Jun 21)
| Survey | 375K |
| Actual | 384K |
| Prior | 381K |
| Revised | 384K |
Unchanged from the previous week’s report that was revised up some. Still in the new range.
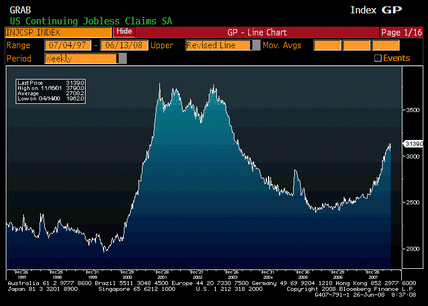
Continiuing Jobless Claims (Jun 14)
| Survey | 3105K |
| Actual | 3139K |
| Prior | 3060K |
| Revised | 3057K |
A little worse than expected, prior week revised down marginally.
Weak, but no recession yet.
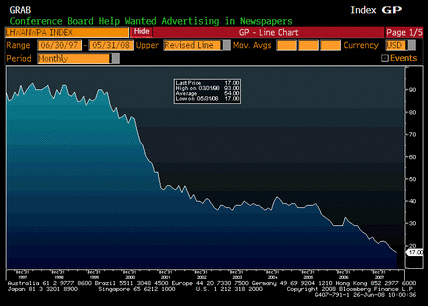
Help Wanted Index (May)
| Survey | 19 |
| Actual | 17 |
| Prior | 19 |
| Revised | 18 |
All evidence shows labor markets still soft.
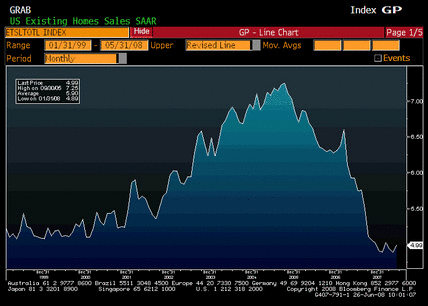
Existing Home Sales (May)
| Survey | 4.95M |
| Actual | 4.99M |
| Prior | 4.89M |
| Revised | n/a |
Continuing signs of a bottom.
ÂÂÂ
Levels are too low given demographics and should recover substantially even with a weak market.
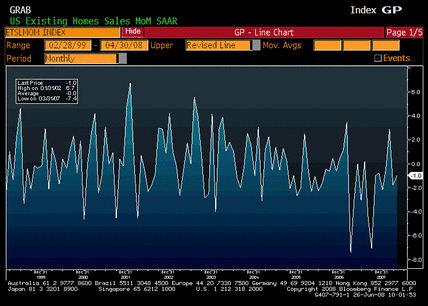
Existing Home Sales MoM (May)
| Survey | 1.2% |
| Actual | 2.0% |
| Prior | -1.0% |
| Revised | n/a |
Better than expected.
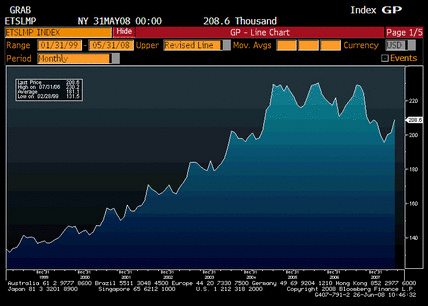
Existing Home Sales Median Price (May)
| Survey | n/a |
| Actual | 208.6 |
| Prior | 201.2 |
| Revised | n/a |
The upturn in prices wasn’t even reported by the mainstream press while the downturns were sensationalized.
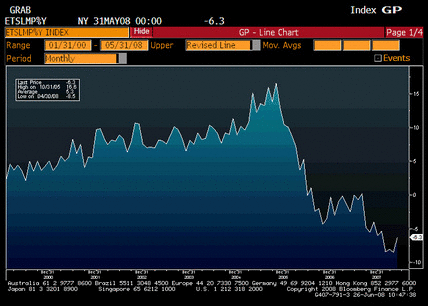
Existing Home Sales Median Price YoY (May)
| Survey | n/a |
| Actual | -6.3% |
| Prior | -8.5% |
| Revised | n/a |
Year over year price declines are far less than the case-shiller index which reports only on the largest metro areas. OFHEO prices declined even less year over year. Again, the mainstream media doesn’t report this and continues to repeat case-shiller numbers.
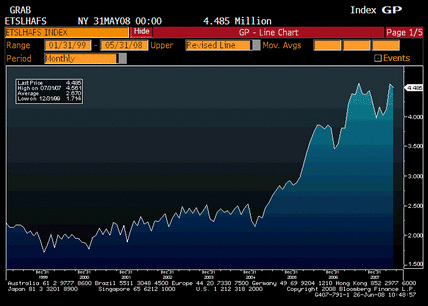
Existing Home Sales Inventories (May)
| Survey | n/a |
| Actual | 4.485 |
| Prior | 4.549 |
| Revised | n/a |
I thought the last spike up was suspect- might have had something to do with foreclosures hitting the list- and may now be turning down as well, following the actual numbers of new homes for sale which has been falling rapidly.
[top]


