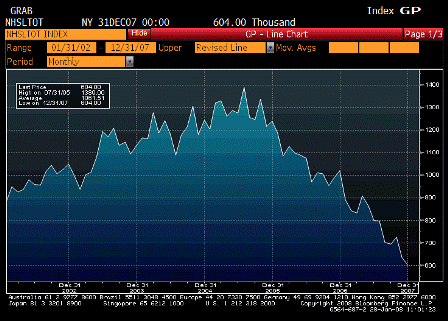
New Home Sales (Dec)
| Survey | 647K |
| Actual | 604K |
| Prior | 647K |
| Revised | 634K |
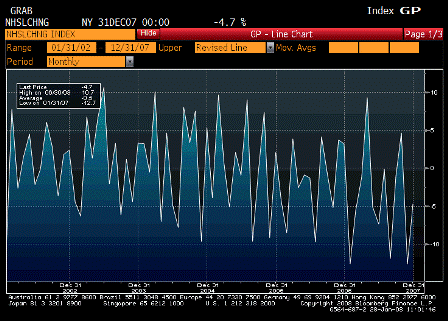
New Home Sales MoM (Dec)
| Survey | 0.0% |
| Actual | -4.7% |
| Prior | -9.0% |
| Revised | -12.6% |
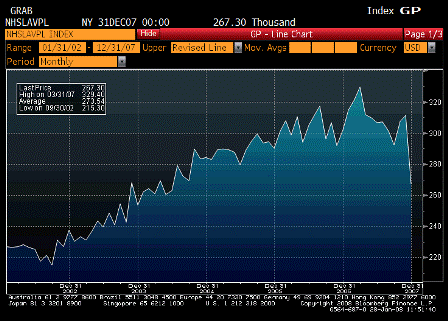
New Home Sales Average Price
| Survey | n/a |
| Actual | 267.3 |
| Prior | 311.2 |
| Revised | n/a |
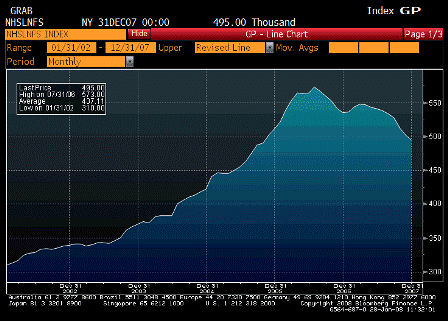
# Homes for Sale
| Survey | n/a |
| Actual | 495 |
| Prior | 502 |
| Revised | n/a |
Home sales data continues to show weakness in the housing sector, which is now a much smaller percentage of GDP than it was a year ago.
I haven’t dug into the numbers to see is weather or other year end issues were a factor.
The December drop was a smaller percentage drop than November.
The lower average price is not quality adjusted.
Interesting that total homes for sale continues to drop, meaning actual inventories are being worked off. I have also seen regional anecdotal evidence of inventories of new homes being relatively tight.
This is consistent with housing starts being down by about 80,000 per month from previous levels and affordability is increasing.
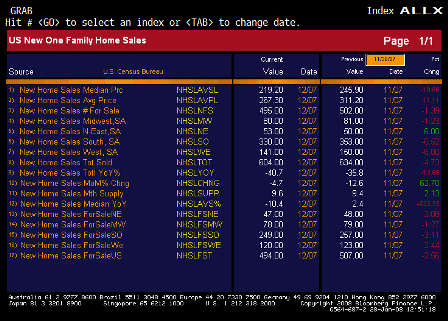
Looks like homes for sale fell in every region.
♥

