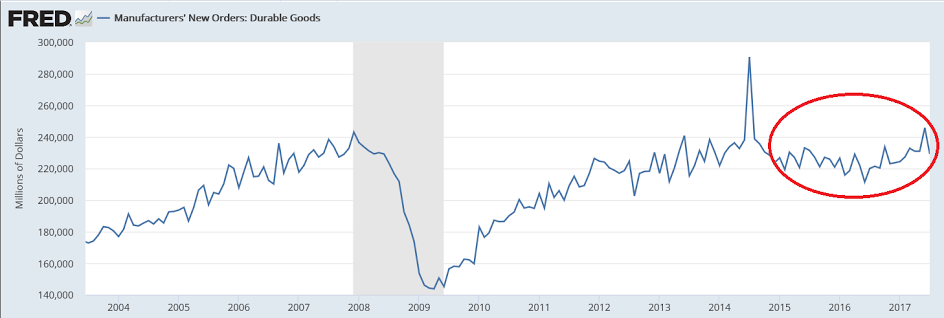
Nothing impressing me here, as per the chart:
Highlights
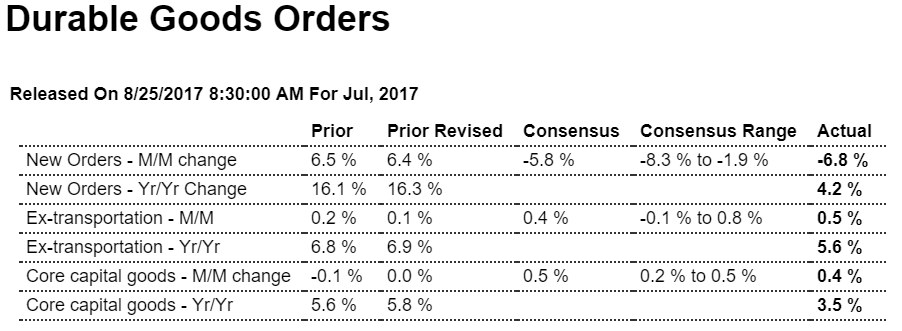
Durable goods orders came in as billed with a steep aircraft-related decline for the headline, at minus 6.8 percent, contrasting with solid gains for ex-transportation at 0.5 percent and core capital goods (nondefense ex-aircraft) at 0.4 percent. A special plus in the report, and one that will lift GDP, is a sharp pickup in shipments of core capital goods, up 1.0 percent in July with June revised 2 tenths higher to 0.6 percent.
Total shipments rose 0.4 percent with inventories keeping a balanced pace, up 0.3 percent. A negative in the report is a 0.3 percent decline in unfilled orders that follows, however, June’s 1.3 percent surge.
For aircraft, which has picked up this year, orders fell 82 percent in July vs June’s enormous 227 percent jump. Orders for defense aircraft, up nearly 50 percent, are a positive in July’s data as is electrical equipment, up 2.6 percent in a good sign for construction. Computers and fabricated metals also show gains. Negatives include a 1.2 percent order decline for vehicles that follows a 0.7 percent decline in June and a 1.4 percent decline for machinery orders that belies the month’s strength for core capital goods.
But positives are definitely the theme of today’s report, one that helps offset last week’s unexpected decline in manufacturing production and supports the enormous strength being signaled by advance regional reports. The economy may very well get a solid second-half boost from what has been an improving factory sector.
Nothing good here either:
From WardsAuto: Forecast: U.S. Auto Market Continues Downward Trend in August
A WardsAuto forecast calls for U.S. automakers to deliver 1.51 million light vehicles in August. … The report puts the seasonally adjusted annual rate of sales for August at 16.5 million units, below the 17.1 million SAAR in same-month 2016 and 16.7 million in prior-month 2017.
…
Light-vehicle inventory stood at 3.86 million units at the end of July, up 9.4% from year-ago and about 15% higher than necessary with current sales rates. The streak of record-high stock is expected to continue with 3.8 million units at the end of August, 7.5% greater than same-month 2016. This will leave automakers with a 69 days’ supply, same as prior-month, but well above year-ago’s 62. Slowdowns in production and higher sales incentives through September are expected to narrow the gap between supply and demand.Read more at http://www.calculatedriskblog.com/#oMiQuZGzVghgXYBq.99
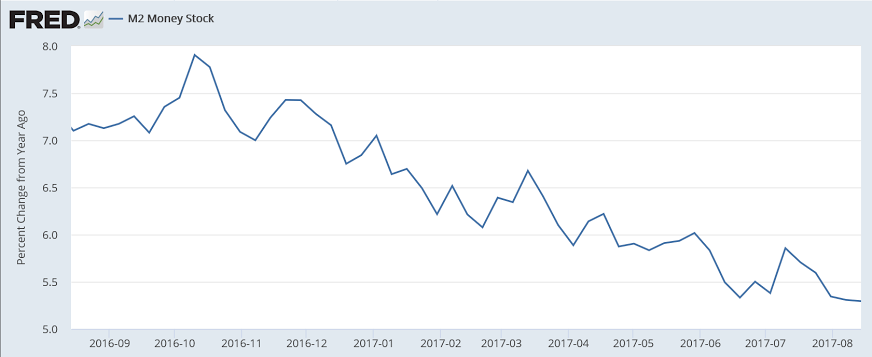
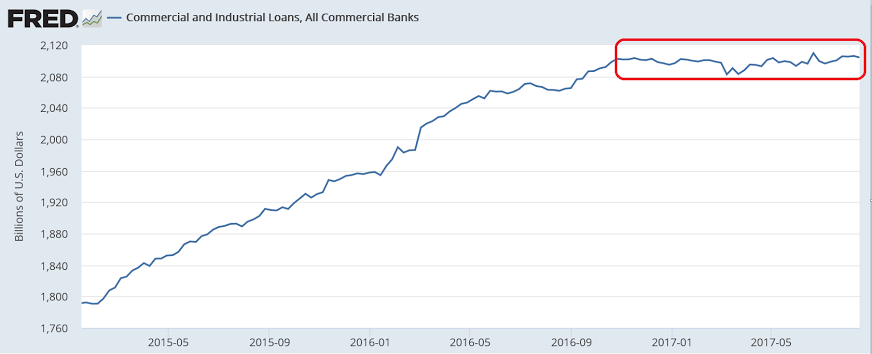
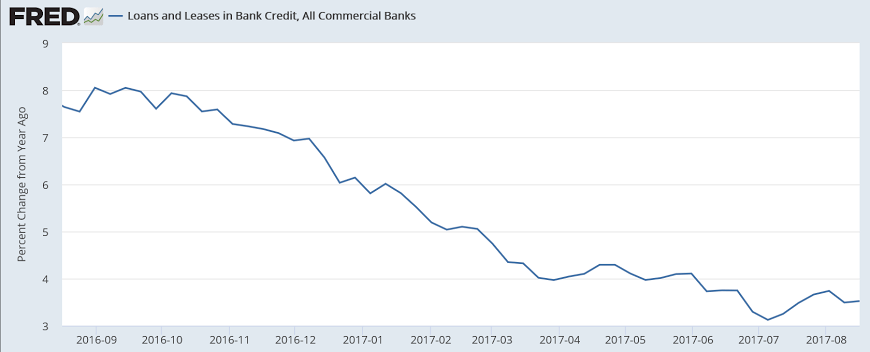
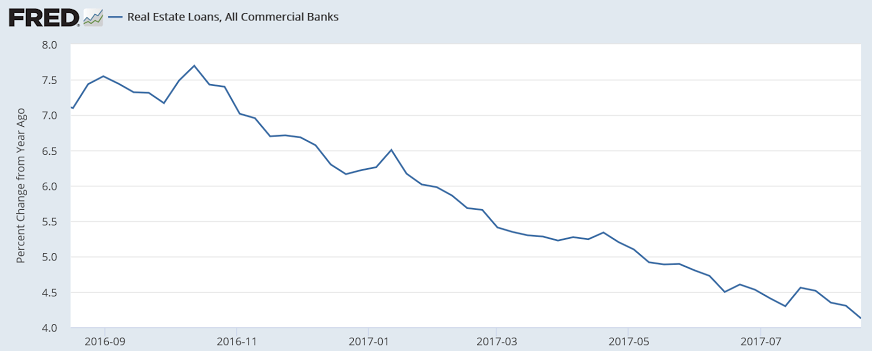
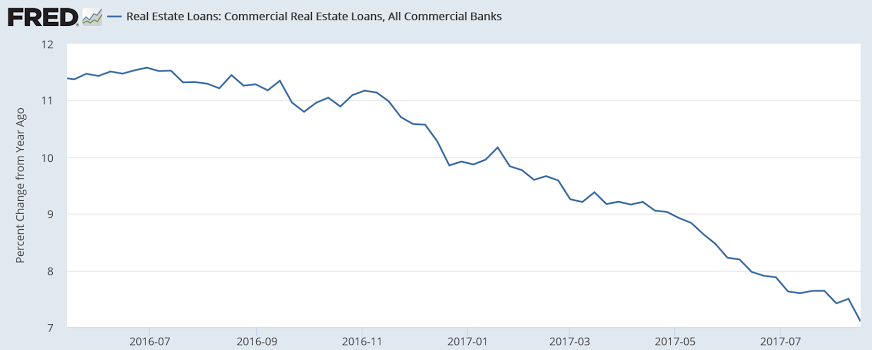
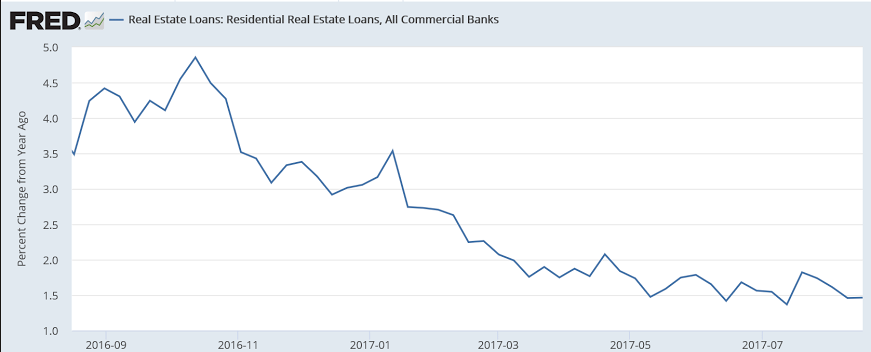
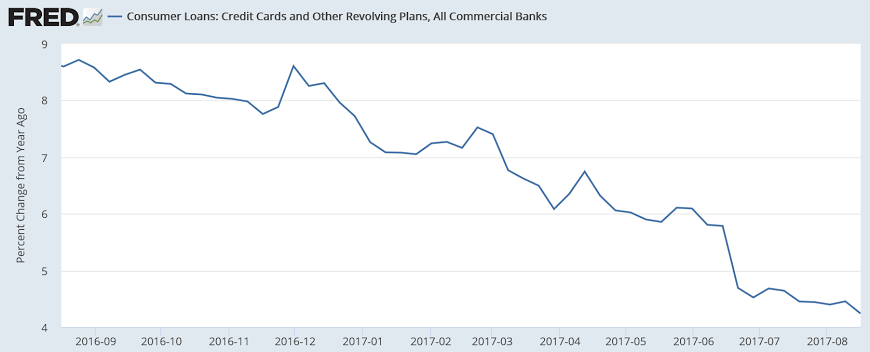
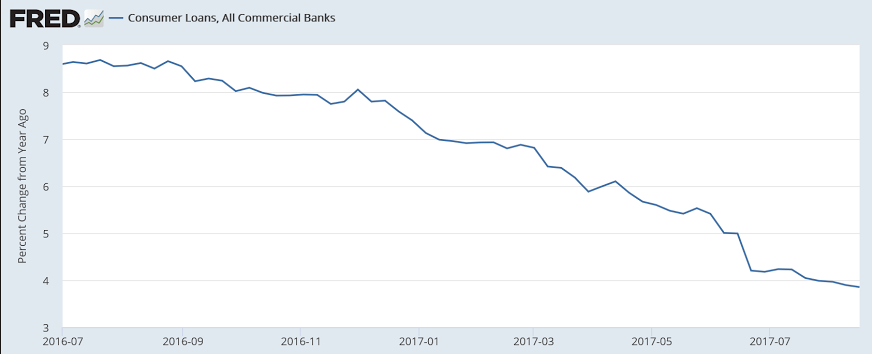
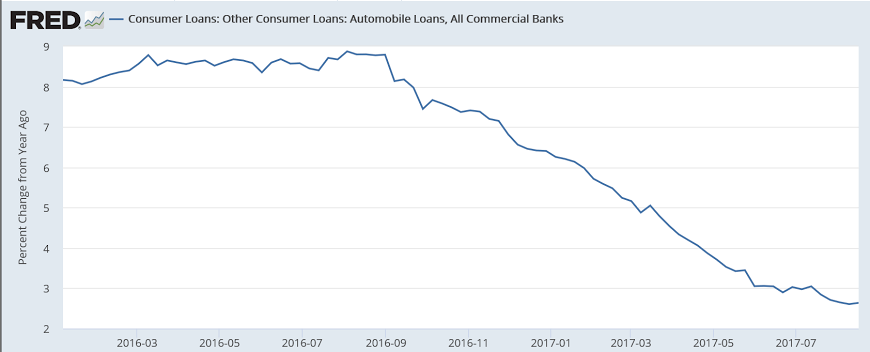
With each data release it seems more likely to me that the deceleration in the growth of borrowing from the banks is reflecting a drop in aggregate demand:
Growth of C and I loans has been near 0 since the election:
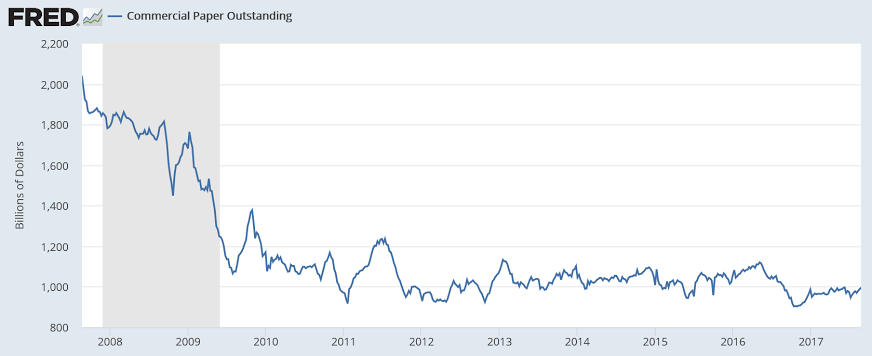
Loans create deposits, so here it is from a segment of the deposit side. M2 includes M1 which is directly affected by the size of the Fed’s portfolio and QE, however those variables have been largely unchanged for the time period of this chart: