
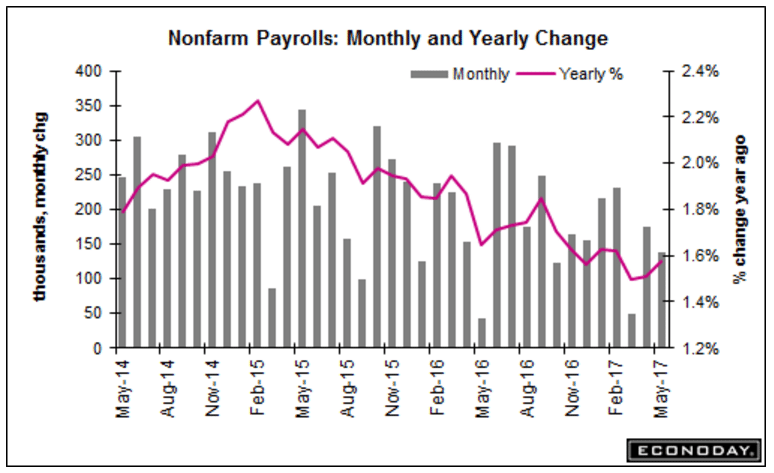
The chart says it all- deceleration that started when oil capex collapsed not abetting, and the decelerating credit charts indicate much more of same coming:
Highlights
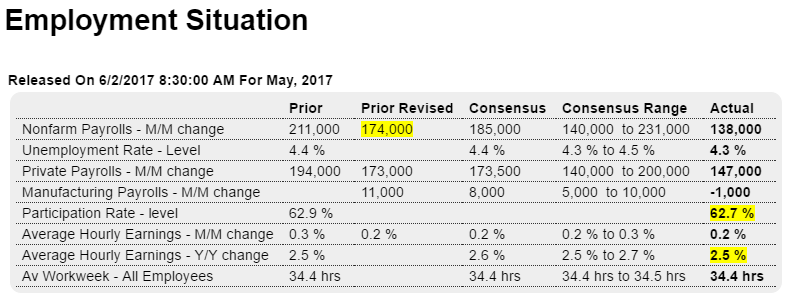
An unexpectedly weak employment report has put a rate hike at this month’s FOMC in doubt. Nonfarm payrolls rose only 138,000 in May which is nearly 50,000 below expectations. Importantly, April and March have been downwardly revised by a net 66,000.
Average hourly earnings are also not favorable, up only 02 percent in May with April revised down 1 tenth and now also at 0.2 percent. Wages are going nowhere with the year-on-year rate sitting at 2.5 percent.
A fall in the participation is yet another negative, down 2 tenths to 62.7 percent and pulling the unemployment rate down 1 tenth to only 4.3 percent. Unemployment is very low and contrasts with the lack of wage pressure.
Manufacturing jobs fell 1,000 in May, retail trade down 6,000, and government down 9,000. There were gainers including construction at 11,000, financial also at 11,000, and professional services at a healthy 38,000.
And these gains tell the other side of this report, that payroll growth, though moving lower, is still healthy. That is what the hawks are going to have argue at the June 13 & 14 meeting, that and the theoretical inevitability that wage pressures will soon build.
Higher than expected trade deficit means GDP was that much lower than expected. And all highly $US unfriendly:

Highlights
The bad news is accelerating for the second quarter. The trade deficit widened in April to $47.6 billion from a revised $45.3 billion in March. This opens the quarter on yet another defensive front.
Exports fell 0.3 percent in April to $191.0 billion as a fractional rise in service exports to $64.0 billion could not outmatch a 0.4 percent decline in goods exports to $126.9 billion.
Imports meanwhile jumped 0.8 percent to $238.6 billion with increasing pressure centered in goods but also including services.
The best positive in the details is a rise in aircraft exports and the worst negative is yet another jump in consumer goods imports, up $2.0 billion in the month to $51.0 billion. Country data show a sharp widening with China, to a $27.6 billion total gap in the month, with the EU gap also up sharply to $14.6 billion.
The conclusion? U.S. demand for foreign products is strong and foreign demand for U.S. products is not.