This was a surprise:

Highlights
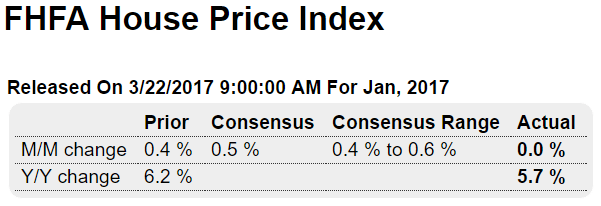
In an unusually weak showing, the FHFA house price index came in unchanged in January with year-on-year appreciation falling a steep 5 tenths to 5.7 percent. This is the weakest month-to-month showing in more than 4 years and the weakest year-on-year rate in 2-1/2 years.
Also weak:
![]()

Highlights
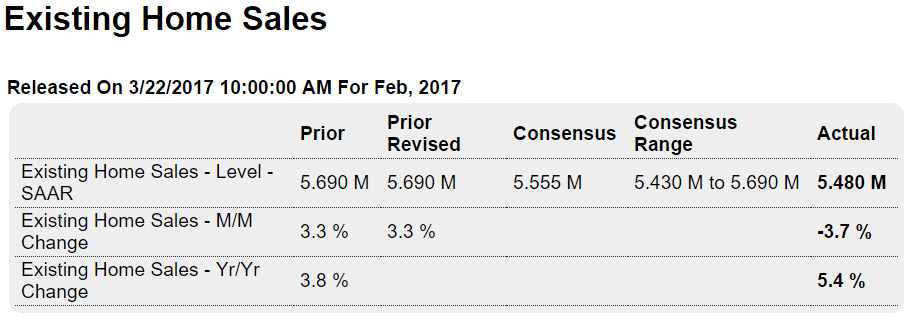
Existing home sales are on the soft side of expectations, down 3.7 percent in February to a 5.480 million annualized rate and below the Econoday consensus for 5.555 million. Details are mostly weak including a 3.0 percent decline for single-family sales to a 4.890 million rate and a sharp 9.2 percent drop for condos to a 590,000 rate. Year-on-year, single-family sales are up 5.8 percent with condos fading and barely over zero at 1.7 percent.
But total year-on-year sales are up a solid 5.4 percent and still below pricing where the median, at $228,400, is up a healthy 7.7 percent. Supply has been very thin but is improving, with 1.750 million resales on the market for a 4.2 percent gain from January. And relative to sales, supply is at 3.8 months vs January’s 3.5 months. Days on the market are very short, at 45 vs 59 days a year ago.
By region, the Northeast had a very weak February, down 13.8 percent to a 690,000 rate. And there is also weakness in the Midwest, with a 7.0 percent monthly decline to a 1.200 million rate, and the West, down 3.1 percent to 1.250 million. But the West is showing the most yearly strength at plus 9.6 percent while the Northeast brings up the rear at plus 1.5 percent.
The pending home sales index, which tracks initial contract signings for resales, accurately anticipated weakness in today’s report, one that underscores the still hesitant activity in the housing sector. Watch for new home sales on tomorrow’s calendar where, unlike this report, improvement is the call for February.
This was released a few days ago.
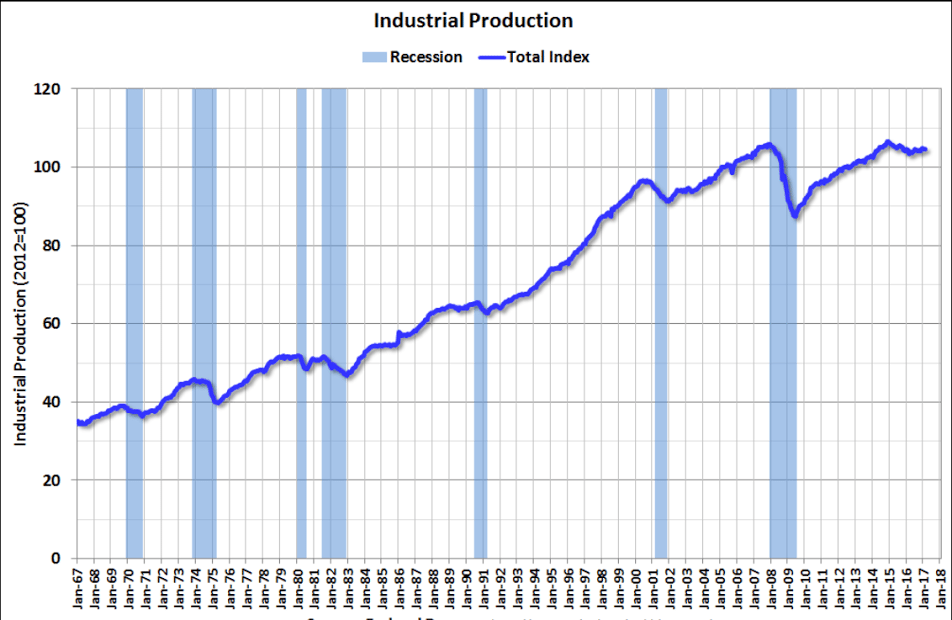
Note how the move down historically has coincided with recessions:

