First the good news:
Up more than expected and last month revised higher:
Highlights
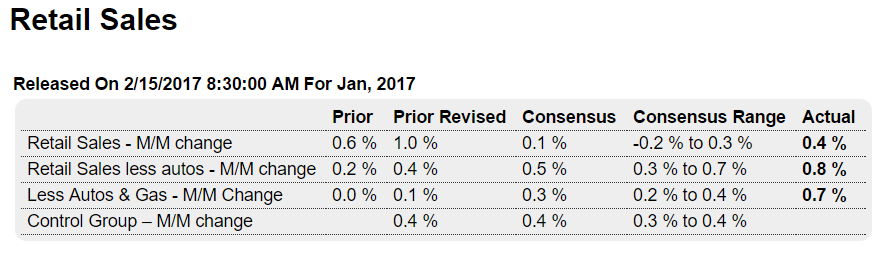
Consumer spending data have been surprisingly moderate given the unusual strength in consumer confidence, but today’s retail sales report, which includes an important revision, now moves spending more in line with confidence. Retail sales rose 0.4 percent in January which tops Econoday’s very modest 0.1 percent consensus and the top estimate of 0.3 percent. Importantly December, which is the most important retail month, is now revised a sharp 4 tenths higher to a very strong plus 1.0 percent.
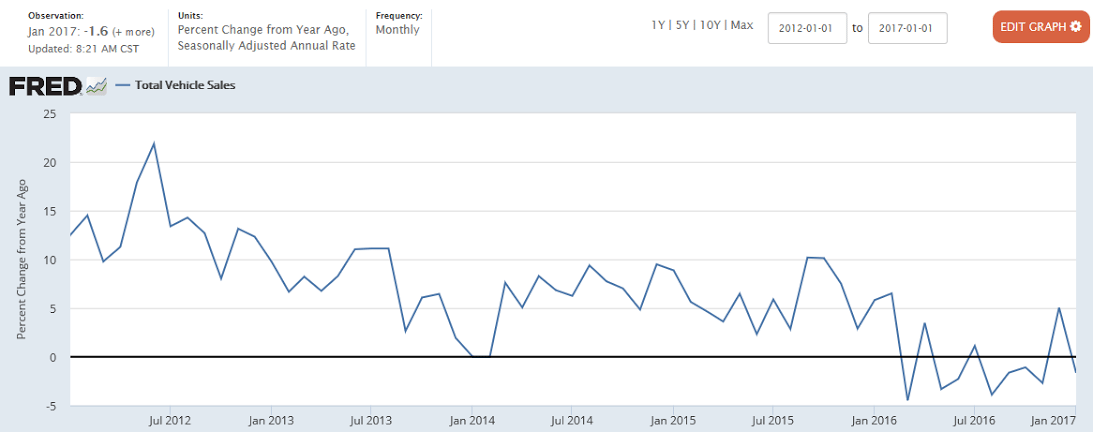
Vehicles were the special strength of the December report, at a revised plus 3.2 percent vs an initial 2.4 percent, and in a give back are really the only weakness in the January report at minus 1.4 percent. Excluding vehicles, retail sales jumped a very sharp 0.8 percent in January which again beats the top forecast. Ex-auto for December is also part of the good news, revised 2 tenths higher to 0.4 percent.
Electronics & appliance stores show a big January gain at 1.6 percent with restaurants at 1.4 percent and department stores up 1.2 percent. Sporting goods, clothing, health & personal care and building materials all show gains.
But gasoline, where prices are up, have been adding to the gains the past two months and excluding which sales in January show a less impressive gain of only 0.2 percent. This reading for December, however, is a much more impressive plus 0.8 percent.
But gasoline only dims the strength of the report for January which, next to February, is the slowest month on the retail calendar. Today’s data point to momentum for consumer spending, which is by far the economy’s most important sector.
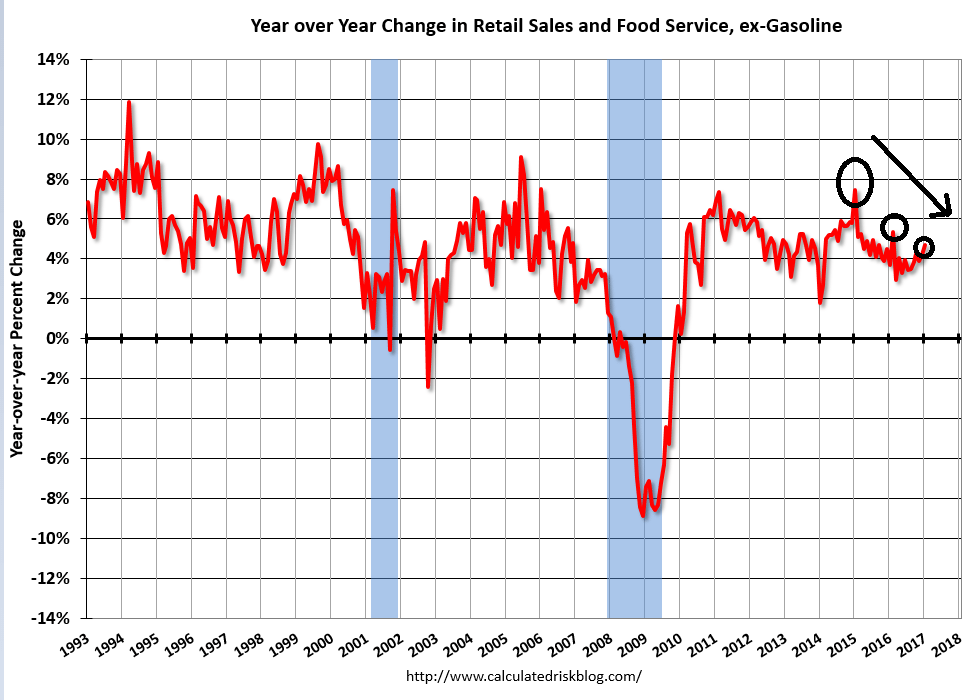
I’m waiting to see if the spikes keep getting lower as in the prior cycle:
Now the not so good news:
As previously discussed, it was weather related elevated utility output that supported the higher than expected report.
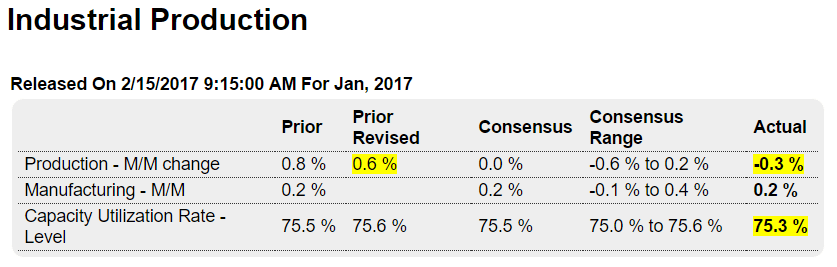
Now last month has been revised lower and this month has reversed as utility output ‘normalizes’:
Highlights
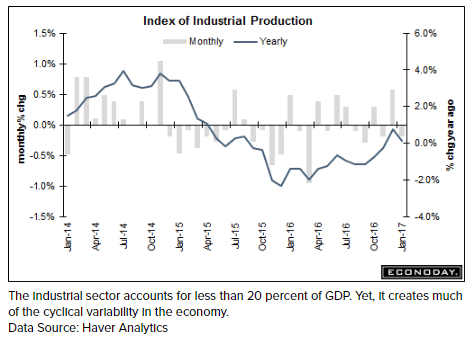
A swing in utility output skewed what is, however, no better than a modest industrial production report for January. Industrial production, reflecting a 5.7 percent weather-related drop for utilities, fell 0.3 percent which is below Econoday’s no-change consensus.
But the real disappointment in the report is the manufacturing component which could muster no better than a consensus gain of 0.2 percent. This reading hasn’t been able to build any momentum to speak of and was held down in January by a sharp 2.9 percent monthly downswing in vehicles. Excluding motor vehicles, manufacturing volumes rose 0.5 percent which is really the highlight of today’s report. Also a highlight though is mining which is the report’s third and smallest component. Mining continues to show new life with a very sharp 2.8 percent jump in January.
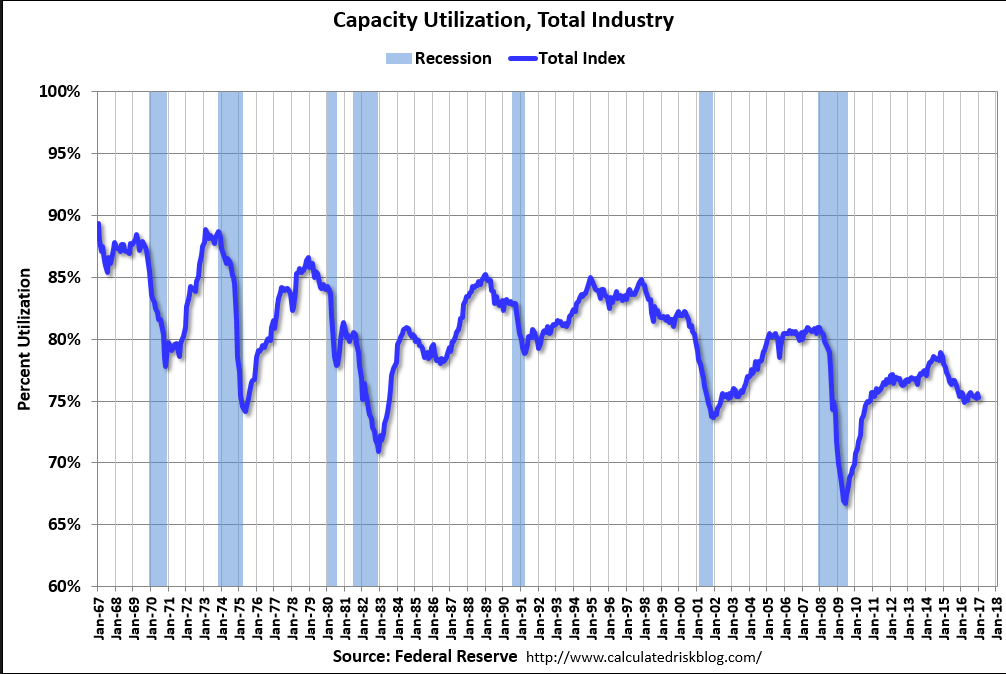
Overall capacity utilization reflects the general softness of the industrial sector, at 75.3 percent for a 3 tenths decline in the month and 4.6 percentage points below its long run average. Manufacturing utilization is likewise soft at 75.1 percent.
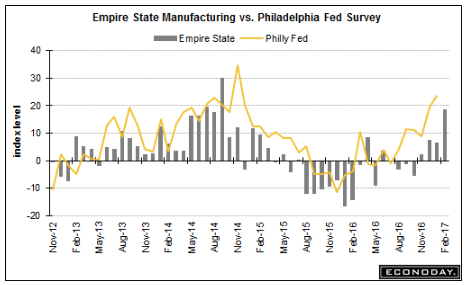
The industrial economy, held down by weak global demand, has been running below average the past 2-1/2 years, when energy prices first collapsed in mid-2014. But advance indicators, including this morning’s Empire State report, are almost uniformly pointing to a rebound ahead, a rebound however that has yet to appear in the government’s definitive data.
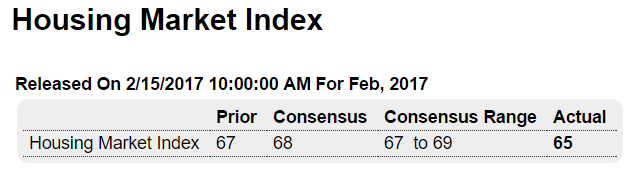
Highlights
The big post-election surge in home builder optimism is over as the February housing market index is down 2 points to a much lower-than-expected 65. This is still well above breakeven 50 and points to confidence but marks a noticeable drop from 67 and 69 in January and December.
Builder confidence in the market for newly-built single-family homes declined two points in February to a level of 65 on the National Association of Home Builders/Wells Fargo Housing Market Index (HMI).
Read more at http://www.calculatedriskblog.com/#d255y1KsUy63VrWh.99All three HMI components fell in February. The component gauging current sales conditions dipped one point to 71, and the index charting sales expectations in the next six months registered a three-point decline to 73. The component measuring buyer traffic dropped five points to 46.
Read more at http://www.calculatedriskblog.com/#d255y1KsUy63VrWh.99
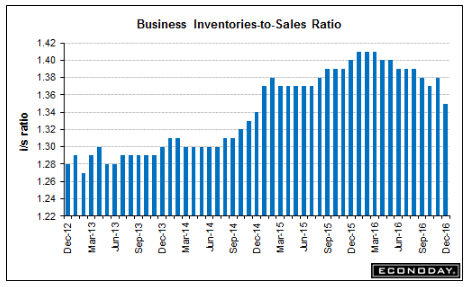
Inventory/sales ratio came down but watch for a reversal in Jan as vehicle and other sales were down. And in any case they remain elevated: