Notable only in that analysts are calling the latest 1% increase ‘strong growth’…
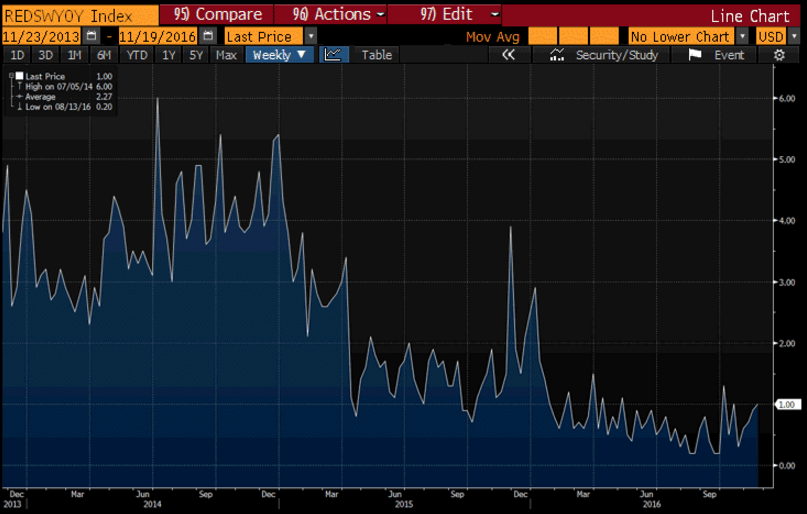
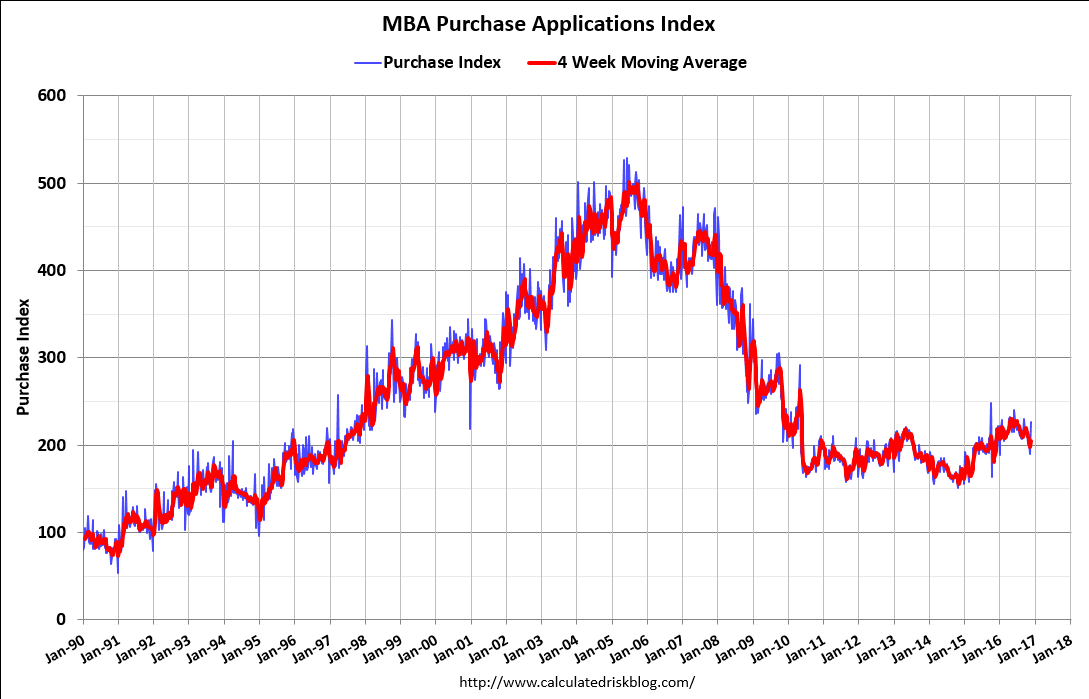
First a big move down, now a rush to get in ahead of fed rate hikes. But still remains depressed by historical standards:
Highlights
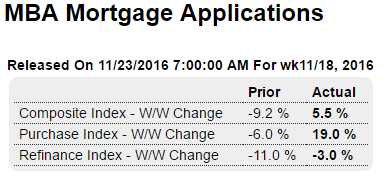
Rising interest rates are causing some volatility in mortgage activity, with purchase applications for home mortgages increasing by an outsized, seasonally adjusted 19 percent in the November 18 week after falling 6 percent in the prior week, while refinancing applications declined by 3 percent following an 11 percent fall. The weekly change put the Purchase Index back up to 11 percent above the level a year ago. The average interest rate on 30-year fixed-rate conforming mortgages ($417,000 or less) jumped 21 basis points to 4.16 percent following the prior week’s 18-basis-point increase.
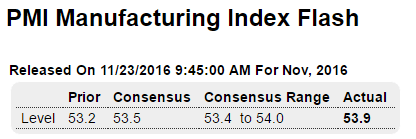
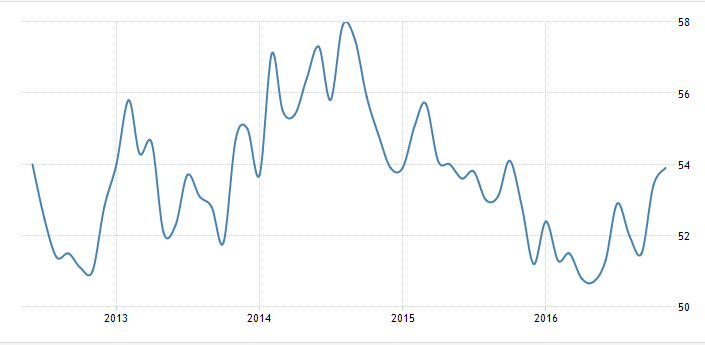
A bit better than expected, as manufacturing chugs along at the lower levels:
Highlights
November flash manufacturing PMI reading climbed to 53.9 from 53.4 in October, signaling a further solid improvement in overall business conditions across the manufacturing sector. The headline index was the highest since October 2015, largely reflecting robust output and new business growth during the latest survey period.
Production volumes have now increased for six consecutive months and the latest rise was the strongest since March 2015 thanks to improving underlying demand and generally supportive domestic economic conditions. New order growth picked up to its fastest for 13 months in November. Anecdotal evidence suggested that increased sales to domestic clients had driven the latest upturn in new work. However, new export orders rose only marginally, which manufacturers linked to competitive pressures and the strong dollar in particular.
Higher levels of incoming new business resulted in a further increase in unfinished work. The rate of backlog accumulation was the fastest since July, which some firms attributed to capacity pressures and stronger-than-expected sales. This contributed to a modest rebound in payroll numbers, although the pace of staff hiring remained slightly weaker than its post-crisis trend.
Manufacturers indicated that cost pressures remained subdued with the latest rise in input prices softer than during October and well below the long run survey average.
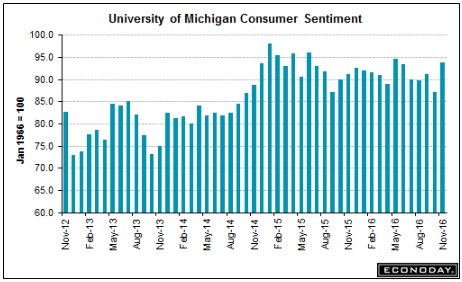
Popped back up with the election:
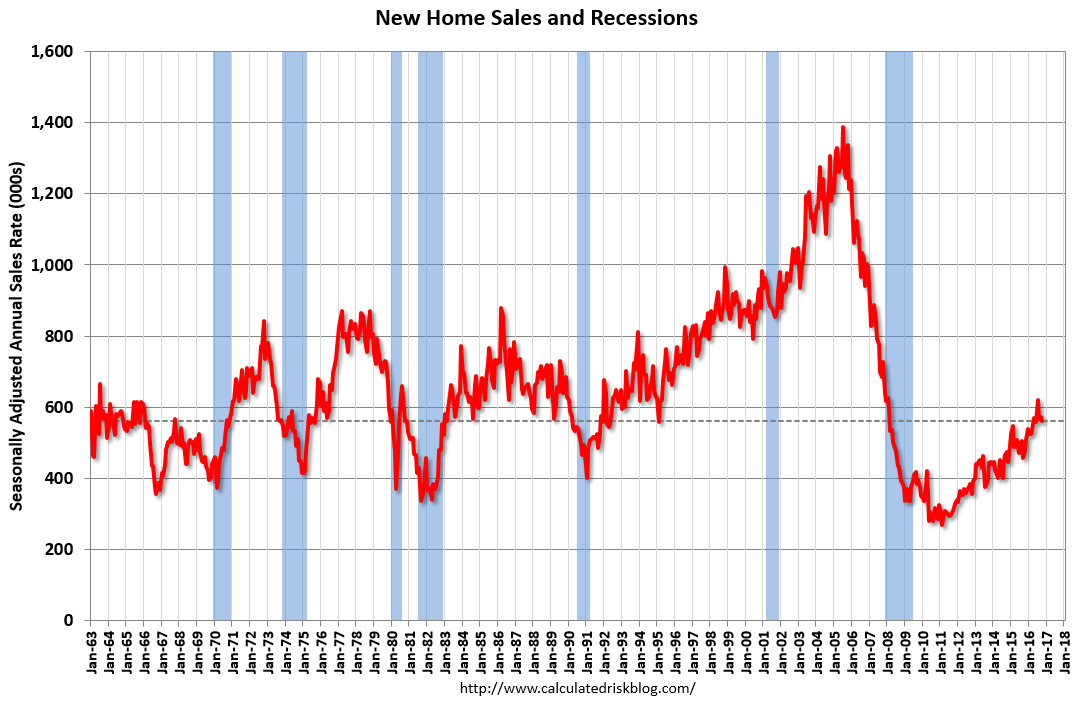
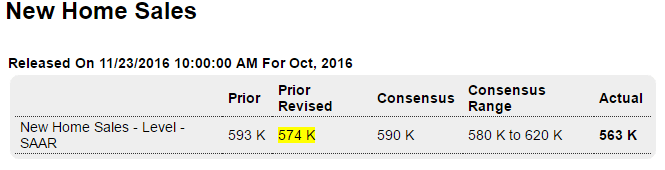
New home sales fall in line with permits, which have been relatively flat, so makes sense that sales have flattened out:
Highlights
October sales of new single family houses declined 1.9 percent to a weaker than expected an annualized rate of 563,000. On the year, sales were up 17.8 percent. Expectations were for an annualized rate of 590,000. September sales were revised down substantially to 574,000 from 593,000. The October pace was behind the third quarter pace but in line with the second quarter average.
Three of the four regions saw a decline in sales. Sales declined 9.1 percent in the Northeast, dropped 13.7 percent in the Midwest and were 3.0 percent lower in the South. However, sales were up 8.8 percent in the West.
The supply of new homes on the market increased 2.9 percent to 246,000 and the strongest since September 2009. The supply of new homes on the market climbed to 5.2 percent from 5.0 percent.
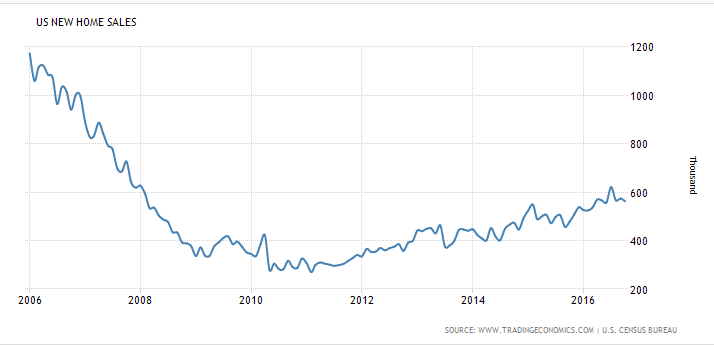
Longer view shows how depressed housing is, and this chart is not population adjusted: