No one seems to know how much weight the Fed gives to this index:
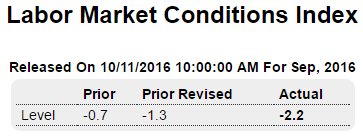
Highlights
The labor market conditions index came in at minus 2.2 in September, extending its soft trend this cycle.
Definition
The Labor Market Conditions Index is an experimental indicator compiled by the Federal Reserve to track labor market activity. It is a broad composite with 19 components.
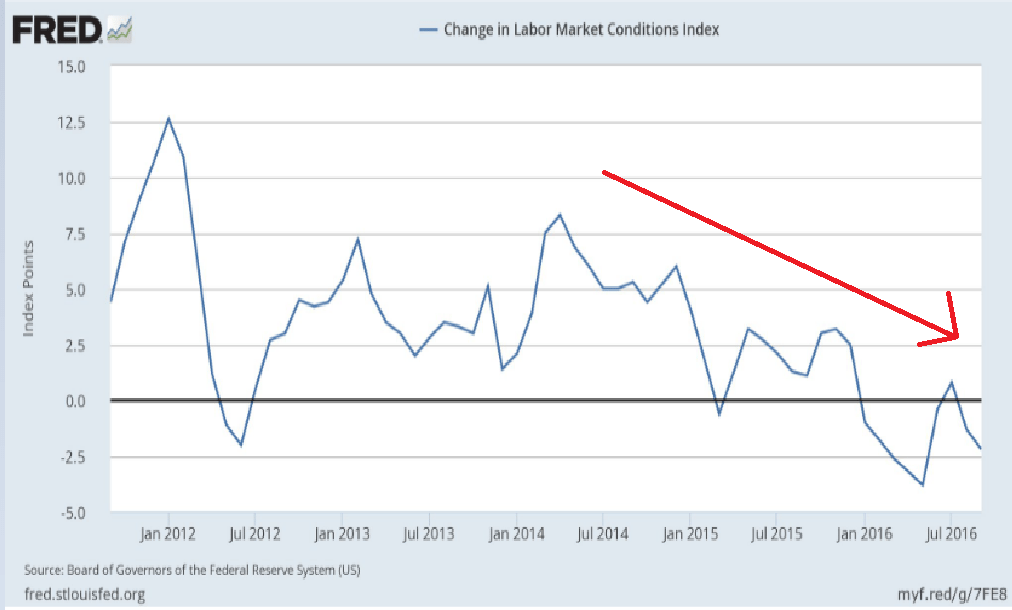
Just my imagination that this has been decelerating since the drop in oil capex?
My oil related comments:
Any kind of oil deal with Russia would likely include a price and a quantity. There’s not enough demand for them all to pump flat out, which means they need to set a price and then ‘ration’ who gets to pump how much at that price.
So they probably are discussing how high then can price their oil without triggering excess supply, particularly from the US. And the price has to be specifically defined as either a price in one currency, such as $US, or some kind of basket of currencies, etc.
This kind of comprehensive agreement is a lot more problematic to engineer than a simple output cut.
Meanwhile, Saudis continue as price setter.
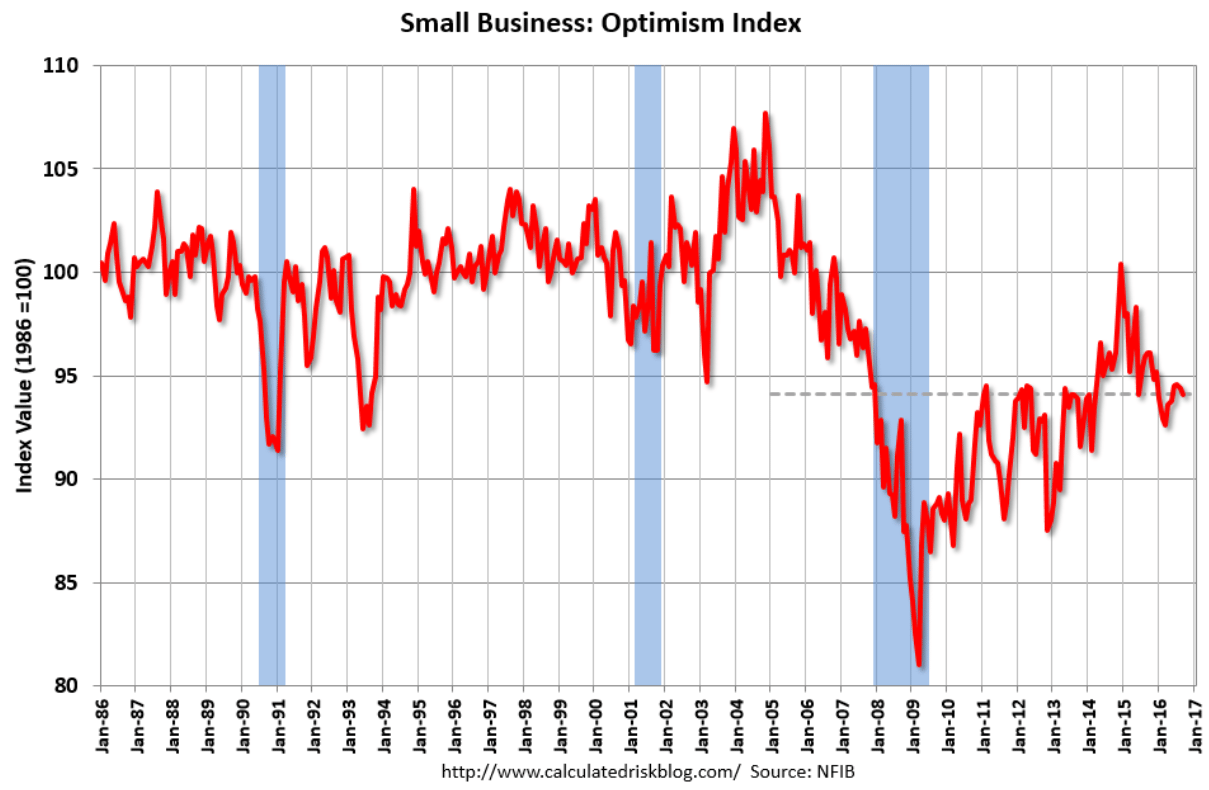
This longer term chart shows how low this series is, and note the acceleration during the 2014 shale boom followed by the following deceleration from the collapse of oil prices and oil consequent oil capex that happened about 2 years ago: