Lightweight cars and trucks better than expected, but heavy weight truck sales brought down the total:
Highlights
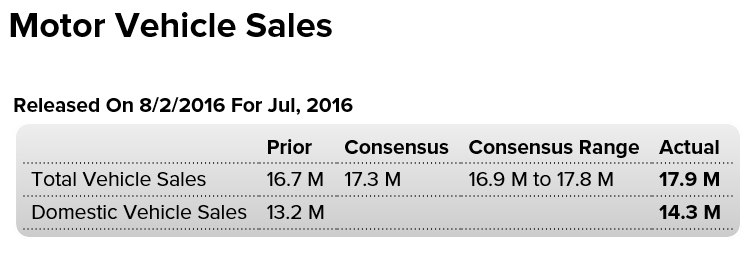
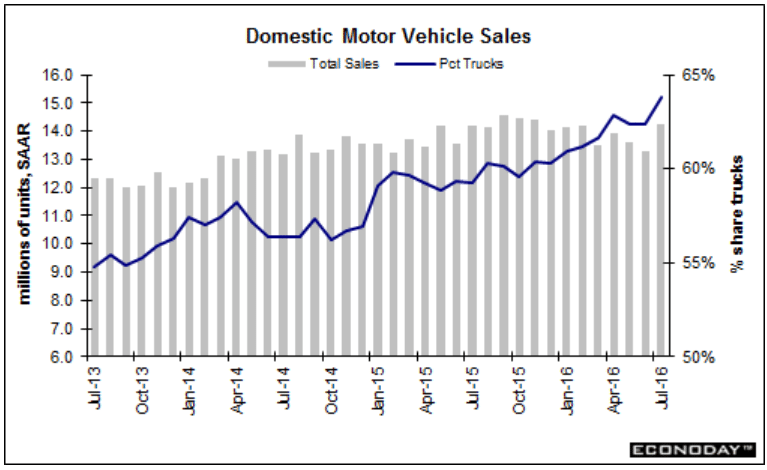
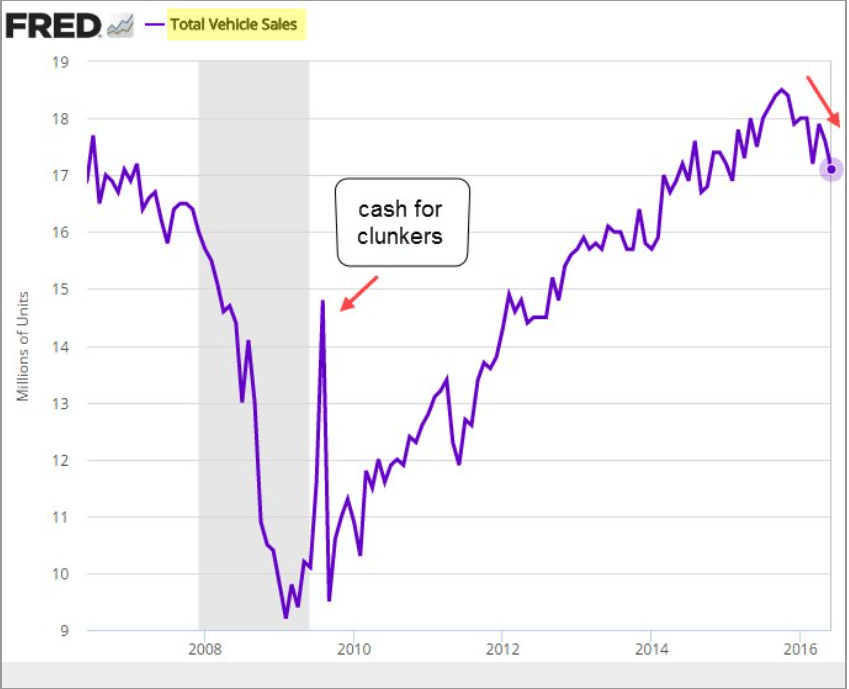
July proved to be a very strong month for vehicle sales, pointing to accelerating strength for consumer spending. Vehicles sold at a 17.9 million annualized rate in the month which is far above June’s 16.7 million. Unit sales offer only a rough indication for the motor vehicle component of the retail sales report but July’s indication is unusually strong. Sales are getting a boost from favorable loan terms and aggressive manufacturer incentives.One detail especially pointing to strength for the retail sales report is an outsized gain for North American-made light trucks, to a 9.1 million rate from June’s 8.3 million. Trucks on average cost more than cars which will help the dollar totals of the retail sales report. Motor vehicle sales make up about 20 percent of total retail sales.
Domestic sales:
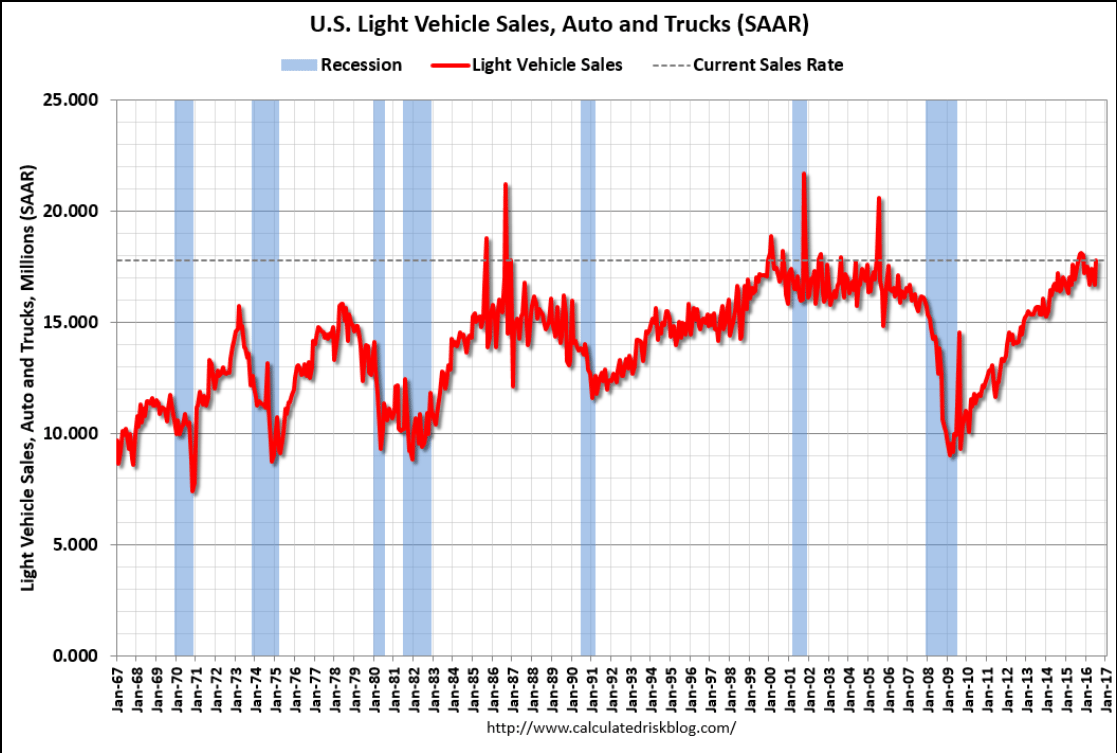
Total domestic and imported light vehicle sales:
Heavy weight truck sales (and these cost a lot more than light weight trucks) brought total vehicle sales down from the prior month:
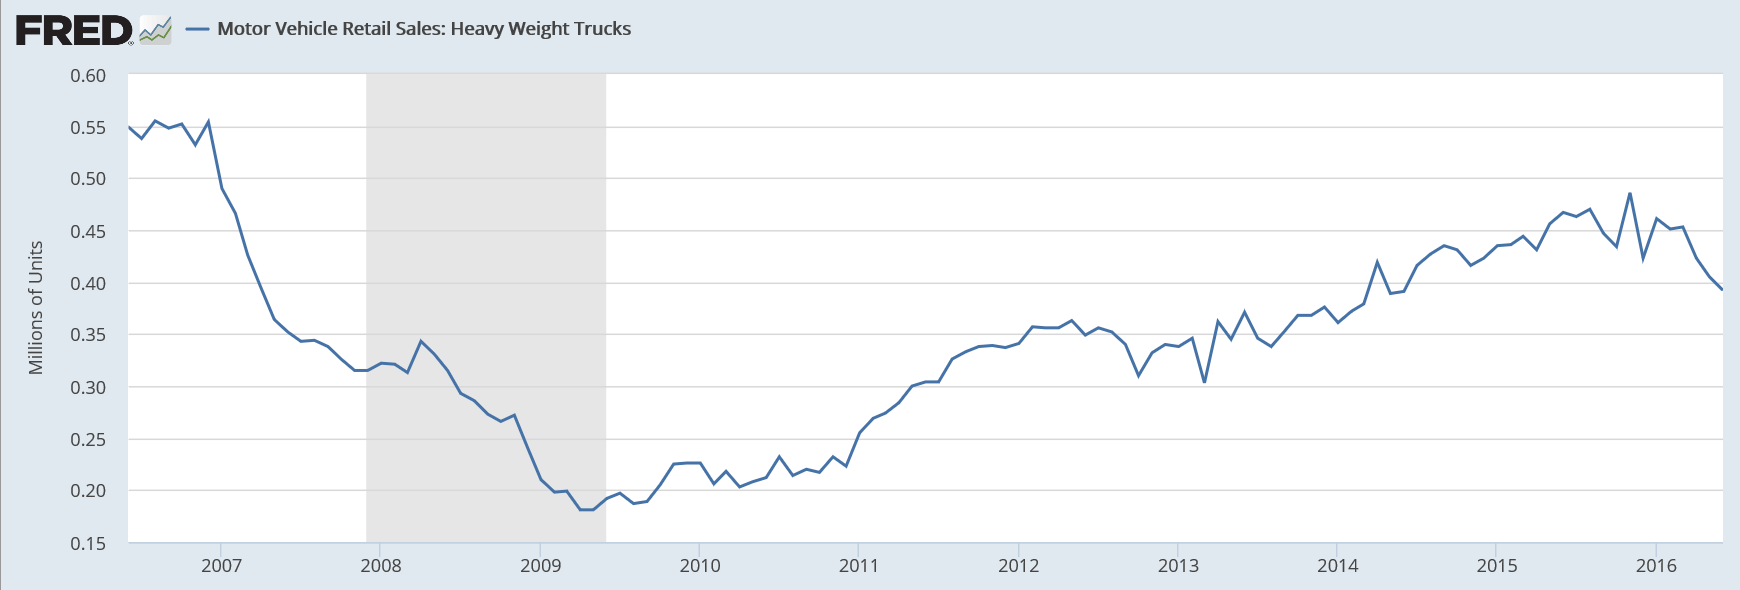
Not good! Down, and the year over year change has been dropping steadily as well:
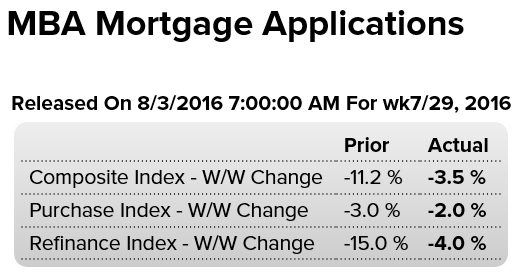
“…the seasonally adjusted Government Purchase Index fell to the lowest level since November 2015. The unadjusted Purchase Index decreased 2 percent compared with the previous week and was 6 percent higher than the same week one year ago.”
This is a forecast and not a survey:
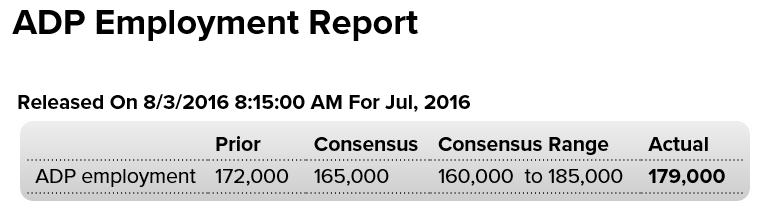
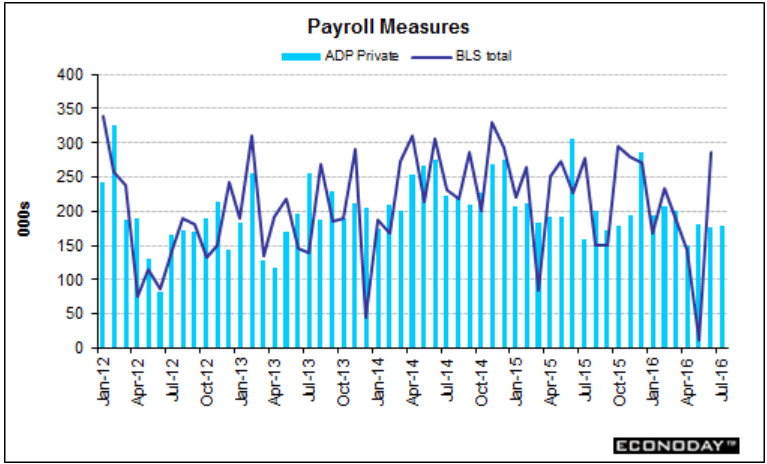
Highlights
Growth in the labor market held firm and steady in July, based on ADP’s 179,000 estimate for private payrolls in Friday’s employment report. The result is near the top-end of the Econoday forecast range and is slightly higher than ADP’s estimate for June. And June proved very strong in the government data, up 265,000. Next indication on Friday’s data will be the ISM’s non-manufacturing employment index to be released later this morning at 10:00 a.m. ET.
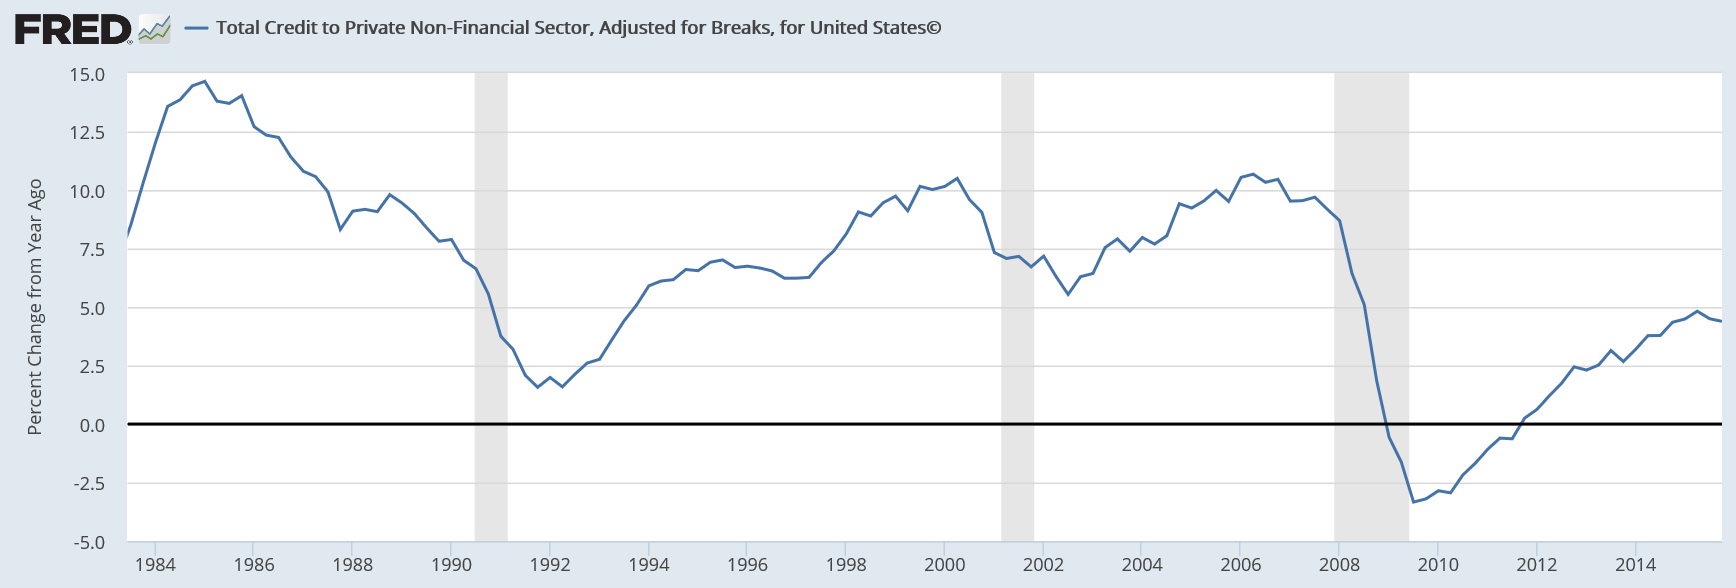
Gradually working it’s way lower:
Secular stagnation is entirely about the lack of private sector credit growth without ‘compensating’ deficits from the public sector. It’s always an unspent income story…
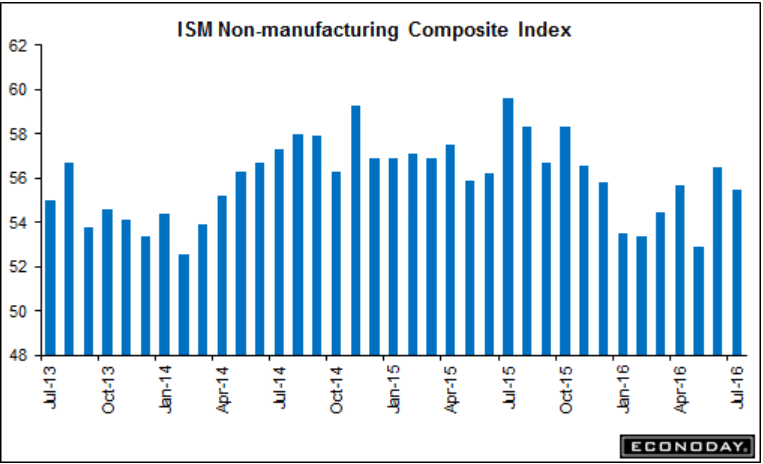
Manufacturing was a bit better but services, the much larger sector, remains at the lows, as previously discussed:
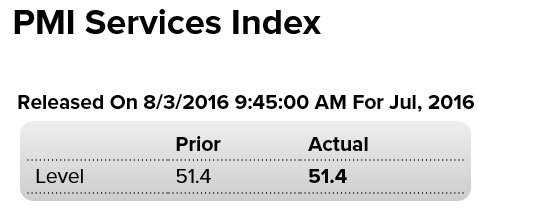
A bit worse than expected:
Highlights
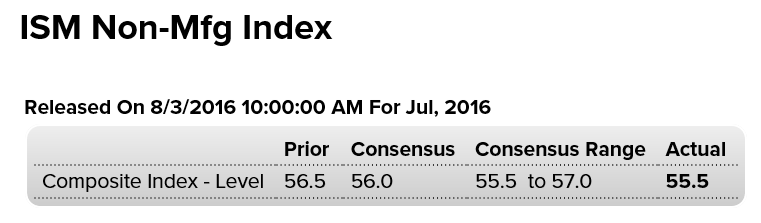
Conditions, especially for orders, remain very strong for the ISM’s non-manufacturing sample. The report’s composite index did slip 1.0 point to 55.5 which is slightly below expectations but new orders rose in the month, up 4 tenths to 60.3 for the best showing since October last year. The bulk of the decline in the composite is due to a 3 point drop in delivery times which, in a signal of easing constraints in the supply chain, slowed only slightly in the month.
The other negative factor for the composite is a noticeable dip in employment, down 1.3 points to a very soft 51.4. This reading, in contrast to other advance indications, is not pointing to much strength for Friday’s employment report. But other readings are very positive including business activity at 59.3, export orders at 55.5, and total backlog orders at 51.0 for a 4.5 point gain.
The order strength in this report points to early third-quarter acceleration for the bulk of the U.S. economy.