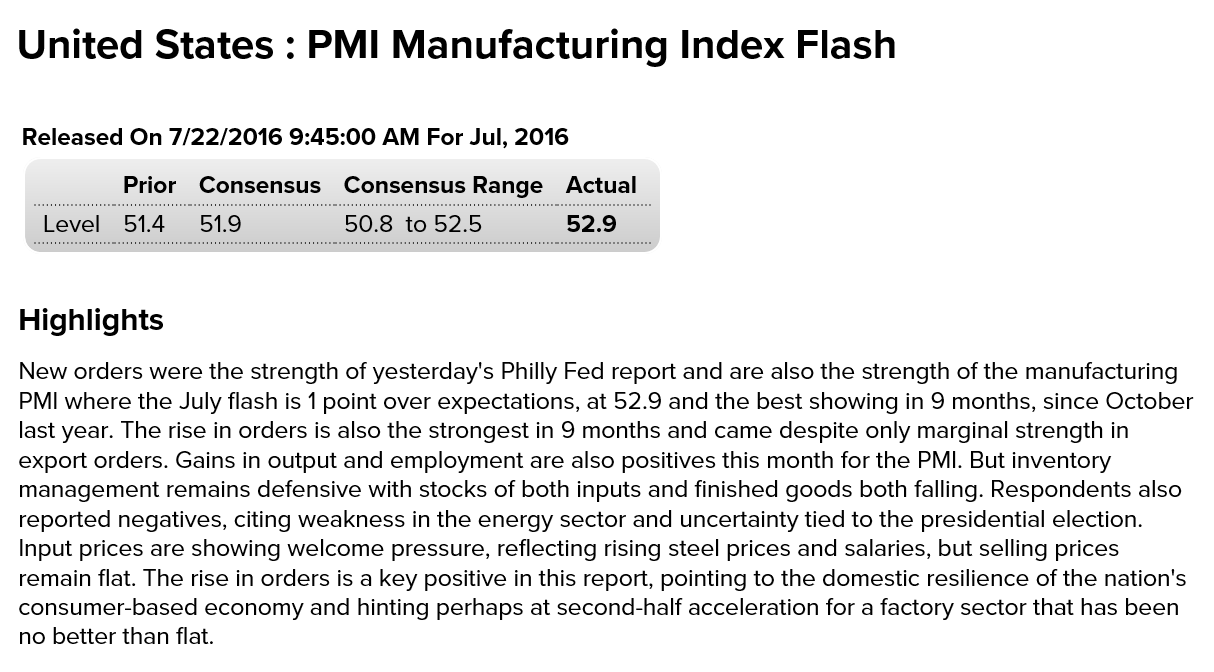
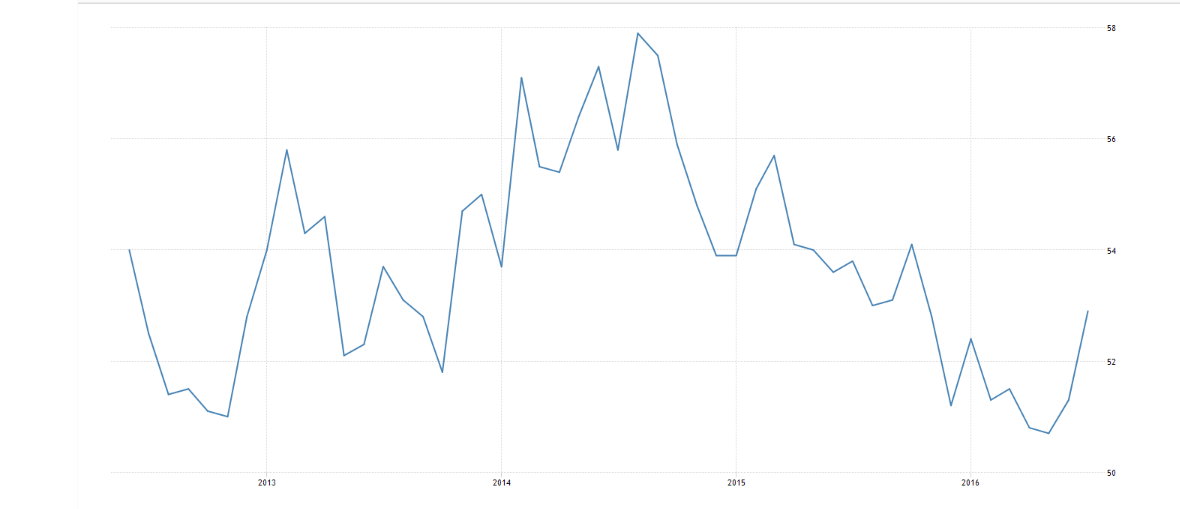
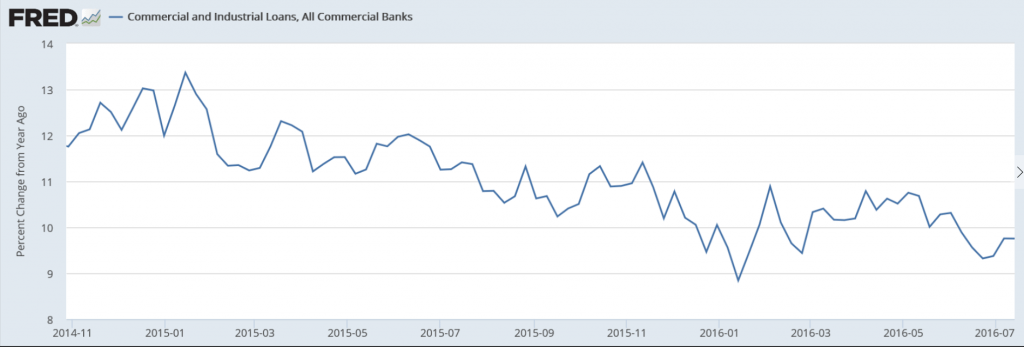
A bit better than expected, and the narrative sounds hopeful, but the chart still looking like there’s a long way to go to get back to where we were before the collapse of oil capex. And no sign of emergence of deficit spending- private or public- to drive top line growth:
Looks to me like this measure of bank loan growth has been going downhill ever since the collapse in oil capex:
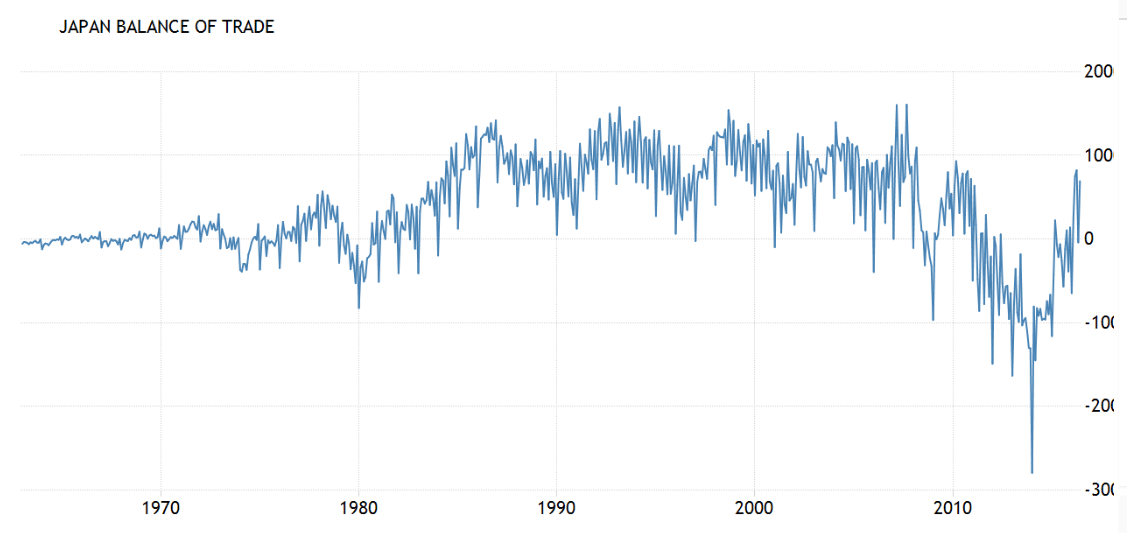
Japan is rebuilding it’s trade surplus that made the yen the strongest currency in the world and consequently their selling of yen to keep the yen appreciation in check to sustain ‘competitiveness’ allowed them to build their hoard of $ reserves. It was the shutting down of their nuclear power generation after the earthquake that resulted in the increased energy imports which turned trade to deficit. Lower energy prices and a weaker yen have contributed to the reversal. At some point I expect circumstances to pressure the Ministry of Finance to resume yen sales to support their exporters.
Note too that both imports and exports have been declining, evidencing the general weakness in global demand:
Japan Balance of Trade 1963-2016
Japan recorded a 692.84 JPY billion surplus in June of 2016, compared to a 60.90 JPY billion surplus a year earlier and beating market consensus of a 494.8 JPY billion surplus, as exports fell less than imports. Year-on-year, sales dropped by 7.4 percent to 6,025.46, JPY billion in June, following a 11.3 percent fall in May, while markets expected a 11.6 percent decline. Imports decreased by 18.8 percent from a year earlier to 5,332.63 JPY billion, compared to a 13.8 percent decrease in a month earlier and above market estimates of a 19.7 percent drop. In May 2016, the country posted a 40.72 JPY billion trade deficit, the first gap since January. From January to June 2016, Japan posted a 1,810 JPY billion trade surplus, the first surplus since the second half-year of 2010.