
March 2015 Sea Container Counts Are Not Strong Even Though the Labor Troubles Are Over
By Steve Hansen
The West Coast Ports labor dispute is over, and appears the backlog has been eliminated causing a spike in exports. However, not only is year-to-date volumes contracting for both imports and exports – but March exports are contracting month-over-month and year-over-year. This is indicating weak economic conditions domestically and globally.
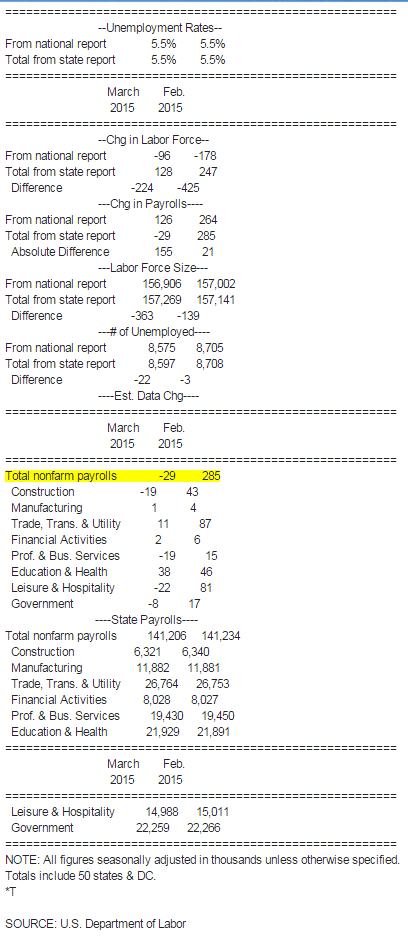
U.S. March Labor Force Comparison Statistics (Table)
By Chris Middleton
April 21 (Bloomberg) — Following is a comparison of U.S. labor force figures as reported in the national employment situation release and the monthly regional and state employment report. Total state figures are calculated by Bloomberg News.
Each state series is subject to larger sampling and nonsampling errors than the national series. Summing them compounds the state level errors and can cause significant distortions at the aggregate level. Due to these statistical limitations, the Bureau of Labor Statistics does not compile a “sum-of-states” employment series and cautions users that such a series is subject to a relatively large and volatile error structure.
Oil States See Slumping Employment as Texas Loses 25,000 Jobs in March
April 21 (WSJ) — While the U.S. economy continued to add jobs last month, states that rely heavily on the oil industry experienced significant cuts. Job losses hit particularly hard in Texas (down 25,400 jobs) and Oklahoma (down 12,900), leading the nation in losses. North Dakota lost 3,000 jobs, a significant cut in such a small state. All told, 31 states and Washington, D.C., saw a drop in employment in March, and only 18 states saw employment rising. The broad deterioration was a reversal from February, a month in which only 13 states saw decreases and 36 states and D.C. saw an increase.
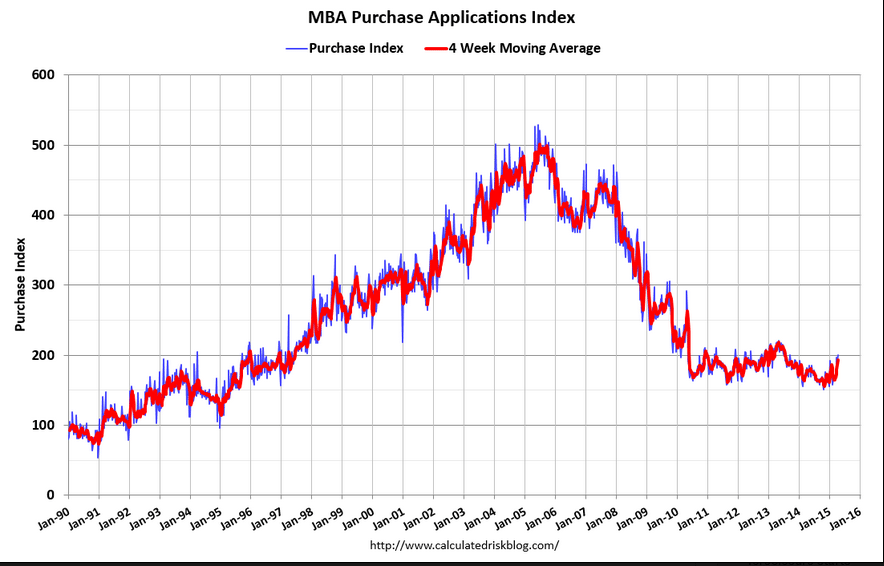
Purchase apps up some from still very depressed levels, but cash sales have been falling so total sales not necessarily higher.
And year over year up but last year’s sales were even more depressed by the exceptionally cold winter.
MBA Mortgage Applications
Highlights
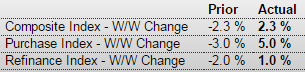
Mortgage applications for home purchases have definitely been showing life this spring, up 5.0 percent in the April 17 week. This is the 4th increase in 5 weeks. Helping purchase demand are low rates, down 4 basis points in the week to an average 3.83 percent for conforming loan balances ($417,000 or less). Low rates, however, aren’t doing much to stimulate refinancing demand with this index up only 1.0 percent in the week. Watch for existing home sales later this morning at 10:00 a.m. ET.
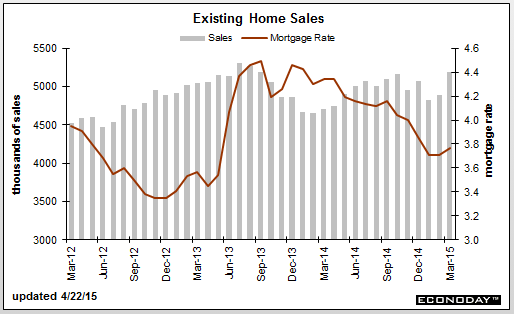
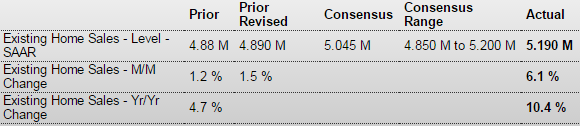
Up a bit more than expected, but still depressed as well. And few distressed sales raise the median price so a ‘quality adjusted’ price would be more informative. And with the last slowdown coincident with a rate spike maybe the Fed isn’t ready to risk that again?
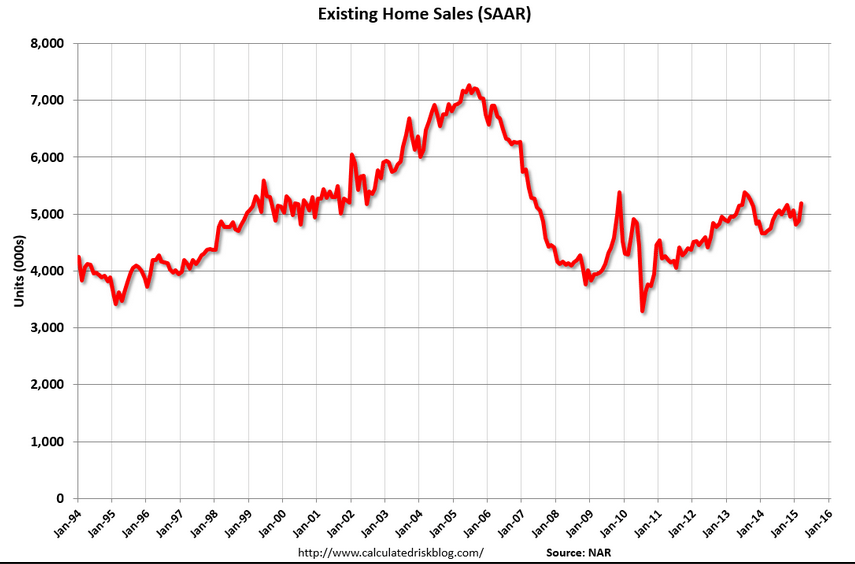
Existing Home Sales
Highlights
This winter’s heavy weather may very well have held down the housing market which appears to be heading into the spring with new momentum. Existing home sales surged 6.1 percent in March to a 5.190 million annual rate. This is near high-end expectations and the best rate since September 2013. In percentage terms, the 6.1 percent gain is the strongest since December 2010 and among the very highest in the 16-year history of the series.
Sales of single-family homes jumped 5.5 percent in the month to a 4.590 million rate while condos really jumped, up 11.1 percent to a 600,000 rate. All regions show solid gains in total sales led by the Midwest at 10.1 percent with the South at the rear, though still up a solid 3.8 percent.
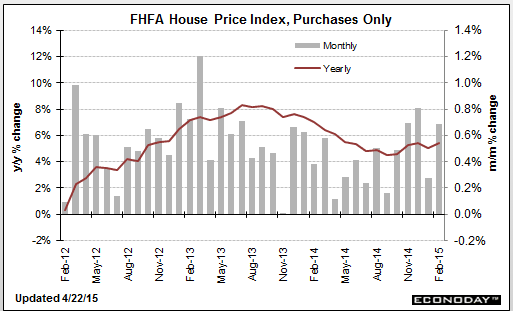
Price data all show strength with the median price up a very strong 5.1 percent to $212,100. Year-on-year, the median is up 7.8 percent for the best reading since February last year. This is a bit below the year-on-year sales rate of 10.4 percent which hints at further pricing power ahead.
Again, I’d like to see what this looks like excluding distressed sales:
Bank of Japan to cut fiscal 2015 inflation forecast
April 1 (Nikkei) — The Bank of Japan is considering lowering its 1% inflation forecast for fiscal 2015 amid the continued slump in oil prices and a slow recovery in domestic consumption.