(not saying that any of this is in the Fed’s reaction function- that’s another story)
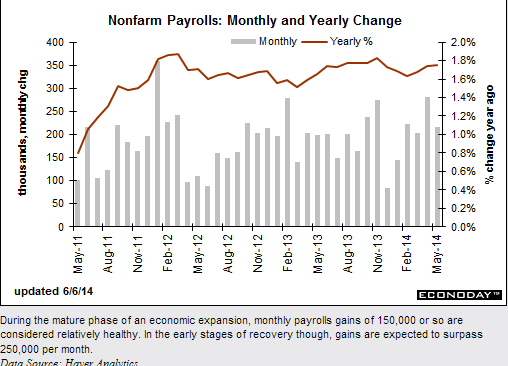
See the ‘down, up some, then leveling off of the red line?
Still growing but ‘leveled off’ at a bit less than 1.8%.
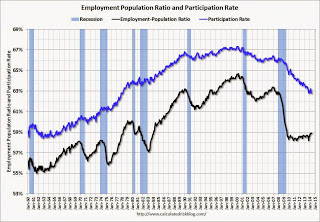
Employment/population ratio collapsed from 2008-2010 and for
all practical purposes has never recovered, and the participation rate
remains at the lows as well:
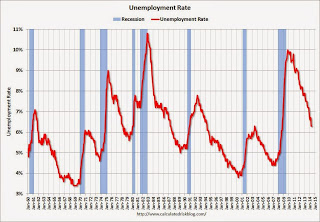
And the unemployment rate is now down to the peak of the last cycle!
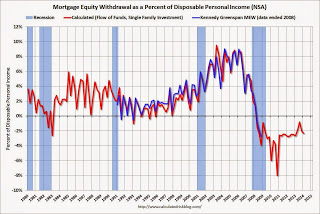
Mortgage Equity Withdrawal still a bit negative:
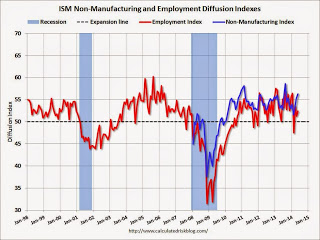
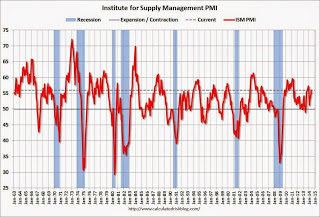
Nice move up for the ISM survey
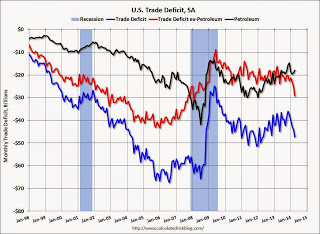
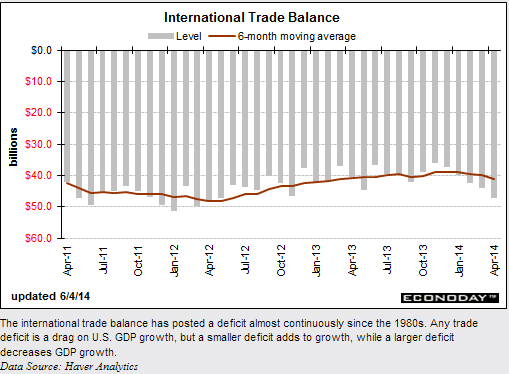
The trade deficit seems to be ticking up a bit, meaning that much less GDP, but it’s volatile month to month:
Motor vehicle sales were up and better than expected, but with the winter dip and the subsequent recovery are still averaging a bit less than 16 million for the year. And the longer term pattern looks like the rate of growth flattened some early in 2013. And inventories are still elevated, though not as much as earlier in the year.
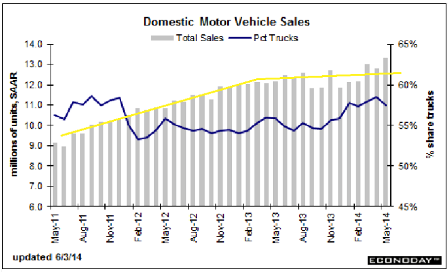
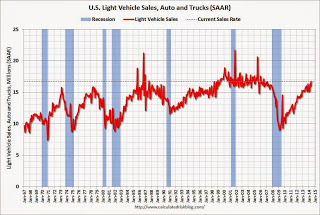
We’ll see what comes next:
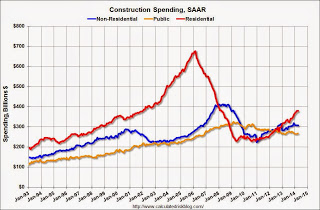
Construction spend was below expectations but chart does’t look too bad:
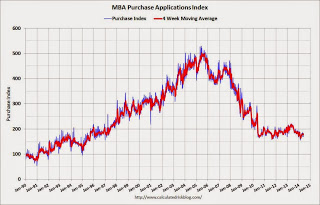
Mtg purchase apps remain depressed, coming in at about 17% below last year: