
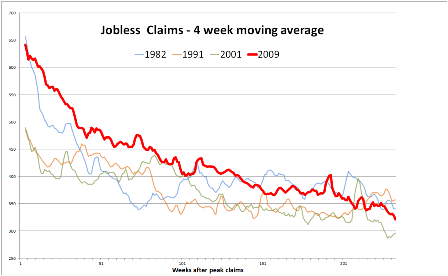
So I have this theory that claims have more to do with time since the peak than with the ‘robustness’ of the recovery.
Claims come from separations, so after economies stop getting worse they ‘quiet down’ over time with regards to jobs lost, even though there may or may not be a lot of ‘new hires’ and expansion, etc.
The chart isn’t adjusted for population, or the size of the labor force, as I’m mainly interested in ‘shape’.
And this can at least partially explain why claims have come down nicely and continue to fall some even as new hires aren’t doing all that well.
Full size image