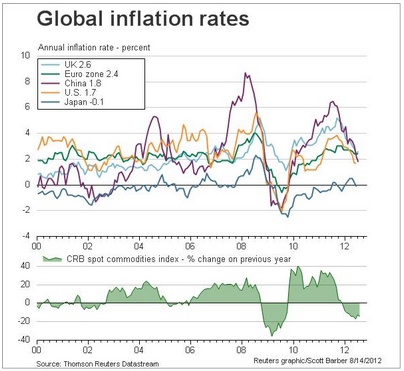
Global inflation rates
Posted by WARREN MOSLER on August 14th, 2012
Interesting chart.
The way we define ‘inflation’ seems to be largely based on ‘cost plus’ pricing, seems?

Posted by WARREN MOSLER on August 14th, 2012
Interesting chart.
The way we define ‘inflation’ seems to be largely based on ‘cost plus’ pricing, seems?

August 14th, 2012 at 9:59 pm
Why does inflation in the UK persist above the levels seen in other developed economies?
Reply
Cesar Reply:
August 15th, 2012 at 9:40 am
@FerdinandAlx,
good question – be interested to hear any MMT’ers input on that?
Reply
Paul Palmer Reply:
August 15th, 2012 at 9:55 am
@FerdinandAlx,
Looks like only a recent thing, pre-’08 it was below. My bet would be it’s tied to oil price.
Reply
y Reply:
August 15th, 2012 at 12:45 pm
uk has a big trade deficit, plus a large population for such a small piece of land (i.e. it’s dependent on imports of basics such as food).
Eurozone has a balanced current account overall. US has a mighty current account deficit but has the dollar and is not dependent on food imports.
Reply
Neil Wilson Reply:
August 15th, 2012 at 1:38 pm
@y,
Trade deficit has little to do with it. Food contributes 0.25% of the 12 month figure.
Gas, electricity and rent is 0.5% and restaurants and hotels is 0.4%.
And underlying most of that are monopoly rents – largely land.
The UK is no longer a nation of shopkeepers, but a nation of landlords. The shopkeepers can no longer afford the rent.
It’s the small bit of land owned by a few Barons and rented to the rest that’s the problem.
Amusingly it’s always been like that, and I suspect we’ll celebrate the 800th anniversary of the Magna Carta with it still being like that.
y Reply:
August 15th, 2012 at 2:36 pm
ah, I see.
What’s the reason for the 2008/’09 and 2011 ‘spikes’ in inflation?
Neil Wilson Reply:
August 15th, 2012 at 5:34 pm
@y,
Supply side push through on oil and power prices – from the return of the value of the pound to mid 1990s relative valuations after the crash. Producer inflation was massive and it took ages to feed through to price hikes at the consumer end.
The UK had a 10 year currency valuation bubble that ended up turning a load of our factories into lousy box cupboards for people to live in. That’s what ‘strong currency’ policies do to your economy.
Cesar Reply:
August 15th, 2012 at 5:55 pm
@y, the 2011 spike was VAT related I thought – Treasury upped vat so it spiked the inflation data for one year.
y Reply:
August 15th, 2012 at 5:59 pm
“That’s what ‘strong currency’ policies do to your economy.”
What about Switzerland?
August 15th, 2012 at 12:58 pm
Warren: would you expand on your comment? Connection isn’t obvious to me. Thx.
Reply