I still don’t see used home prices anywhere near ‘replacement cost?’
So prices have to go up quite a bit (and affordability go down) for a serious building boom to start?
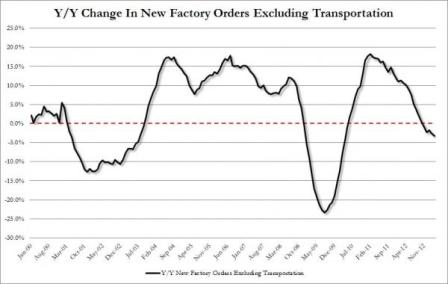
Even as U.S. housing rebounds from its worst downturn since the 1930s, production bottlenecks are pushing up building-materials costs, land prices are rising and skilled labor ready to begin work is hard to find.
Housing Rebound in U.S. Hampered by Success as Costs Soar
By Shobhana Chandra & John Gittelsohn
April 24 (Bloomberg) — Even as U.S. housing rebounds from its worst downturn since the 1930s, production bottlenecks are pushing up building-materials costs, land prices are rising and skilled labor ready to begin work is hard to find.
Suppliers of glass, drywall and wood products, who reduced output during the slump, are testing the vigor of the rebound by boosting prices before committing to restore capacity. Builders, including Lennar Corp. (LEN), Toll Brothers Inc. (TOL) and KB Home, are asking homebuyers for more money as a result or are delaying sales, posing a temporary hurdle for the industry that has become one of the pillars of the economic expansion.
Building-material manufacturers are raising prices dramatically, and once theyre convinced that these prices are going to stick, theyll start reinvesting in those plants, helping ease supply constraints, said John Burns, chairman of Irvine, California-based John Burns Real Estate Consulting, which provides research to developers, construction-product manufacturers and investors. Those can take a year to get up and running.
In a sign demand remains strong, a report yesterday showed sales of new houses advanced in March, capping the best quarter for the industry since 2008. Purchases of new single-family properties climbed 1.5 percent to a 417,000 annual pace, the Commerce Department said.