2009-04-15 USER


[Skip to the end]


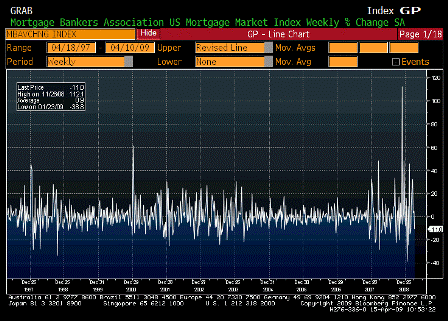
MBA Mortgage Applications (Apr 10)

Survey n/a
Actual -11.0%
Prior 4.7%
Revised n/a

[top][end]

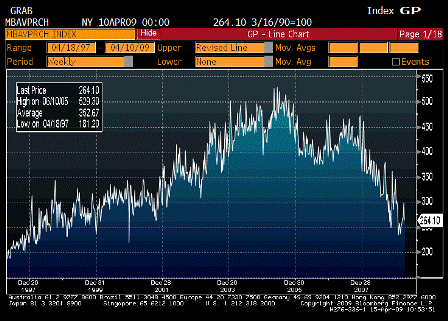
MBA Purchasing Applications (Apr 10)

Survey n/a
Actual 264.10
Prior 297.70
Revised n/a

[top][end]

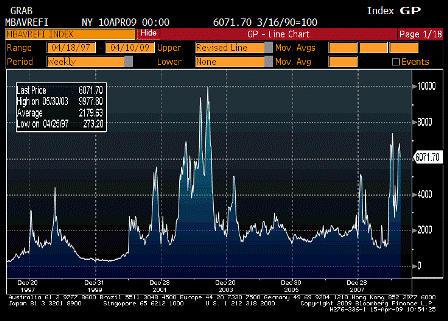
MBA Refinancing Applications (Apr 10)

Survey n/a
Actual 6071.70
Prior 6813.50
Revised n/a

[top][end]


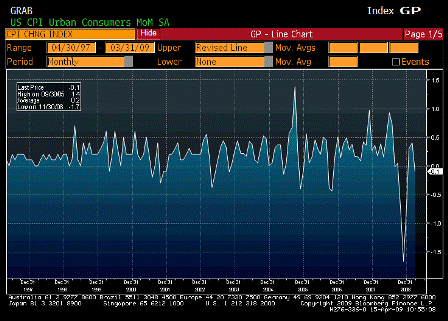
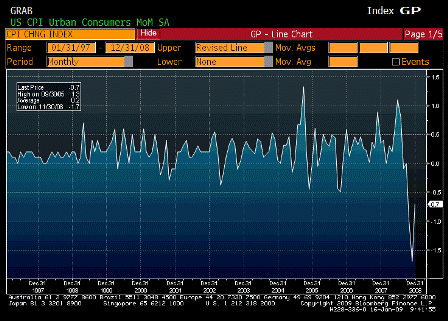
Consumer Price Index MoM (Mar )

Survey 0.1%
Actual -0.1%
Prior 0.4%
Revised n/a

[top][end]

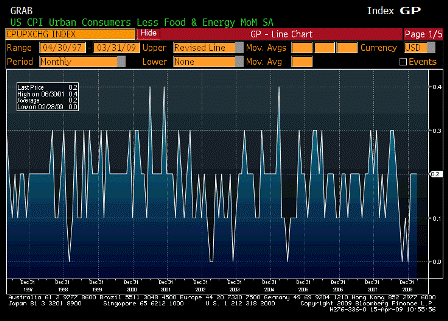
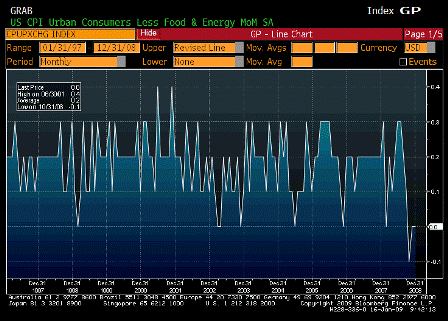
CPI Ex Food and Energy MoM (Mar)

Survey 0.1%
Actual 0.2%
Prior 0.2%
Revised n/a

[top][end]

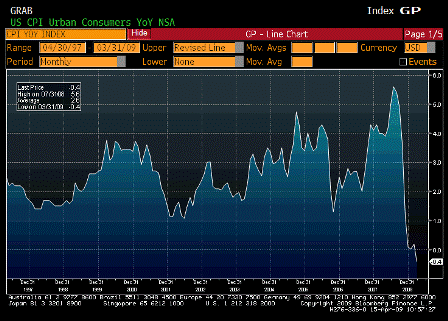
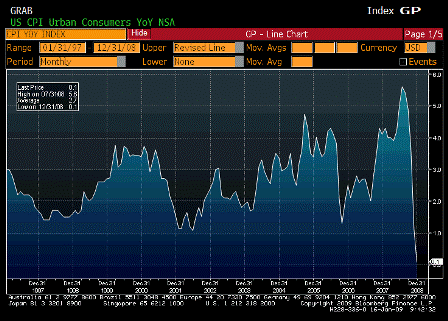
Consumer Price Index YoY (Mar)

Survey -0.1%
Actual -0.4%
Prior 0.2%
Revised n/a

[top][end]

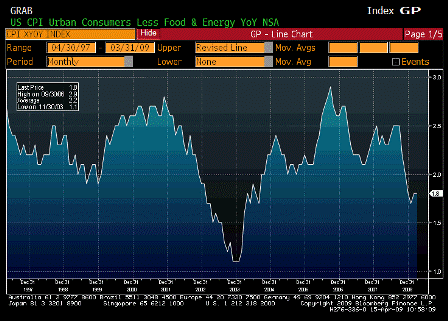
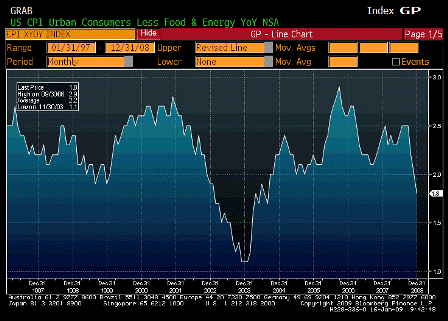
CPI Ex Food and Energy YoY (Mar)

Survey 1.7%
Actual 1.8%
Prior 1.8%
Revised n/a

[top][end]

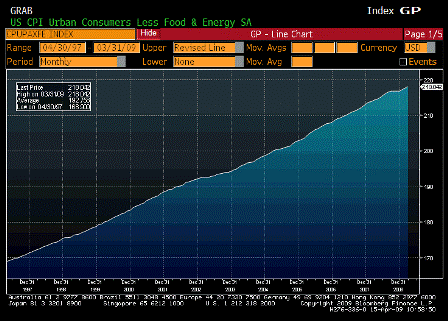
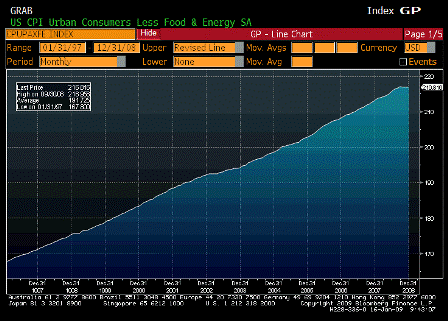
CPI Core Index SA (Mar)

Survey n/a
Actual 218.042
Prior 217.670
Revised n/a

[top][end]

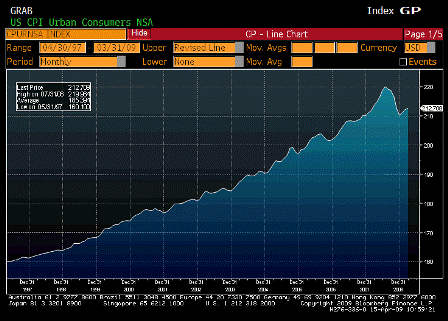
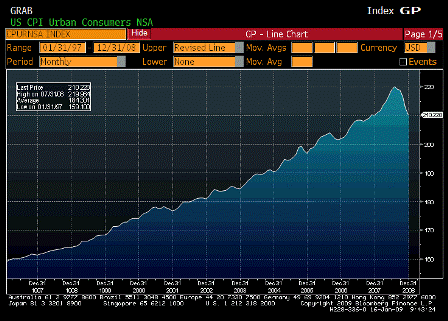
Consumer Price Index NSA (Mar)

Survey 212.900
Actual 212.709
Prior 212.193
Revised n/a

[top][end]


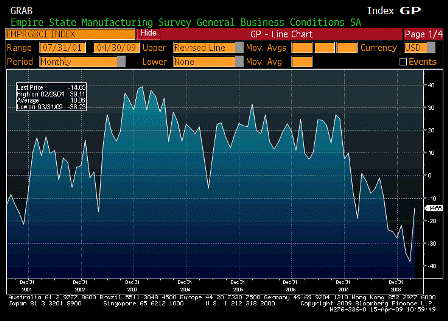
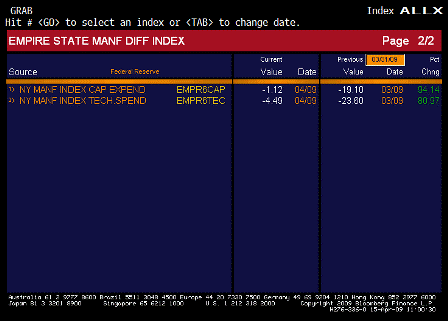
Empire State Manufacturing Survey (Apr)

Survey -35.00
Actual -14.65
Prior -38.23
Revised n/a

[top][end]

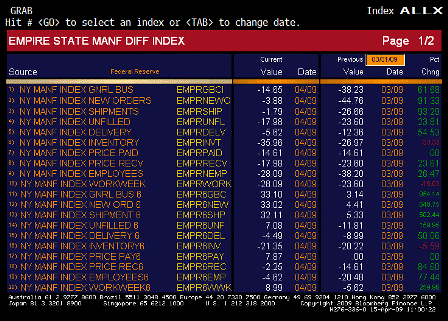
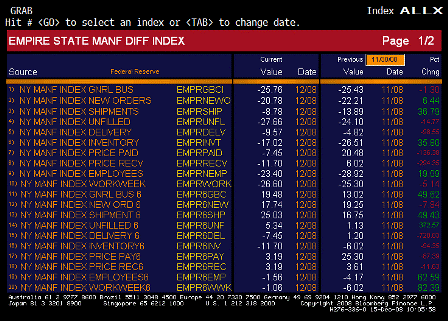
Empire State Manufacturing Survey ALLX 1 (Apr)
[top][end]

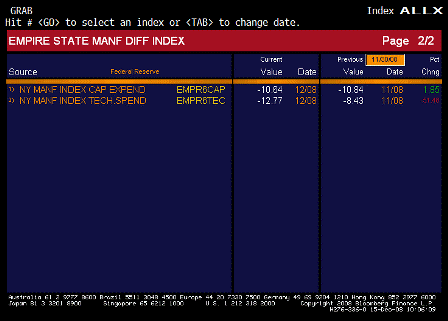
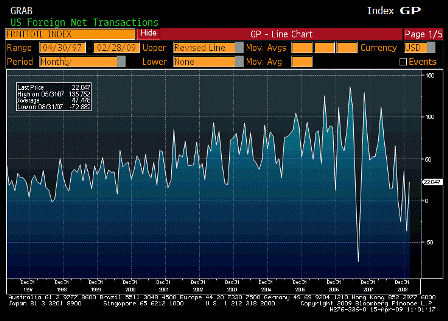
Empire State Manufacturing Survey ALLX 2 (Apr)
[top][end]


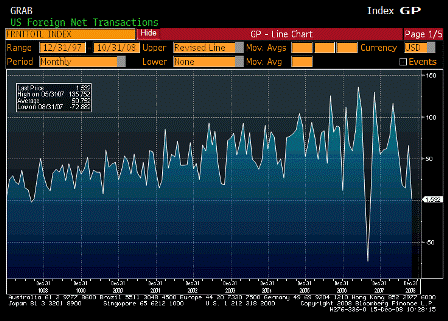
Net Long Term TIC Flows (Feb)

Survey $14.0B
Actual $22.0B
Prior -$43.0B
Revised -$36.8B

[top][end]

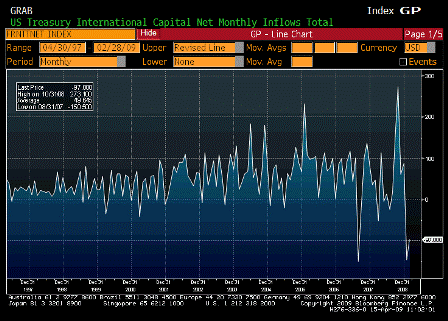
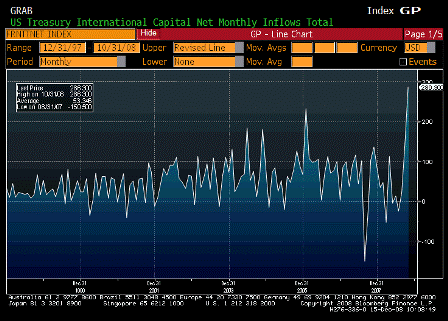
Total Net TIC Flows (Feb)

Survey n/a
Actual -$97.0B
Prior -$148.9B
Revised -$146.8B

[top][end]


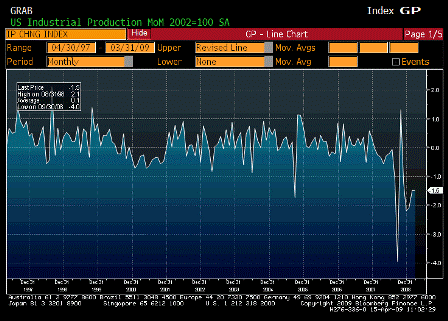
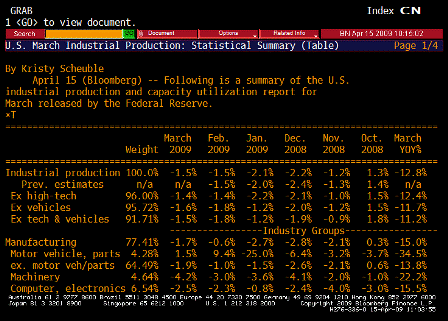
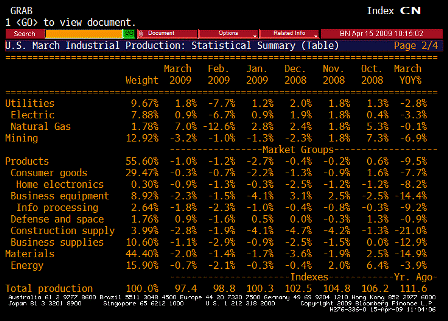
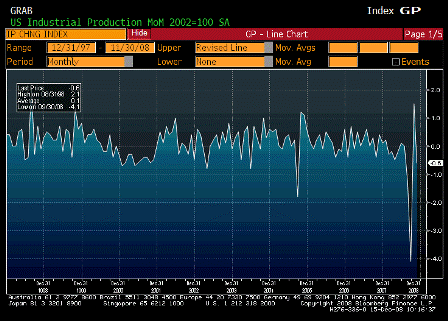
Industrial Production MoM (Mar)

Survey -0.9%
Actual -1.5%
Prior -1.4%
Revised -1.5%

[top][end]

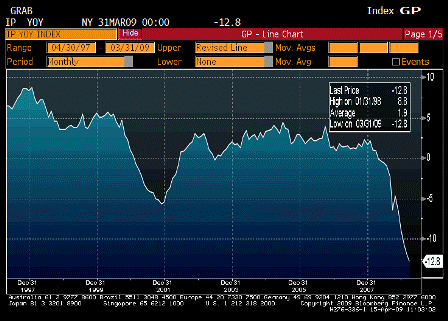
Industrial Production YoY (Mar)

Survey n/a
Actual -12.8%
Prior -11.8%
Revised n/a

[top][end]


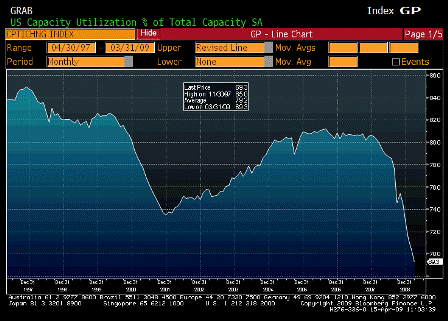
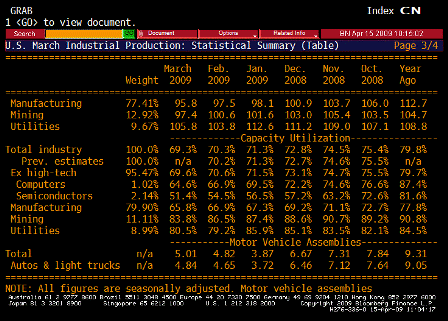
Capacity Utilization (Mar)

Survey 69.6%
Actual 69.3%
Prior 70.9%
Revised 70.3%

[top][end]

Capacity Utilization TABLE 1 (Mar)

[top][end]

Capacity Utilization TABLE 2 (Mar)

[top][end]

Capacity Utilization TABLE 3 (Mar)

[top][end]


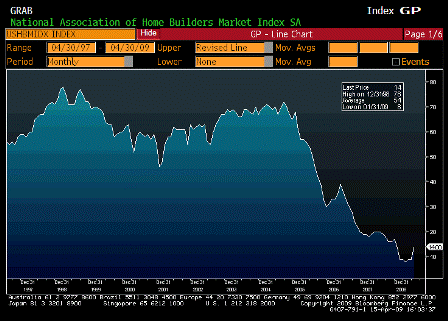
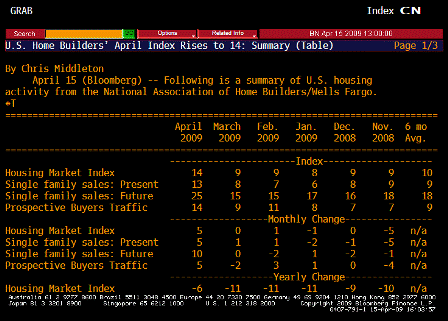
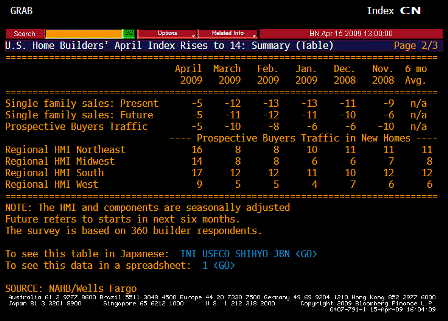
NAHB Housing Market Index (Apr)

Survey 10
Actual 14
Prior 9
Revised n/a

[top][end]

NAHB Housing Market Index TABLE 1 (Mar)
[top][end]

NAHB Housing Market Index TABLE 2 (Mar)


[top]

2009-01-16 USER


[Skip to the end]


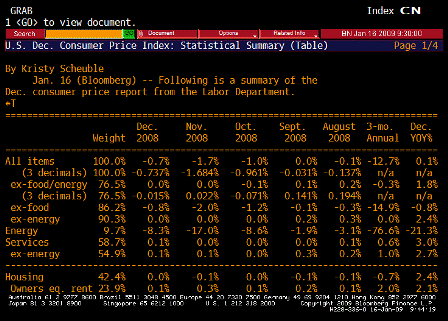
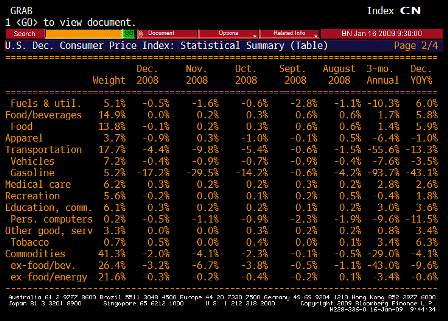
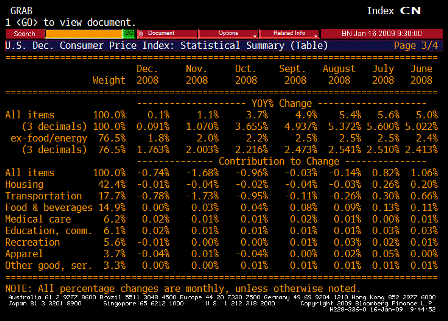
Consumer Price Index MoM (Dec)

Survey -0.9%
Actual -0.7%
Prior -1.7%
Revised n/a

[top][end]

CPI Ex Food and Energy MoM (Dec)

Survey 0.1%
Actual 0.0%
Prior 0.0%
Revised n/a

[top][end]

Consumer Price Index YoY (Dec)

Survey -0.2%
Actual 0.1%
Prior 1.1%
Revised n/a

[top][end]

CPI Ex Food and Energy YoY (Dec)

Survey 1.8%
Actual 1.8%
Prior 2.0%
Revised n/a

[top][end]

CPI Core Index SA (Dec)

Survey n/a
Actual 216.816
Prior 216.849
Revised n/a

[top][end]

Consumer Price Index NSA (Dec)

Survey 210.210
Actual 210.228
Prior 212.425
Revised n/a

[top][end]

Consumer Price Index TABLE 1 (Dec)

[top][end]

Consumer Price Index TABLE 2 (Dec)

[top][end]

Consumer Price Index TABLE 3 (Dec)

[top][end]


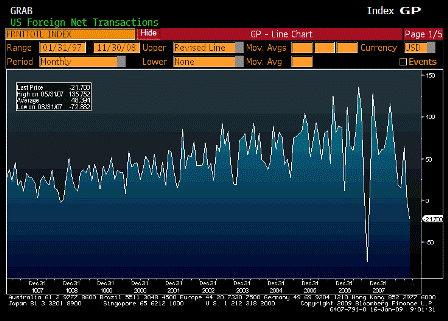
Net Long Term TIC Flows (Nov)

Survey $15.0B
Actual -$21.7B
Prior $1.5B
Revised -$0.4B

[top][end]

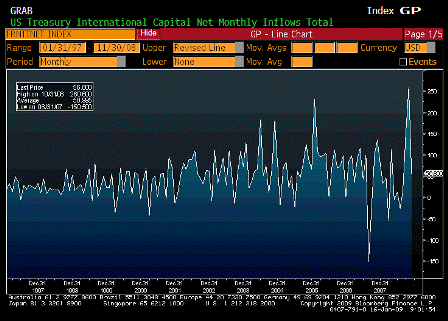
Total Net TIC Flows (Nov)

Survey n/a
Actual $56.8B
Prior $286.3B
Revised $260.6B

[top][end]


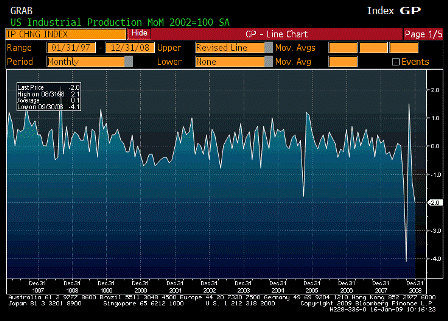
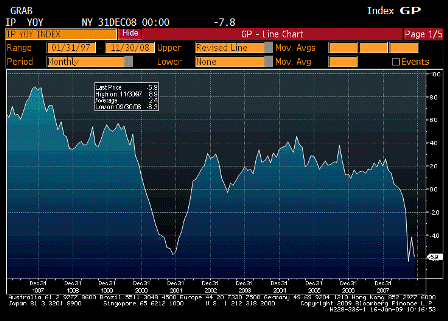
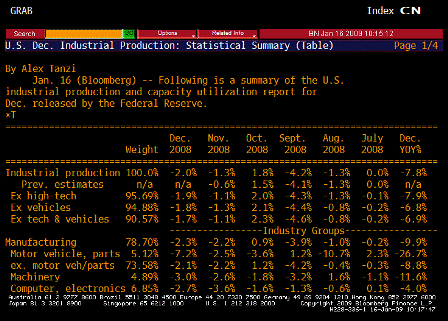
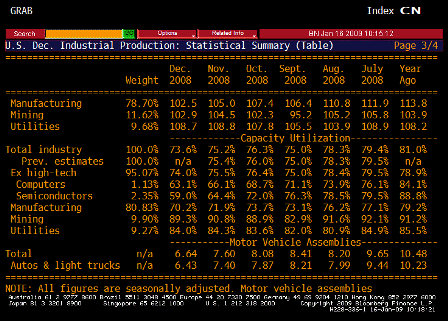
Industrial Production MoM (Dec)

Survey -1.0%
Actual -2.0%
Prior -0.6%
Revised -1.3%

[top][end]

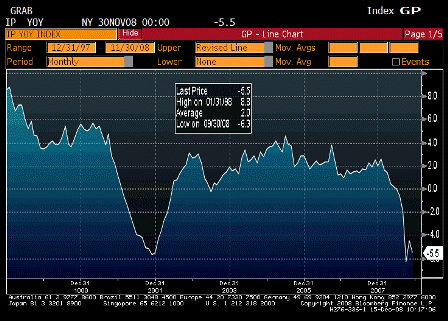
Industrial Production YoY (Dec)

Survey n/a
Actual -5.5%
Prior -4.5%
Revised n/a

[top][end]

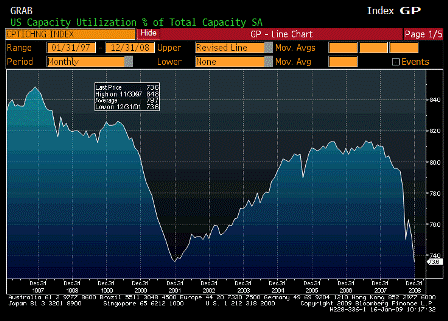
Capacity Utilization (Dec)

Survey 74.5%
Actual 73.6%
Prior 75.4%
Revised 75.2%

[top][end]

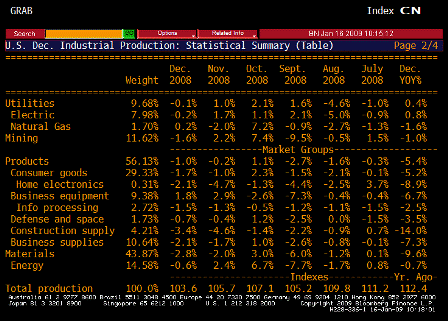
Capacity Utilization TABLE 1 (Dec)

[top][end]

Capacity Utilization TABLE 2 (Dec)

[top][end]

Capacity Utilization TABLE 3 (Dec)

[top][end]


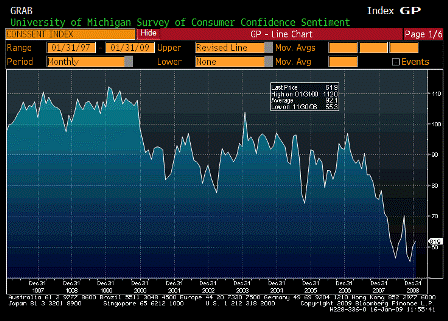
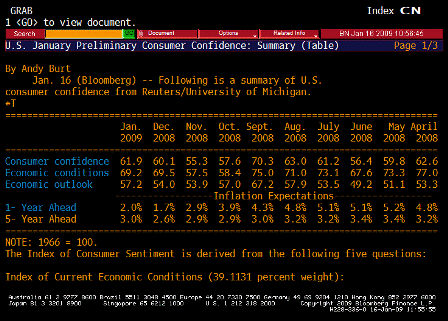
U of Michigan Confidence (Jan P)

Survey 59.0
Actual 61.9
Prior 60.1
Revised n/a

[top][end]

U of Michigan TABLE Inflation Expectations (Jan P )


[top]
2008-12-15 USER


[Skip to the end]


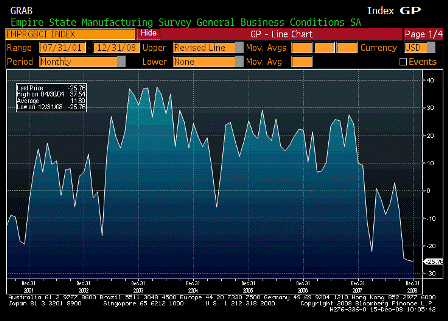
Empire State Manufacturing Survey (Dec)

Survey -28.00
Actual -25.76
Prior -25.43
Revised n/a

[top][end]

Empire State Manufacturing Survey ALLX 1 (Dec)

[top][end]

Empire State Manufacturing Survey ALLX 2 (Dec)

[top][end]

Net Long Term TIC Flows (Oct)

Survey $40.0B
Actual $1.5B
Prior $66.2B
Revised $65.4B

[top][end]

Total Net TIC Flows (Oct)

Survey n/a
Actual $286.3B
Prior $143.4B
Revised $142.6B

[top][end]

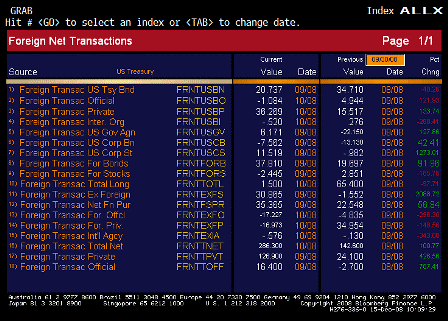
TIC ALLX (Oct)

[top][end]

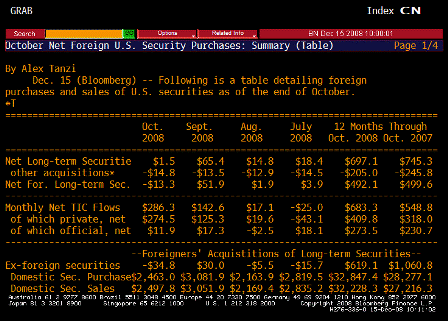
TIC TABLE 1 (Oct)

[top][end]

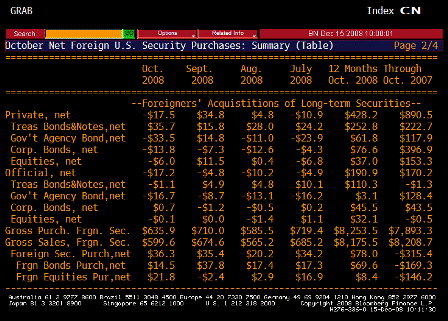
TIC TABLE 2 (Oct)

[top][end]

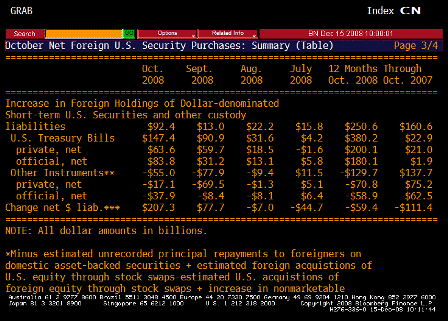
TIC TABLE 3 (Oct)

[top][end]

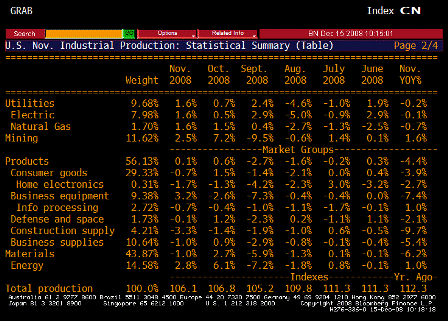
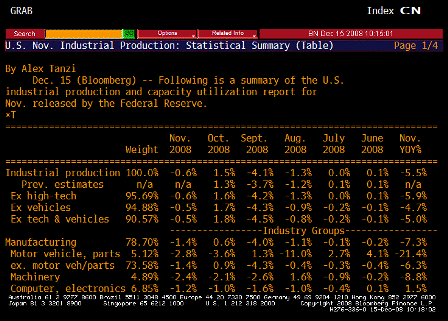
Industrial Production MoM (Nov)

Survey -0.8%
Actual -0.6%
Prior 1.3%
Revised 1.5%

[top][end]

Industrial Production YoY (Nov)

Survey n/a
Actual -5.5%
Prior -4.5%
Revised n/a

[top][end]

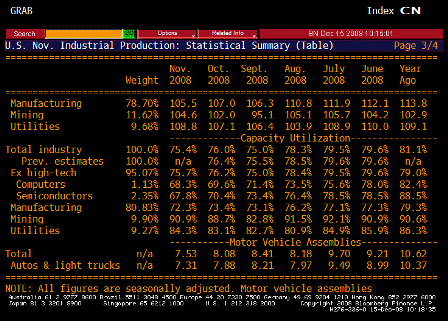
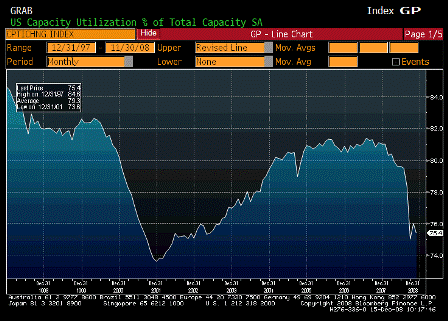
Capacity Utilization (Nov)

Survey 75.6%
Actual 75.4%
Prior 76.4%
Revised 76.0%

[top][end]

Capacity Utilization TABLE 1 (Nov)

[top][end]

Capacity Utilization TABLE 2 (Nov)

[top][end]

Capacity Utilization TABLE 3 (Nov)


[top]
2008-06-16 US Economic Releases


[Skip to the end]


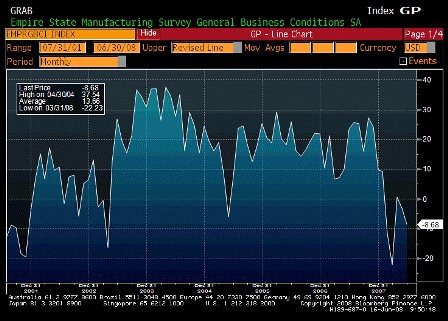
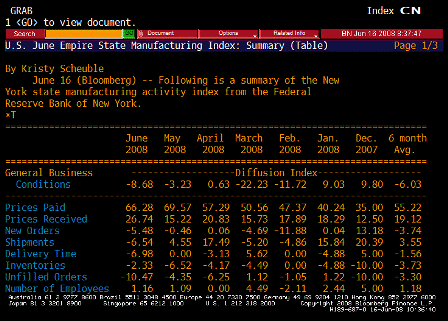
Empire Manufacturing (Jun)

Survey -2.0
Actual -8.7
Prior -3.2
Revised n/a

Empire Manufacturing TABLE (Jun)

Looks like the worst is over, but the economy remains on the weak side.

Prices paid still way high.

Looks like number of employees up as well.

[top][end]


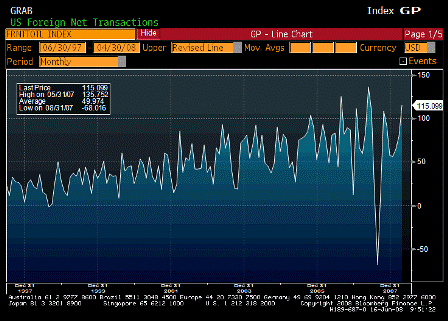
Net Long-term TIC Flows (Apr)

Survey $63.3B
Actual $115.1B
Prior $80.4B
Revised $79.6B

[top][end]

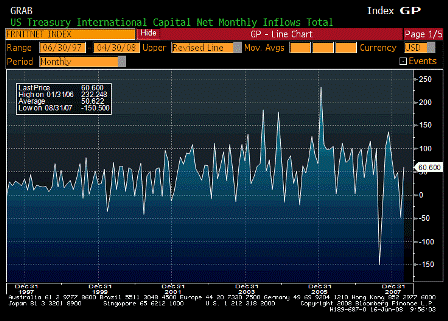
Total Net TIC Flows (Apr)

Survey $42.5B
Actual $60.6B
Prior -$48.2B
Revised $79.6B

[top][end]

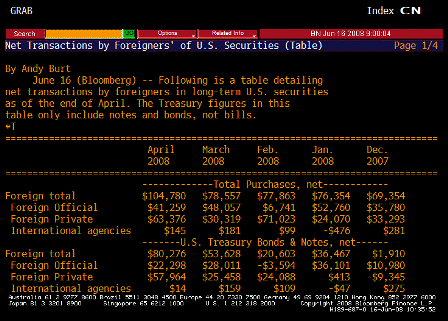
TIC TABLE (Apr)

[top][end]


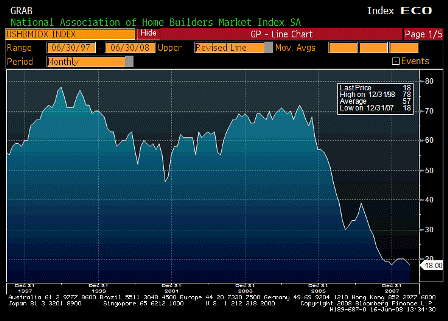
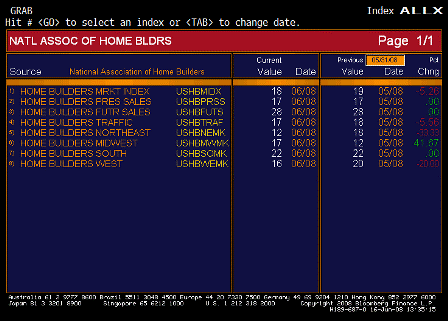
NAHB Housing Market Index (Jun)

Survey 19
Actual 18
Prior 19
Revised n/a

A bit worse than expected. Confidence is down all over due to food/crude/import prices. Might be the case here.

[top][end]

NAHB Housing Market Index (Jun)


[top]
2008-05-15 US Economic Releases


[Skip to the end]


2008-05-15 Initial Jobless Claims

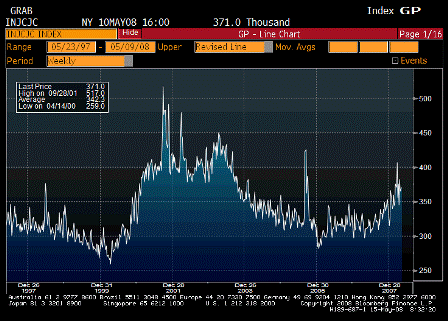
Initial Jobless Claims (May 10)

Survey 370K
Actual 371K
Prior 365K
Revised n/a

Looks like it’s past the peak.

[top][end]


2008-05-15 Continuing Claims

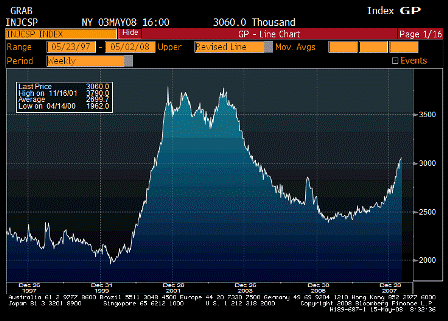
Continuing Claims (May 3)

Survey 3035K
Actual 3060K
Prior 3020K
Revised 3032K

Looks like it’s not past the peak.

[top][end]


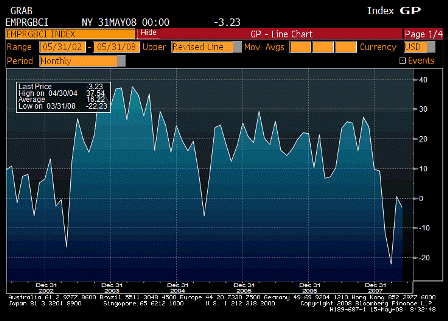
2008-05-15 Empire Manufacturing

Empire Manufacturing (May)

Survey 0.0
Actual -3.2
Prior 0.6
Revised n/a

Still off the bottom, needs another month to see where it’s going.

[top][end]


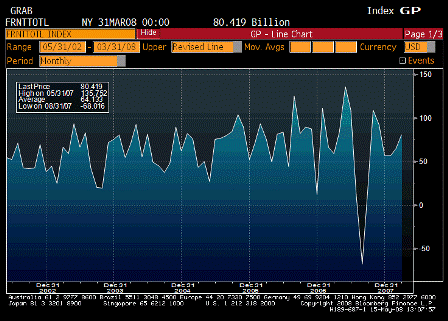
2008-05-15 Net Long-term TIC Flows

Net Long-term TIC Flows (Mar)

Survey $62.5B
Actual $80.4B
Prior $72.5B
Revised $64.9B

[top][end]


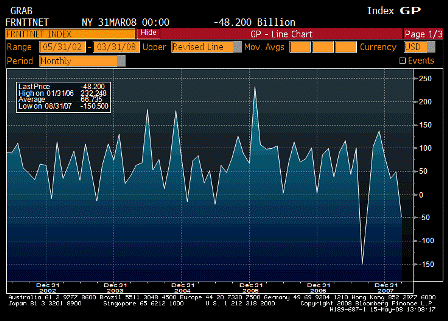
2008-05-15 Total Net TIC Flows

Total Net TIC Flows (Mar)

Survey $67.5B
Actual -$48.2B
Prior $64.1B
Revised $48.9B

In general I expect these types of numbers to follow the trade gap down.

[top][end]


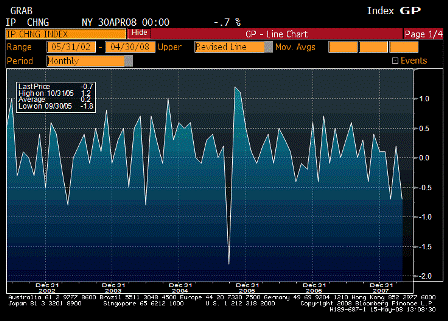
2008-05-15 Industrial Production

Industrial Production (Apr)

Survey -0.3%
Actual -0.7%
Prior 0.3%
Revised 0.2%

Still weak. Been weak for 50 years.

[top][end]


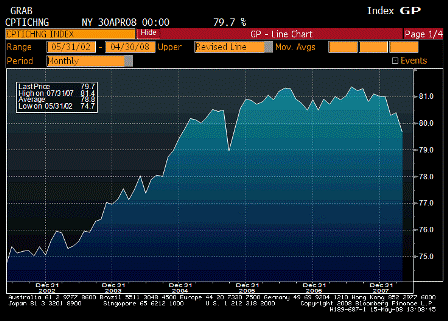
2008-05-15 Capacity Utilization

Capacity Utilization (Apr)

Survey 80.1%
Actual 79.7%
Prior 80.5%
Revised 80.4%

Weak, but not recession levels yet.

[top][end]


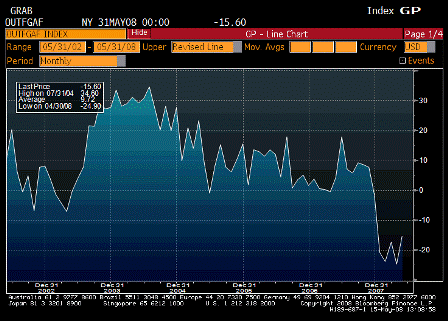
2008-05-15 Philadelphia Fed.

Philadelphia Fed. (May)

Survey -19.0
Actual -15.6
Prior -24.9
Revised n/a

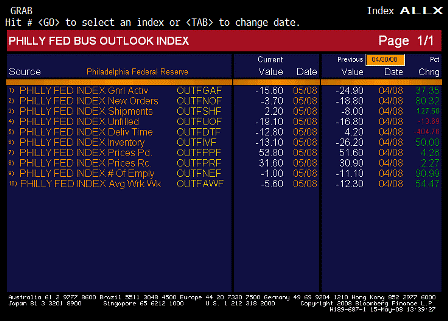
2008-05-15 Philadelphia Fed. TABLE

Philadelphia Fed. TABLE

Perking up from low levels,
prices high and moving higher

[top][end]


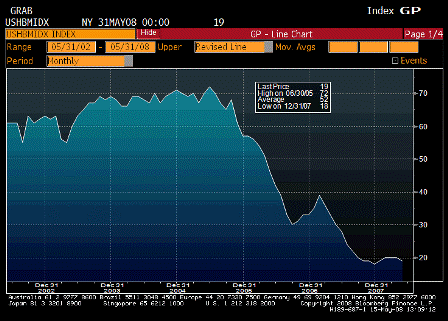
2008-05-15 NAHB Housing Market Index

NAHB Housing Market Index (May)

Survey 20
Actual 19
Prior 20
Revised n/a

Still off the lows and looking like a bottom to me.


[top]