2008-09-30 USER


[Skip to the end]


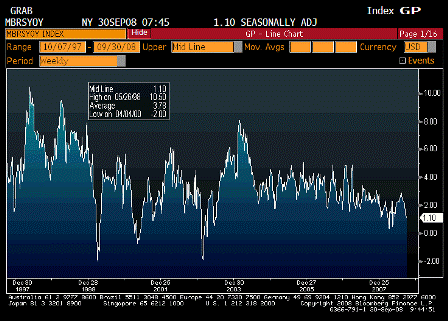
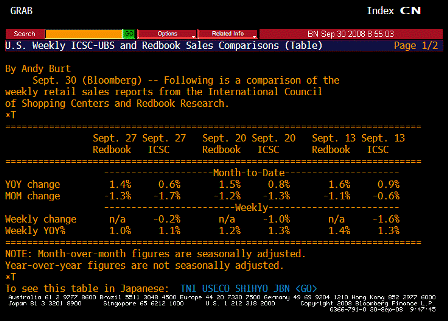
ICSC UBS Store Sales YoY (Sep 30)

Survey n/a
Actual 1.10%
Prior 1.30%
Revised n/a

 
Still positive but weak.

[top][end]

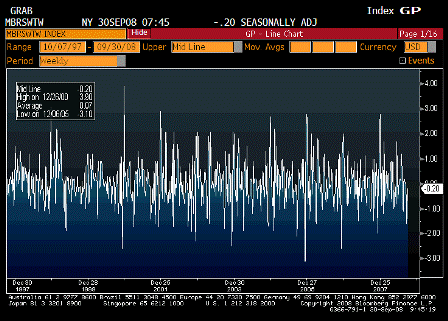
ICSC UBS Store Sales WoW (Sep 30)

Survey n/a
Actual -0.20%
Prior -1.00%
Revised n/a

[top][end]

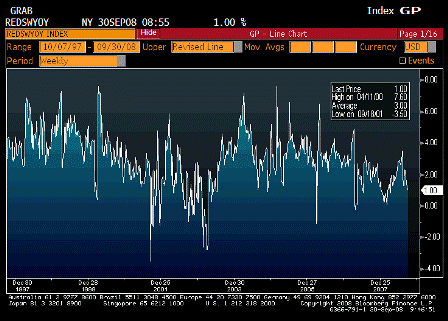
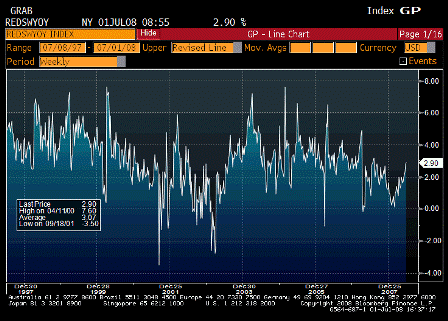
Redbook Store Sales Weekly YoY (Sep 30)

Survey n/a
Actual 1.00%
Prior 1.20%
Revised n/a

 
Still positive but weak.

[top][end]

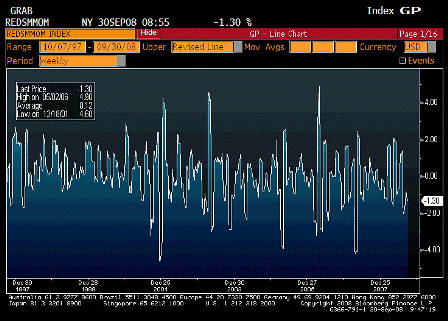
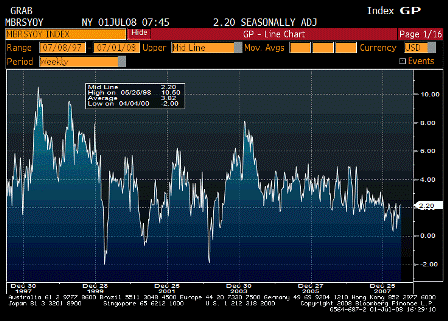
Redbook Store Sales MoM (Sep 30)

Survey n/a
Actual -1.30%
Prior -1.20%
Revised n/a

[top][end]

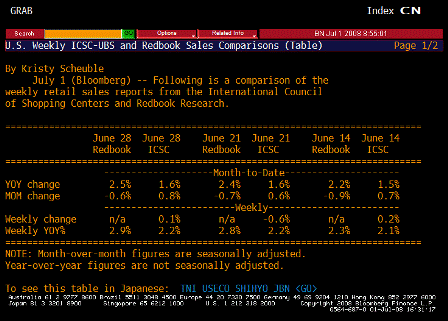
ICSC UBS Redbook Comparison TABLE (Sep 30)
[top][end]


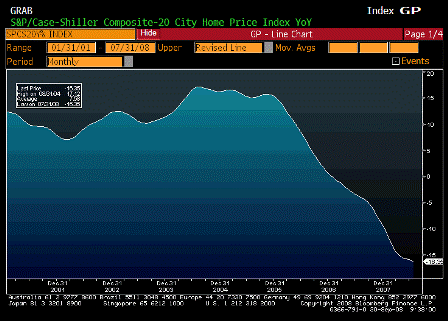
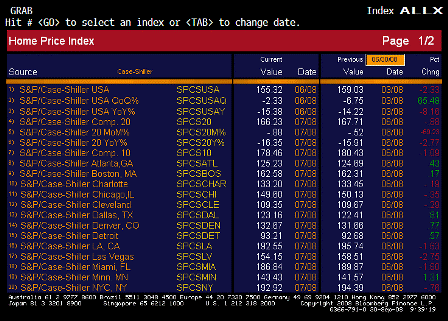
S&P CS Composite 20 YoY (Jul)

Survey -16.00%
Actual -16.35%
Prior -15.92%
Revised -15.91%

 
Down year over year, but the rate of decline has slowed.
[top][end]

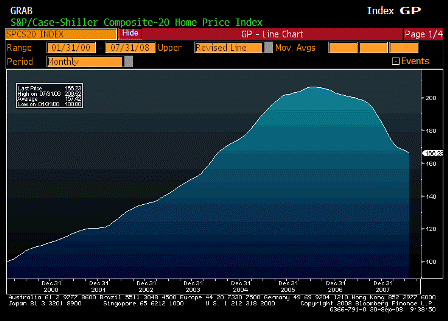
S&P Case Shiller Home Price Index (Jul)

Survey 166.90
Actual 166.23
Prior 167.69
Revised 167.71

 
Decelerating rate of decline.

[top][end]

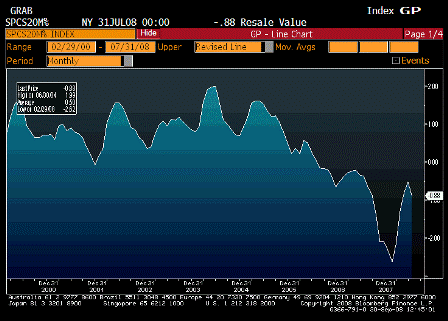
S&P Case Shiller Home Price Index MoM (Jul)

Survey n/a
Actual -0.88%
Prior -0.52%
Revised n/a

 
From this angle it looks like the declines have moderated and could soon be over as inventories shrink and incomes continue higher.
[top][end]

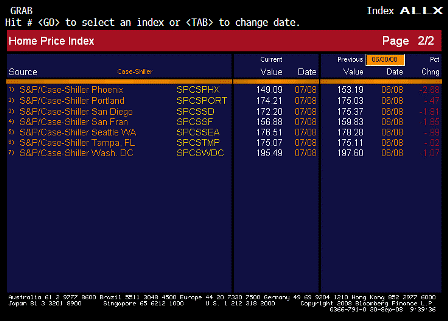
Case Shiller ALLX 1 (Jul)

[top][end]

Case Shiller ALLX 2 (Jul)

[top][end]


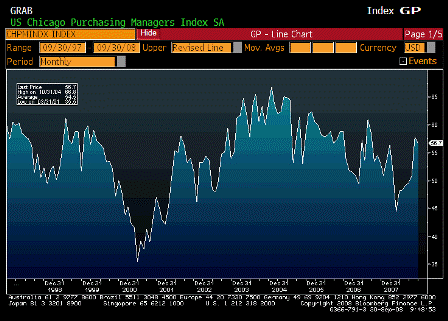
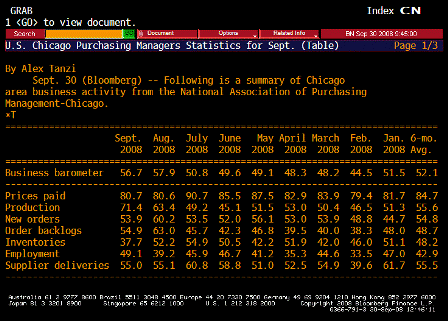
Chicago Purchasing Manager (Sep)

Survey 53.0
Actual 56.7
Prior 57.9
Revised n/a

 
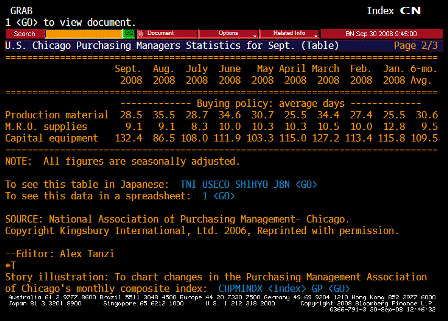
Better than expected and remaining above 50. Employment moved up to 49.
[top][end]

Chicago Purchasing Manager TABLE 1 (Sep)

 
Employment gapped up to 49?
[top][end]

Chicago Purchasing Manager TABLE 2 (Sep)
[top][end]


NAPM-Milwaukee (Sep)

Survey 44.0
Actual 46.0
Prior 43.0
Revised n/a

 
Better than expected and working its way out of the hole.
[top][end]


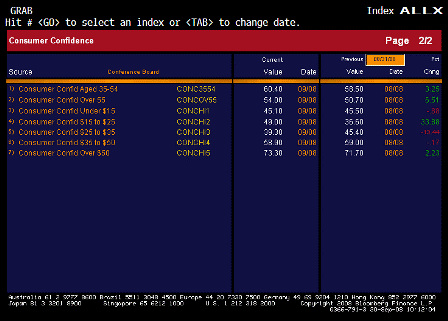
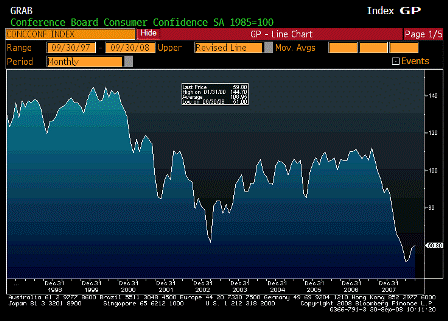
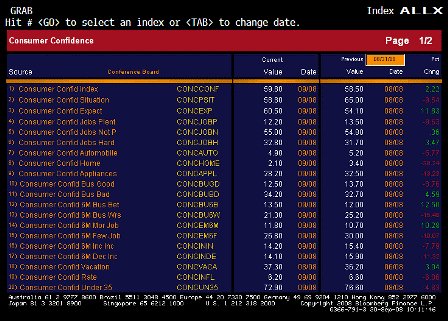
Consumer Confidence (Sep)

Survey 55.0
Actual 59.8
Prior 56.9
Revised 58.5

 
Even this is moving up some though from very low levels, and as of September 23.
[top][end]

Consumer Confidence ALLX 1 (Sep)

[top][end]

Consumer Confidence ALLX 2 (Sep)


[top]

2008-09-16 USER


[Skip to the end]


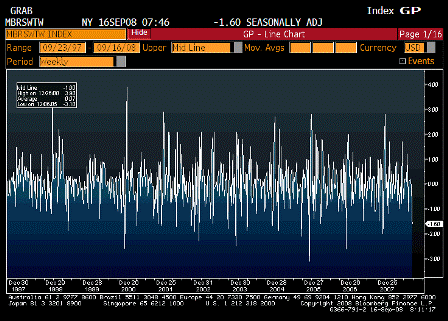
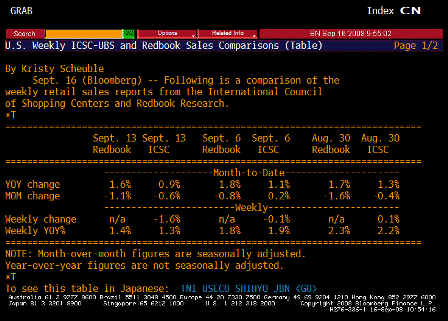
ICSC-UBS Store Sales WoW (Sep 16)

Survey n/a
Actual -1.6
Prior -0.1
Revised n/a

 
Not a good sign, but partially seasonal (see year over year below). Shoppers getting scared by the financial sector again?

[top][end]

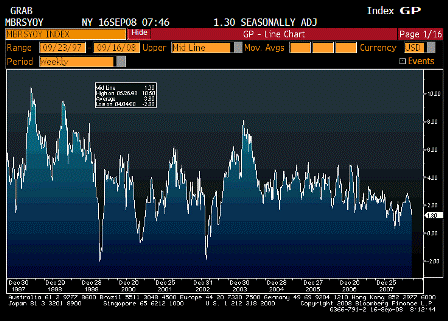
ICSC-UBS Store Sales YoY (Sep 16)

Survey n/a
Actual 1.30
Prior 1.90
Revised n/a

 
Down a bit, but still positive.

[top][end]


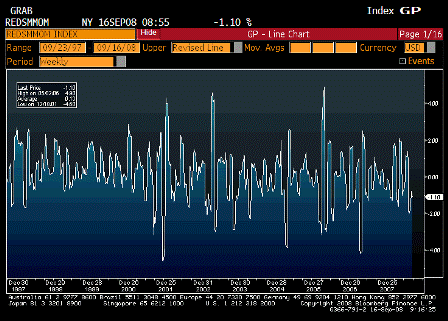
Redbook MoM (Sep 16)

Survey n/a
Actual -1.10
Prior -0.8
Revised n/a

 
Same, down some but somewhat seasonal (see year over year).

[top][end]

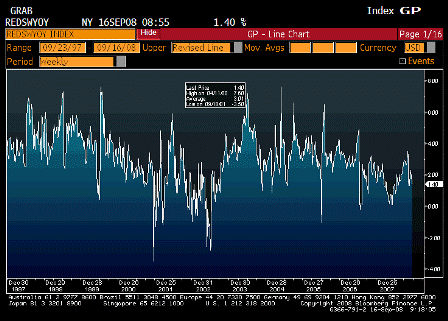
Redbook Weekly YoY (Sep 16)

Survey n/a
Actual 1.40
Prior 1.80
Revised n/a

 
Down some but still positive and off the bottom.

[top][end]

ICSC-Redbook Comparison TABLE (Sep 16)

[top][end]


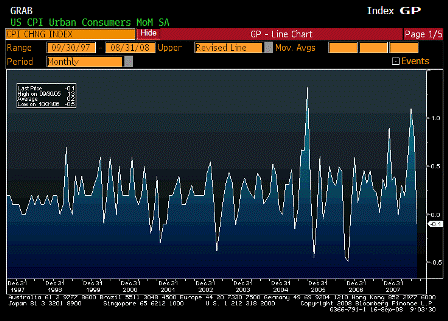
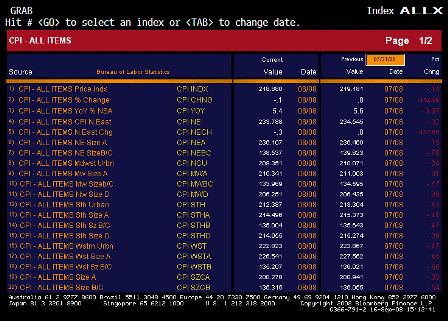
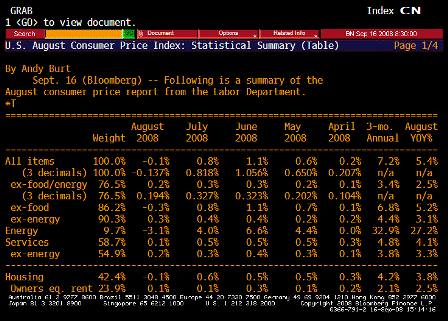
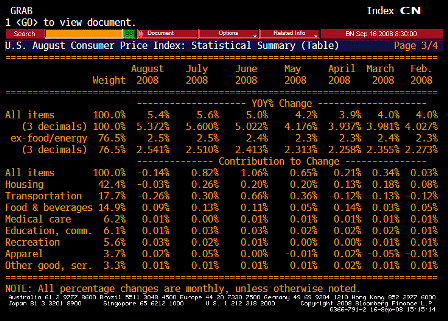
Consumer Price Index MoM (Aug)

Survey -0.1%
Actual -0.1%
Prior 0.8%
Revised n/a

 
Down only a tenth even with the big drop in commodities.

[top][end]

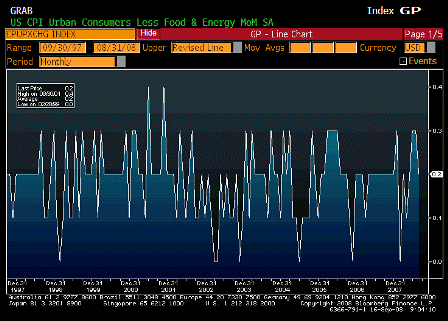
CPI Ex Food and Energy MoM (Aug)

Survey 0.2%
Actual 0.2%
Prior 0.3%
Revised n/a

 
No let up here but this lags headline.

[top][end]

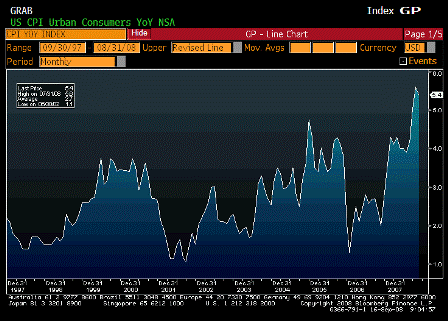
Consumer Price Index YoY (Aug)

Survey 5.5%
Actual 5.4%
Prior 5.6%
Revised n/a

 
Not much of a drop here as crude fell last august as well.

[top][end]

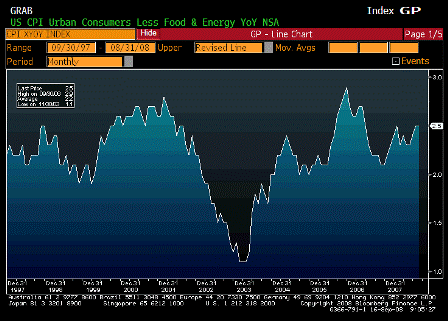
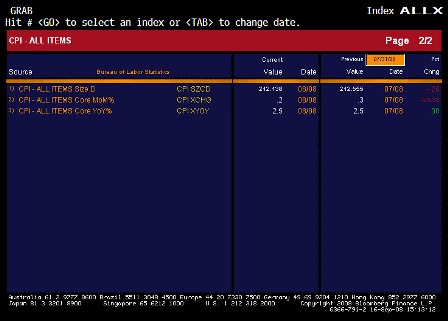
CPI Ex Food and Energy YoY (Aug)

Survey 2.6%
Actual 2.5%
Prior 2.5%
Revised n/a

 
Way above the Fed’s target and comfort zone

[top][end]

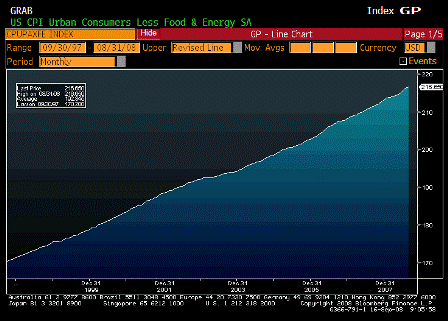
CPI Core Index SA (Aug)

Survey n/a
Actual 216.650
Prior 216.230
Revised n/a

[top][end]

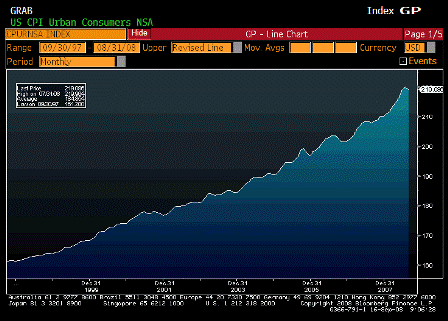
Consumer Price Index NSA (Aug)

Survey 219.300
Actual 219.086
Prior 219.964
Revised n/a

[top][end]

Consumer Price Index ALLX 1 (Aug)

[top][end]

Consumer Price Index ALLX 2 (Aug)

[top][end]

Consumer Price Index TABLE (Aug)

[top][end]

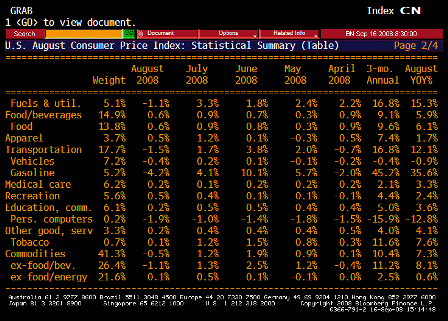
Consumer Price Index TABLE 2 (Aug)

[top][end]

Consumer Price Index TABLE 3 (Aug)

[top][end]


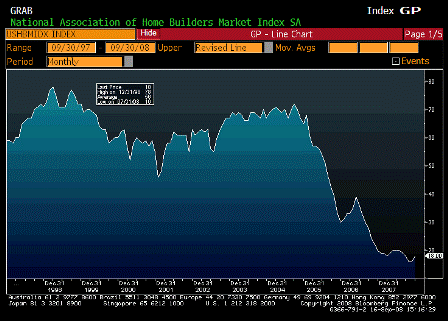
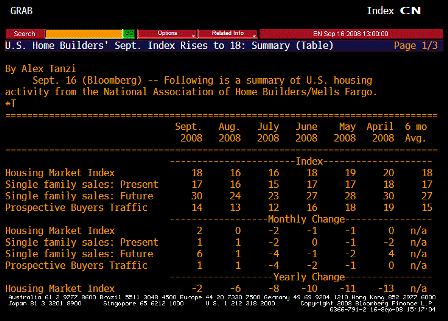
NAHB Housing Market Index (Sep )

Survey 17
Actual 18
Prior 16
Revised n/a

 
A touch better than expected, perking up a bit, but still very low historically and could spring back quickly with the agencies back in action.

[top][end]

NAHB Housing Market Index TABLE (Sep)

[top][end]

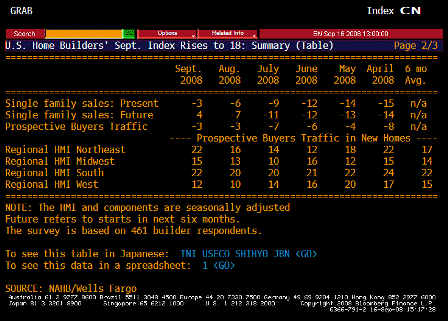
NAHB Housing Market Index TABLE 2 (Sep)

 
Future sales looking pretty good.

[top][end]


FOMC Rate Decision (Sep 16)

Survey 2.00%
Actual 2.00%
Prior 2.00%
Revised n/a

 
Wonder if Fisher cut a deal not to dissent for the Hawkish inflation language

Karim writes:

Headline CPI -0.137% m/m and core CPI up .194% m/m

  • Trending items stayed on trend (OER +0.1% and medical +0.2%)

  • Volatile items a bit of a wash

  • Recreation (+0.5) and apparel (+1.0%) higher than normal

  • Lodging away from home (-1%) lower than normal

Fed view likely reinforced that decline in commodity prices plus growing economic slack, especially in labor market, will dampen inflation into 2009.

  • Decision (no cut) may be hawkish relative to expectations, but wording mostly dovish.

  • 1st paragraph- All changes highlight downside risks to growth; slowing export growth a new wrinkle in addition to the usual financial market strains, labor market weakness and housing.

  • 2nd paragraph-Identical to prior except mention of inflation expectations has been dropped; so a downgrading of concern over inflation.

  • 3rd paragraph-‘Stand ready to act’ but no mention of ‘in a timely manner’.

  • Fisher dropped his dissent.


[top]

2008-07-01 US Economic Releases


[Skip to the end]


ICSC-UBS Store Sales Weekly Change (Jul 1)

Survey n/a
Actual 0.1
Prior -0.6
Revised n/a

Muddling through as govt spending and fiscal rebates offer support.

[top][end]


Redbook Weekly YoY (Jul 1)

Survey n/a
Actual 2.9
Prior 2.8
Revised n/a

A bit better than expected and seem to be moving higher.

[top][end]


ICSC-UBS and Redbook TABLE (Jul 1)

Survey n/a
Actual n/a
Prior n/a
Revised n/a

[top][end]


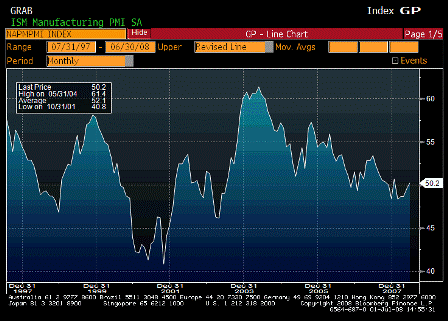
ISM Manufacturing (Jun)

Survey 48.5
Actual 50.2
Prior 49.6
Revised n/a

Better than expected, headline looks better than the detail, but holding up well above recession levels.

[top][end]

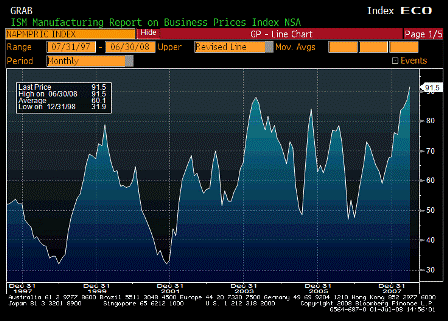
ISM Prices Paid (Jun)

Survey 87.0
Actual 91.5
Prior 87.0
Revised n/a

Breaking out. Question is whether there’s any level of inflation that will trigger a fed rate hike if GDP and financial conditions (whatever that means) stay at current levels.

[top][end]

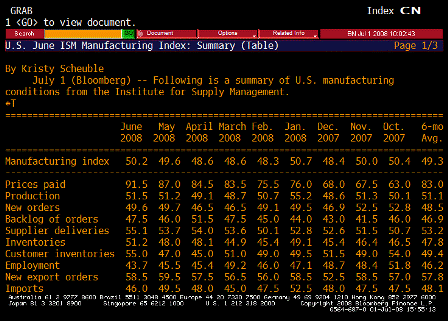
ISM TABLE (Jun)

Karim writes:

  • Not much change in headline or production/new order components.
  • Most material changes in prices paid (up 4.5; to new cycle high) and employment (down 1.8; to new cycle low).

Kohn’s speech: tolerate higher unemployment and higher inflation.

  • Based on continuing claims, conference board, and now ism, downside risk to -60k consensus for nfp on Thursday.

Weak, but not recession levels yet.

Government plus exports so far have made up for weak non-government domestic demand.

[top][end]


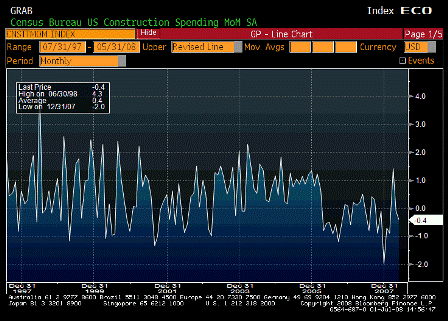
Construction Spending MoM (May)

Survey -0.6%
Actual -0.4%
Prior -0.4%
Revised -0.1%

A bit better than expected. Down but not terrible.

[top][end]


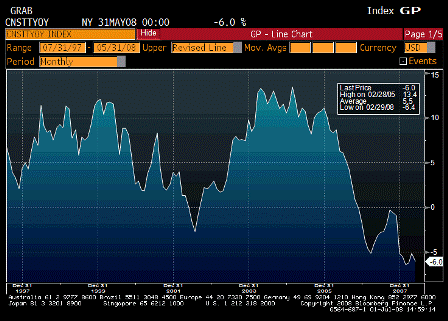
Construction Spending YoY (May)

Survey n/a
Actual -6.0%
Prior -5.1%
Revised n/a

Still near the lows, but a possible bottoming action.

[top][end]


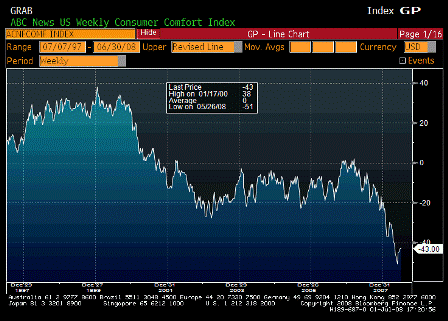
ABC Consumer Confidence (Jun 29)

Survey n/a
Actual -43
Prior -43
Revised n/a

Still looking pretty grim, probably mostly due to higher prices.


[top]

Reuters: Redbook Research


[Skip to the end]

Muddling through above recession levels.

TABLE-US chain store sales rise 2.0 pct last wk-Redbook

NEW YORK, June 3 (Reuters) – Redbook Research on Tuesday released the
following seasonally adjusted weekly data on U.S. chain store sales:
Year-over-year: Week (w/e 5/31/08 vs year ago) 2.0 pct
Year-over-year:Month (May 2008 vs May 2007) 1.8 pct
Month-over-month: (May 2008 vs April 2008) 1.9 pct


The Johnson Redbook Retail Sales Index is a sales-weighted index of year-over-year same-store sales growth in a sample of large U.S. general merchandise retailers representing about 9,000 stores. (Editing by Theodore d’Afflisio; U.S. Treasury desk; Tel: 646-223-6300)


NEW YORK, June 3 (Reuters) – The International Council of
Shopping Centers and UBS Securities on Tuesday released the
following seasonally adjusted weekly data on U.S. chain store
retail sales.
WEEK ENDING INDEX 1977=100 YEAR/YEAR CHANGE WEEKLY CHANGE

                              (percent)         (percent)

May   31           484.3             1.2               -0.8

May   24           488.2             1.5                0.0

May   17           488.3             1.6               -0.4

May   10           490.3             0.5               -1.0

May    3           495.4             2.3               -0.2
The ICSC-UBS weekly U.S. retail chain store sales index is a

joint publication between ICSC and UBS Securities LLC. It

measures nominal same-store sales, excluding restaurant and

vehicle demand, and represents about 75  retail chain stores.


[top]