2008-12-23 USER


[Skip to the end]


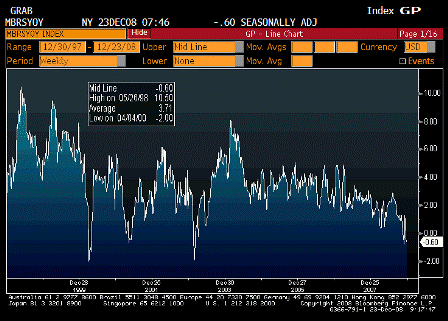
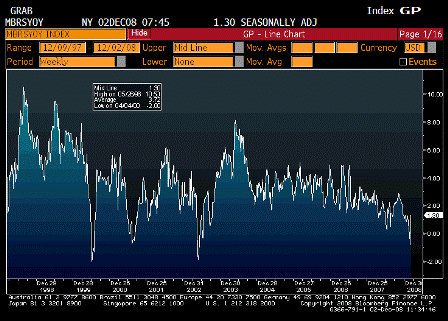
ICSC UBS Store Sales YoY (Dec 23)

Survey n/a
Actual -0.60%
Prior -0.40%
Revised n/a

 
Continues to slip.

[top][end]

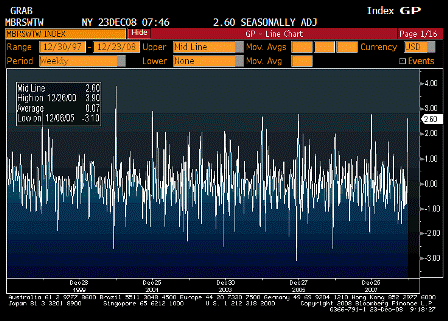
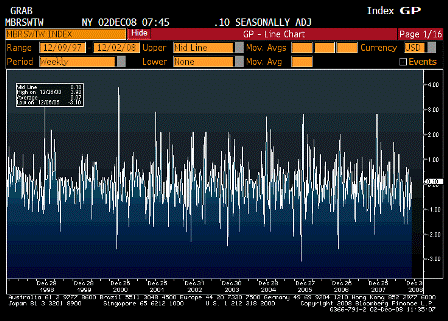
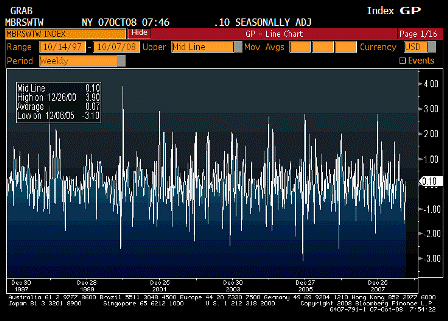
ICSC UBS Store Sales WoW (Dec 23)

Survey n/a
Actual 2.60%
Prior 0.60%
Revised n/a

 
Cheaper gasoline helping some?

[top][end]

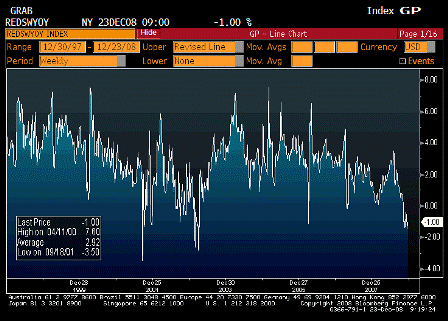
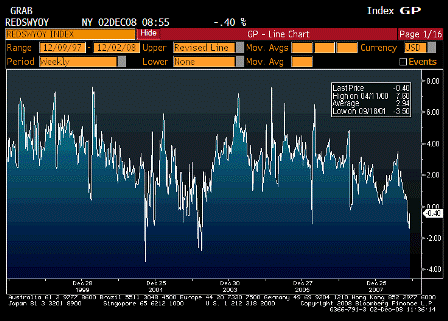
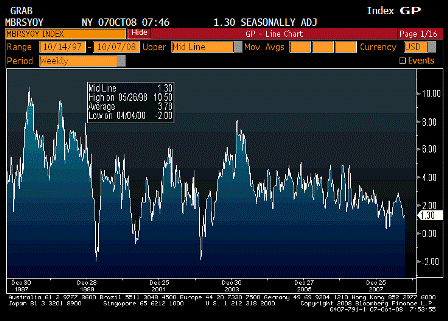
Redbook Store Sales Weekly YoY (Dec 16)

Survey n/a
Actual -1.00%
Prior -1.40%
Revised n/a

 
Still slipping.

[top][end]

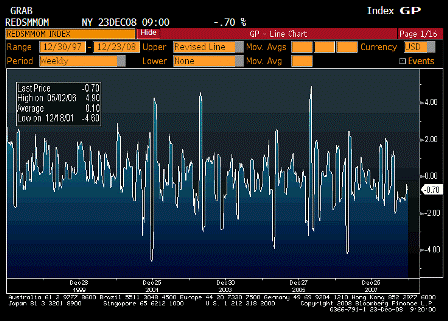
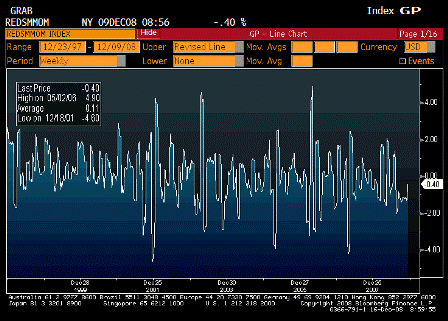
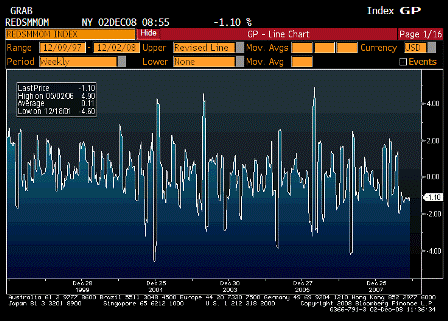
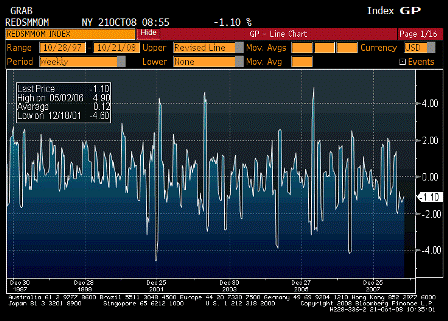
Redbook Store Sales MoM (Dec 16)

Survey n/a
Actual -0.70%
Prior -0.70%
Revised n/a

 
Still slipping.

No meaningul sign of cheaper gasoline helping here yet.
[top][end]

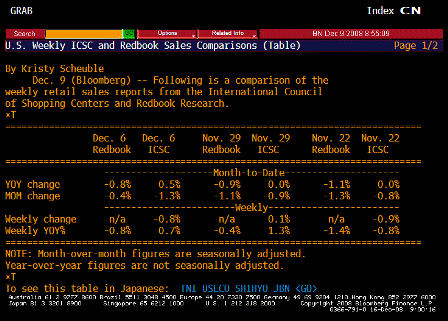
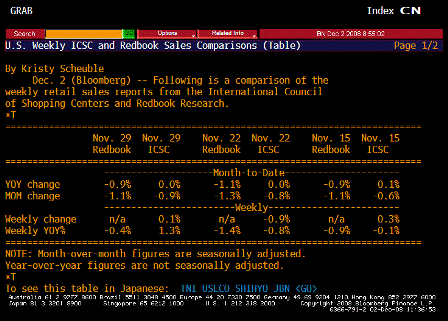
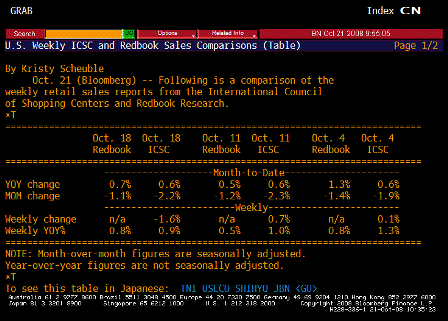
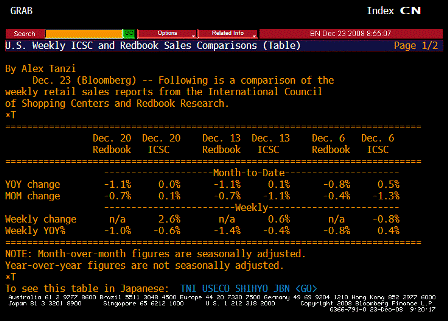
ICSC UBS Redbook Comparison TABLE (Dec 16)
[top][end]


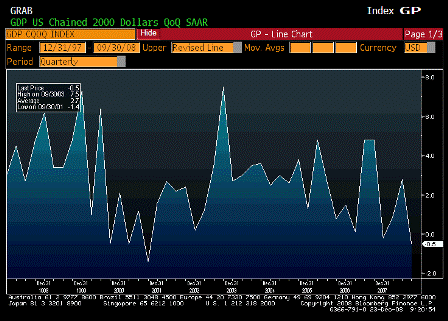
GDP QoQ Annualized (3Q F)

Survey -0.5%
Actual -0.5%
Prior -0.5%
Revised n/a

 
As expected.

[top][end]

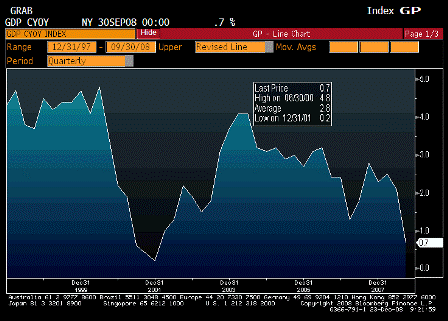
GDP YoY Annualized Real (3Q F)

Survey n/a
Actual 0.70%
Prior 2.1%
Revised n/a

 
Tiny positive for the year.

Next quarter looking negative.
[top][end]

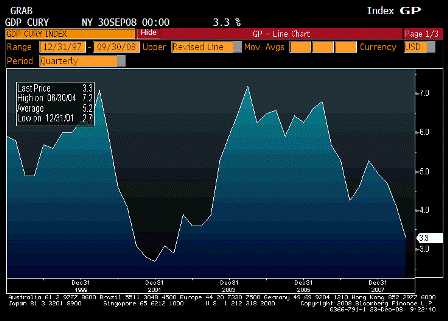
GDP YoY Annualized Nominal (3Q F)

Survey n/a
Actual 3.3%
Prior 4.1%
Revised n/a

 
This is heading to new lows as well.

[top][end]

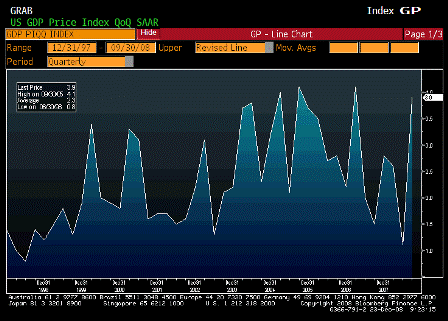
GDP Price Index (3Q F)

Survey 4.25
Actual 3.9%
Prior 4.2%
Revised n/a

 
Should reverse.

[top][end]

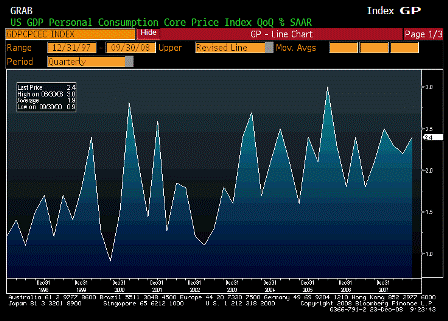
Core PCE QoQ (3Q F)

Survey 2.6%
Actual 2.4%
Prior 2.6%
Revised n/a

 
Should reverse some.

[top][end]

GDP ALLX 1 (3Q F)

[top][end]

GDP ALLX 2 (3Q F)

[top][end]


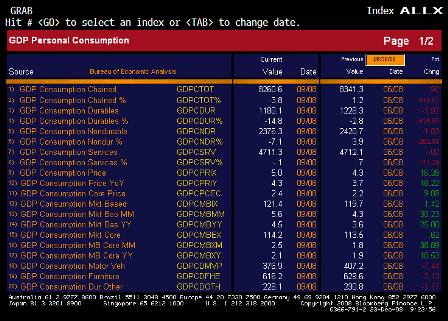
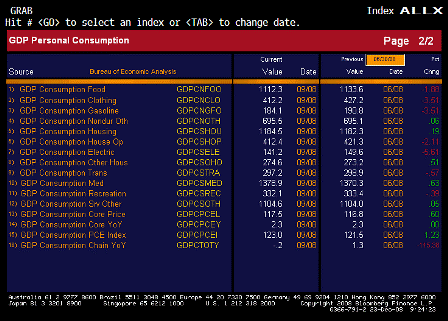
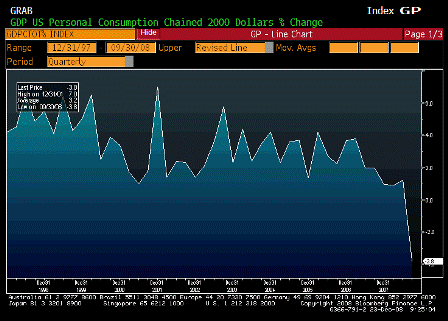
Personal Consumption (3Q F)

Survey -3.7%
Actual -3.8%
Prior -3.7%
Revised n/a

 
Sudden fall from ‘muddling through’ to recession.
[top][end]

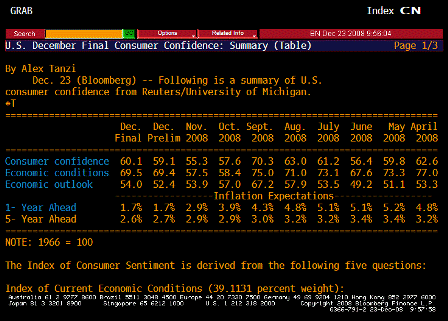
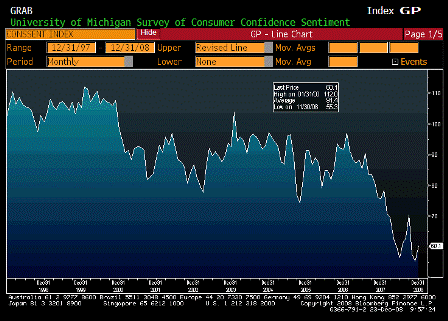
Univ of Michigan Confidence (Dec F)

Survey 58.8
Actual 60.1
Prior 59.1
Revised n/a

 
Gasoline prices helping here.

[top][end]

Univ of Michigan TABLE Inflation Expectations (Dec F)

 
Back to where the Fed wants them to be.
[top][end]


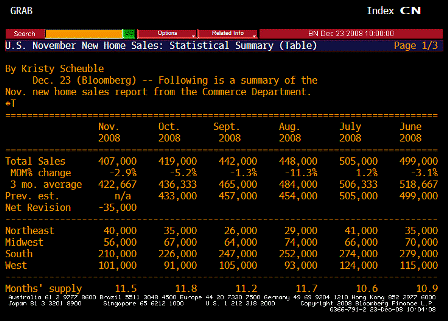
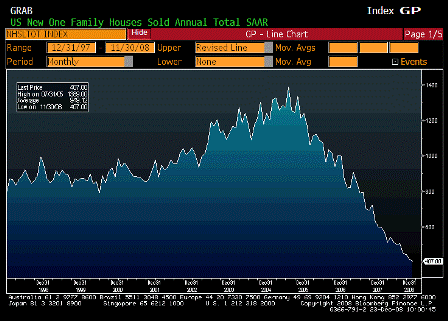
New Home Sales (Nov)

Survey 415k
Actual 407k
Prior 433k
Revised 419k

 
A bit lower than expected and last month revised down some.
[top][end]

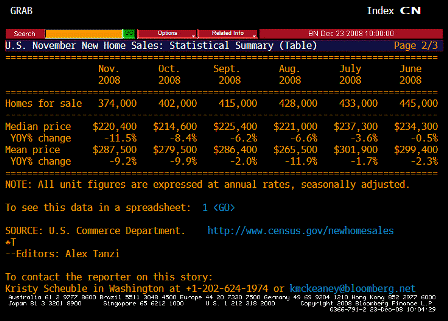
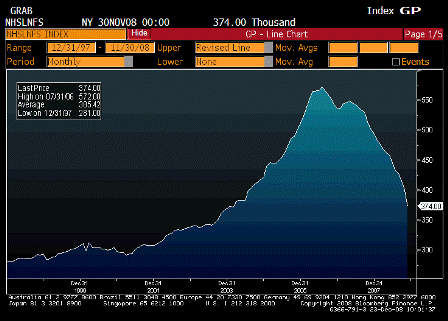
New Home Sales Total for Sale (Nov)

Survey n/a
Actual 374.00
Prior 402.00
Revised n/a

 
Down to very low levels and one reason sales are low.
[top][end]

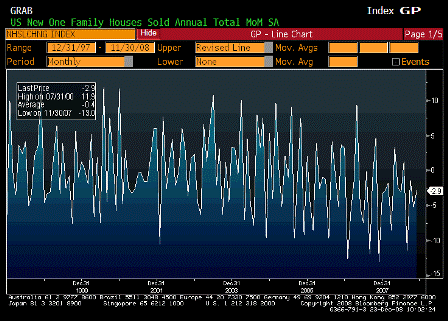
New Home Sales MoM (Nov)

Survey n/a
Actual -2.9%
Prior -5.2%
Revised n/a

[top][end]

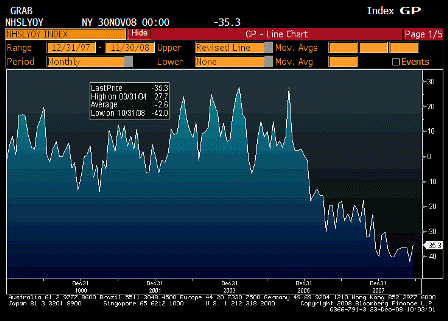
New Home Sales YoY (Nov)

Survey n/a
Actual -35.3%
Prior -42.0%
Revised n/a

[top][end]

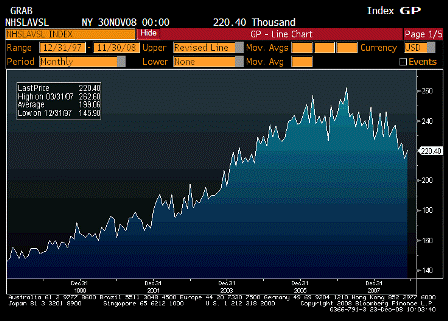
New Home Sales Median Price (Nov)

Survey n/a
Actual 220.40
Prior 214.60
Revised n/a

 
Up, but still trending lower.

[top][end]

New Home Sales TABLE 1 (Nov)

[top][end]

New Home Sales TABLE 2 (Nov)

[top][end]


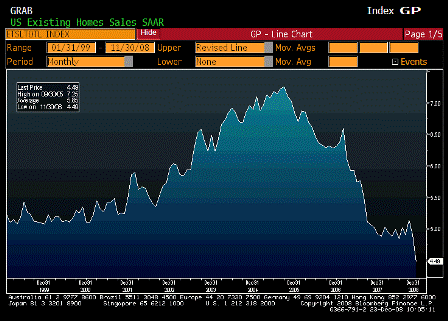
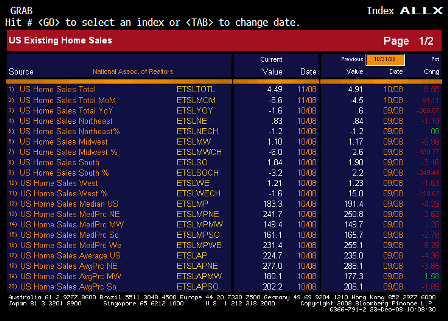
Existing Home Sales (Nov)

Survey 4.93M
Actual 4.49M
Prior 4.98M
Revised 4.91M

 
Large drop.

[top][end]

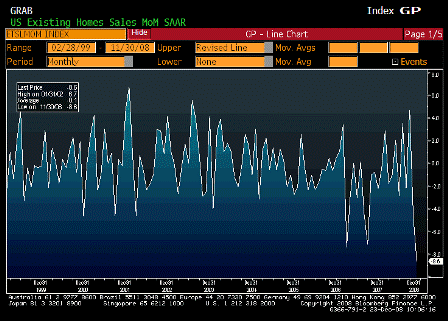
Existing Home Sales MoM (Nov)

Survey -1.0%
Actual -8.6%
Prior -3.1%
Revised -4.5%

[top][end]

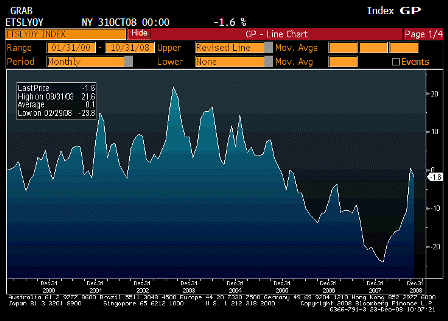
Existing Home Sales YoY (Nov)

Survey n/a
Actual -1.6%
Prior 0.6%
Revised n/a

 
Still well off the bottom.

[top][end]

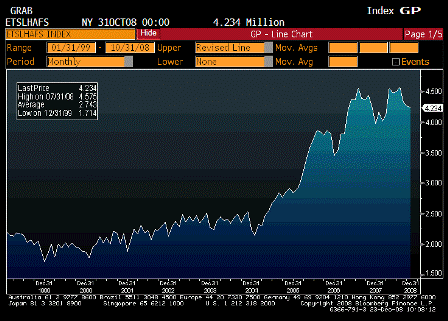
Existing Home Sales Inventory (Nov)

Survey n/a
Actual 4.234
Prior 4.272
Revised n/a

 
Falling some, but new foreclosures probably keeping this high.
[top][end]

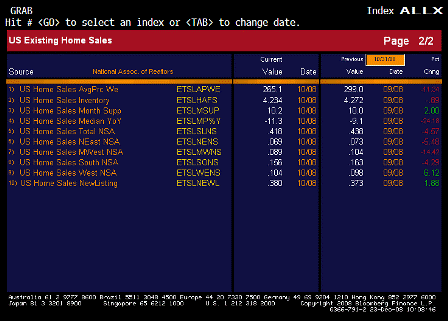
Existing Home Sales ALLX 1 (Nov)

[top][end]

Existing Home Sales ALLX 2 (Nov)

[top][end]


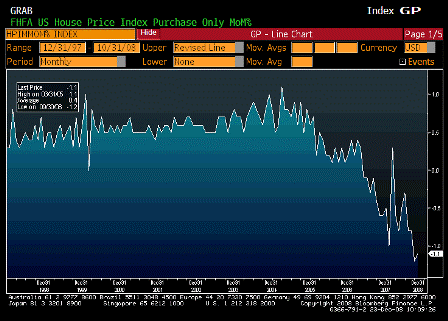
House Price Index MoM (Oct)

Survey -1.3%
Actual -1.1%
Prior -1.3%
Revised -1.2%

 
Still falling.

[top][end]

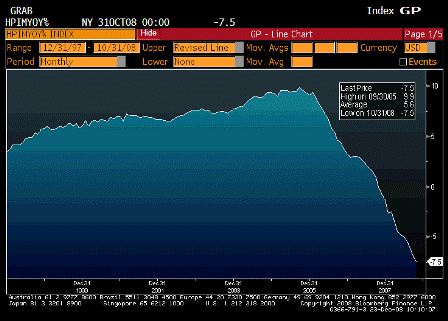
House Price Index YoY (Oct)

Survey n/a
Actual -7.5%
Prior -7.0%
Revised n/a

 
No bottom in sight yet.

[top][end]

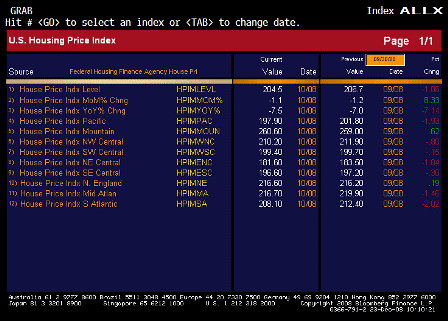
House Price Index ALLX (Nov)

[top][end]

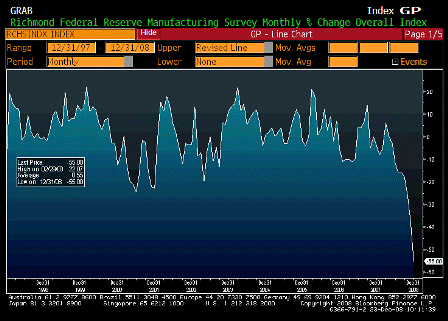
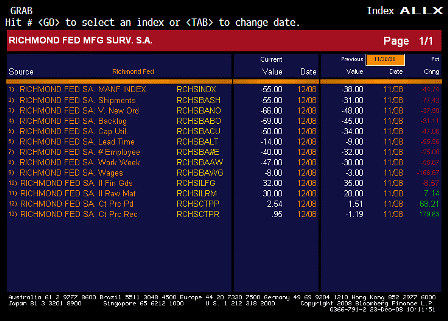
Richmond Fed Manufacturing Index (Dec)

Survey -40
Actual -55
Prior -38
Revised n/a

 
Very weak.

[top][end]

Richmond Fed Manufacturing Index ALLX (Dec)


[top]

2008-12-16 USER


[Skip to the end]


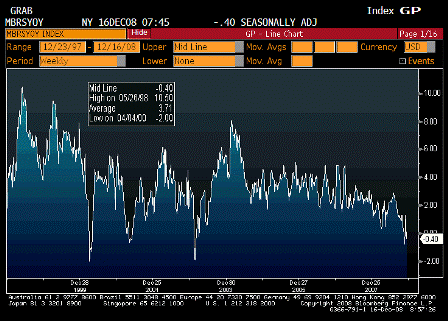
ICSC UBS Store Sales YoY (Dec 16)

Survey n/a
Actual -0.40%
Prior 0.40%
Revised n/a

 
Continues to move lower.

[top][end]

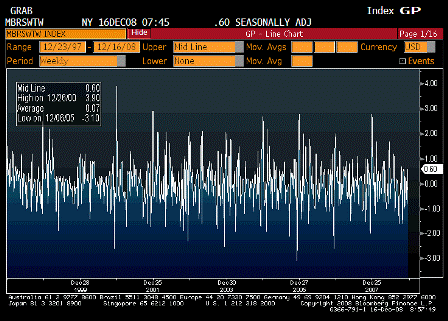
ICSC UBS Store Sales WoW (Dec 16)

Survey n/a
Actual 0.60%
Prior -0.80%
Revised n/a

[top][end]

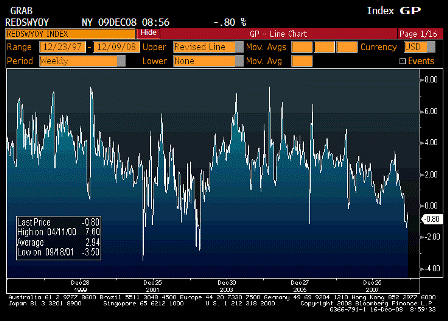
Redbook Store Sales Weekly YoY (Dec 9)

Survey n/a
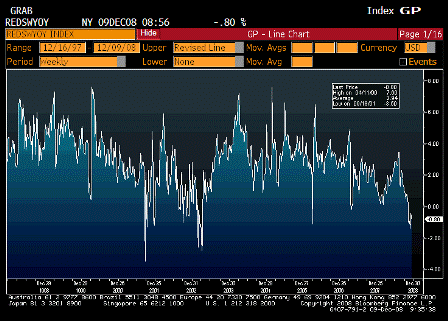
Actual -0.80%
Prior -0.40%
Revised n/a

 
Continues to move lower.

[top][end]

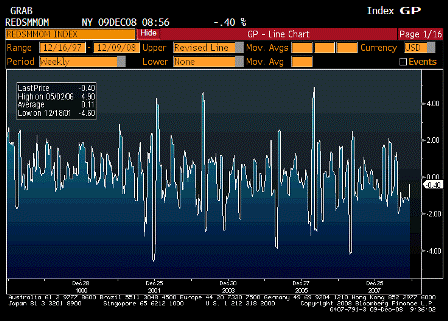
Redbook Store Sales MoM (Dec 9)

Survey n/a
Actual -0.40%
Prior -1.10%
Revised n/a

[top][end]

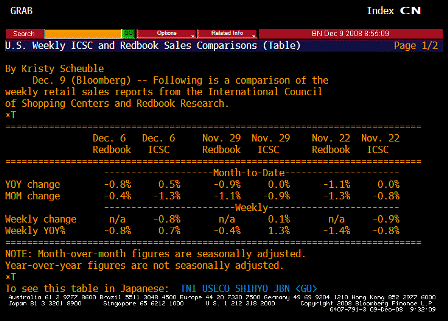
ICSC UBS Redbook Comparison TABLE (Dec 9)

[top][end]

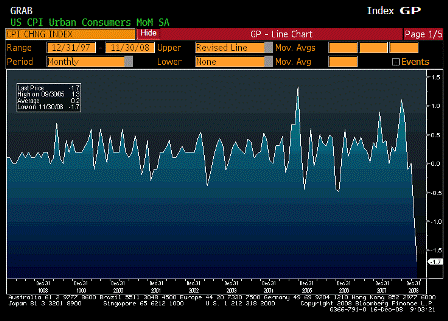
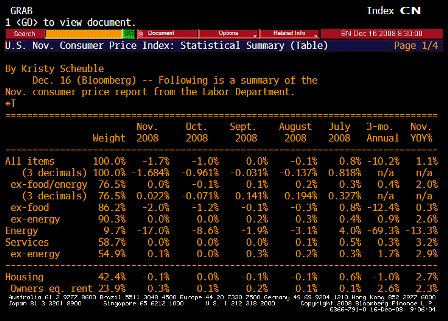
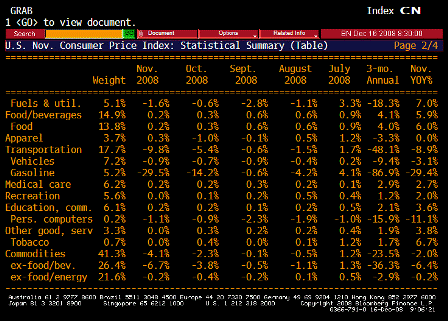
Consumer Price Index MoM (Nov)

Survey -1.3%
Actual -1.7%
Prior -1.0%
Revised n/a


Karim writes:

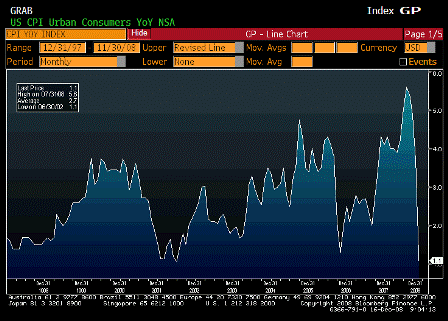
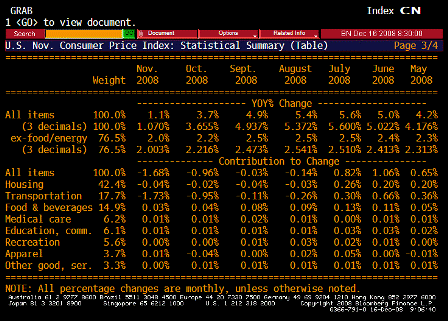
  • Headline CPI dropped 1.7% M/M in November after 1.0% decline last month (Y/Y now at +1.1%)
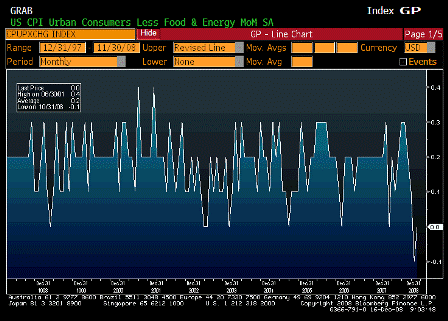
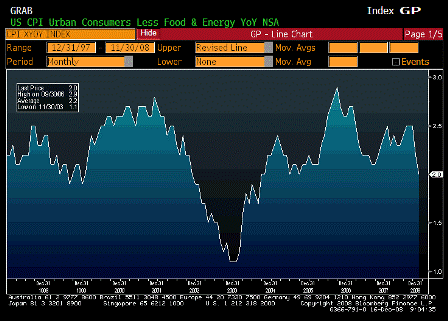
  • Core was flat in November after 0.1% decline (Y/Y at 2.0% and 3 month annualized at 0.4%… core is decelerating quickly and inflation certainly not a concern for Fed at this point)
  • OER was up 0.3% M/M, but partly due to a decline in utility prices that increases economic rents

[top][end]

CPI Ex Food and Energy MoM (Nov)

Survey 0.1%
Actual 0.0%
Prior -0.1%
Revised n/a

[top][end]

Consumer Price Index YoY (Nov)

Survey 1.5%
Actual 1.1%
Prior 3.7%
Revised n/a

 
Way down, as crude oil and gasoline are lower than they were last year.

[top][end]

CPI Ex Food and Energy YoY (Nov)

Survey 2.1%
Actual 2.0%
Prior 2.2%
Revised n/a

 
Core drifting lower though owner equivalent rent went up .30% as utility costs fell and rents stayed about the same.

[top][end]

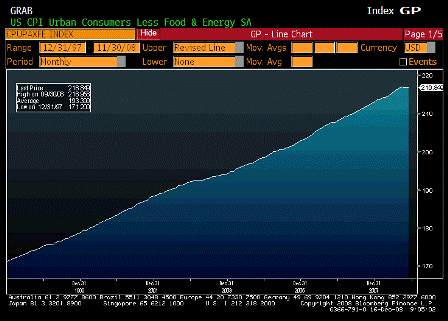
CPI Core Index SA (Nov)

Survey n/a
Actual 216.849
Prior 216.801
Revised n/a

[top][end]

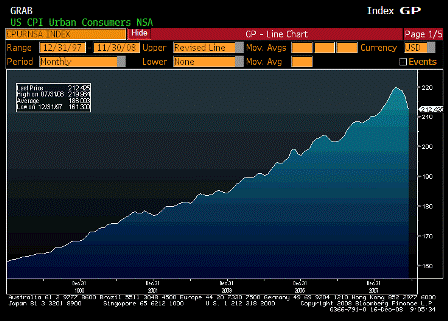
Consumer Price Index NSA (Nov)

Survey 212.699
Actual 212.425
Prior 216.573
Revised n/a

[top][end]

Consumer Price Index TABLE 1 (Nov)

[top][end]

Consumer Price Index TABLE 2 (Nov)

[top][end]

Consumer Price Index TABLE 3 (Nov)

[top][end]

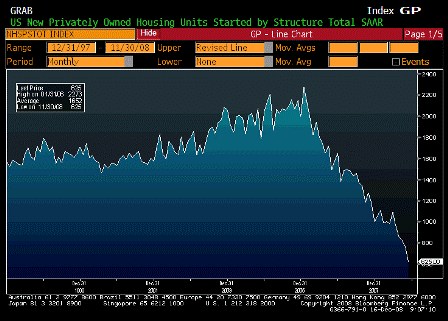
Housing Starts (Nov)

Survey 763K
Actual 625K
Prior 791K
Revised 771K

 
Keeps falling as the headlines have the public and financial institutions scared stiff.

Karim writes:

  • Housing Starts dropped to 625k in November (record low with about 50 years of data!) from 771k last month and 1,179k last year (this should put more downward pressure on residential investment in GDP through early 2009)
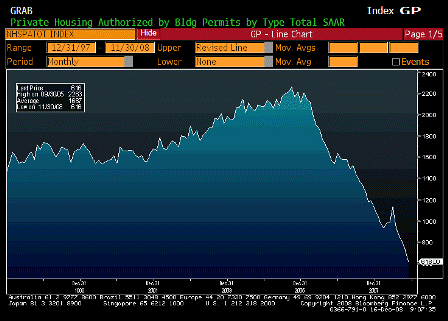
  • Permits dropped to 616k in November (record low with about 50 years of data!) from 730k last month and 1,111k last year
  • Token “Sliver” lining- less pressure on inventories from new homes

[top][end]

Building Permits (Nov)

Survey 700K
Actual 616K
Prior 708K
Revised 730K

[top][end]


[top]

2008-12-09 USER


[Skip to the end]


ICSC UBS Store Sales YoY (Dec 9)

Survey n/a
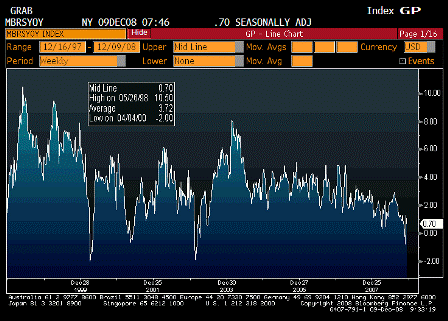
Actual -0.70%
Prior 1.30%
Revised n/a

[top][end]

ICSC UBS Store Sales WoW (Dec 9)

Survey n/a
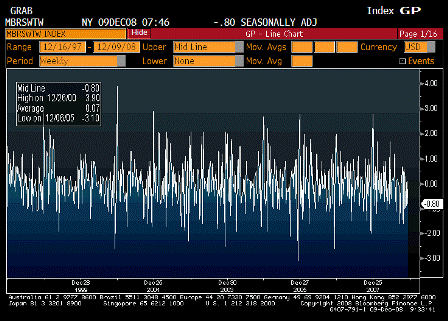
Actual -0.80%
Prior 0.10%
Revised n/a

[top][end]

Redbook Store Sales Weekly YoY (Dec 9)

Survey n/a
Actual -0.80%
Prior -0.40%
Revised n/a

[top][end]

Redbook Store Sales MoM (Dec 9)

Survey n/a
Actual -0.40%
Prior -1.10%
Revised n/a

[top][end]

ICSC UBS Redbook Comparison TABLE (Dec 9)

[top][end]

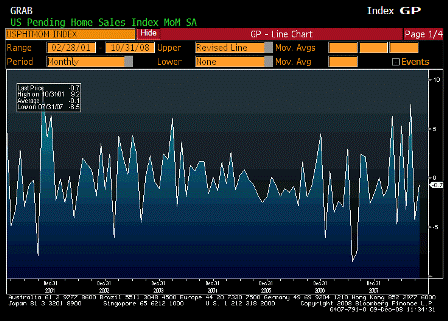
Pending Home Sales MoM (Oct)

Survey n/a
Actual -0.7%
Prior -4.3%
Revised n/a

[top][end]

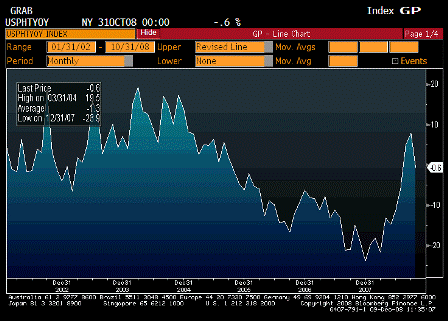
Pending Home Sales YoY (Oct)

Survey n/a
Actual -0.6%
Prior 7.9%
Revised n/a


[top]

2008-12-02 USER


[Skip to the end]


ICSC UBS Store Sales YoY (Dec 2)

Survey n/a
Actual 1.30%
Prior -0.80%
Revised n/a

[top][end]

ICSC UBS Store Sales WoW (Dec 2)

Survey n/a
Actual 0.10%
Prior -0.90%
Revised n/a

[top][end]

Redbook Store Sales Weekly YoY (Dec 2)

Survey n/a
Actual -0.40%
Prior -1.40%
Revised n/a

[top][end]

Redbook Store Sales MoM (Dec 2)

Survey n/a
Actual -1.10%
Prior -1.30%
Revised n/a

[top][end]

ICSC UBS Redbook Comparison TABLE (Dec 2)


[top]
2008-11-18 USER


[Skip to the end]


ICSC UBS Store Sales YoY (Nov 18)

Survey n/a
Actual -0.10%
Prior 0.40%
Revised n/a

 
Bending but not breaking, yet. Gasoline prices probably helping.

[top][end]

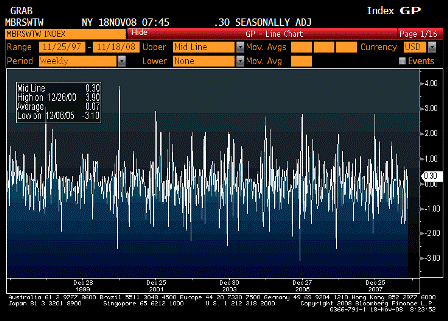
ICSC UBS Store Sales WoW (Nov 18)

Survey n/a
Actual 0.30%
Prior -1.00%
Revised n/a

[top][end]

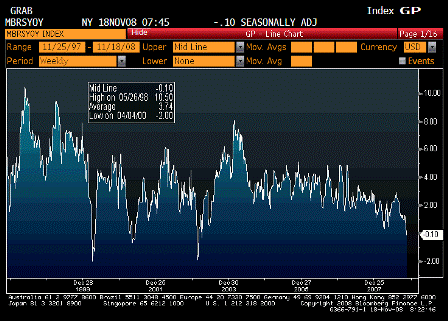
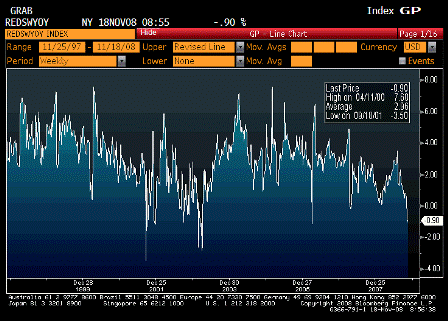
Redbook Store Sales Weekly YoY (Nov 18)

Survey n/a
Actual -0.90%
Prior -1.00%
Revised n/a

 
Looking weak as well.

[top][end]

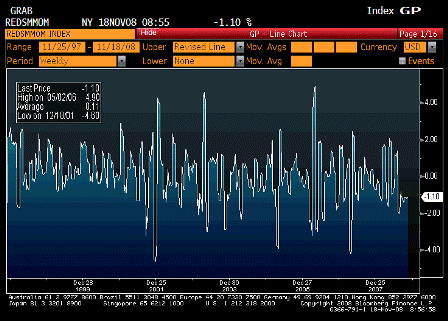
Redbook Store Sales MoM (Nov 18)

Survey n/a
Actual -1.10%
Prior -1.20%
Revised n/a

[top][end]

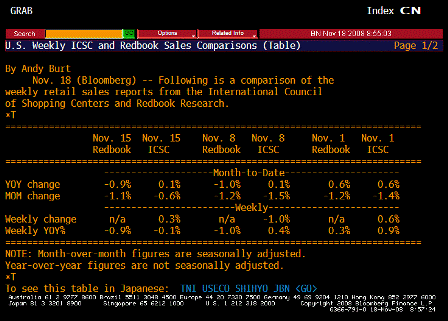
ICSC UBS Redbook Comparison TABLE (Nov 18)

[top][end]

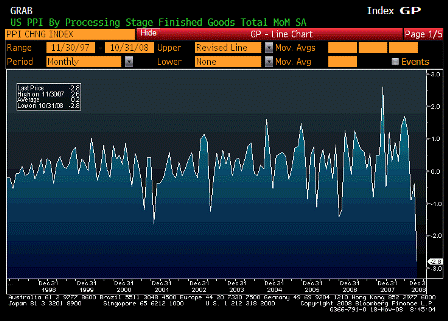
Producer Price Index MoM (Oct)

Survey -1.9%
Actual -2.8%
Prior -0.4%
Revised n/a

 
Way lower than expected.

[top][end]

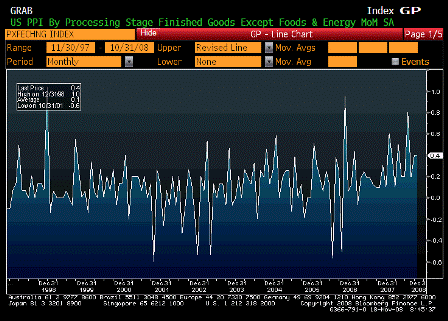
PPI Ex Food and Energy MoM (Oct)

Survey 0.1%
Actual 0.4%
Prior 0.4%
Revised n/a

 
Way higher than expected.

[top][end]

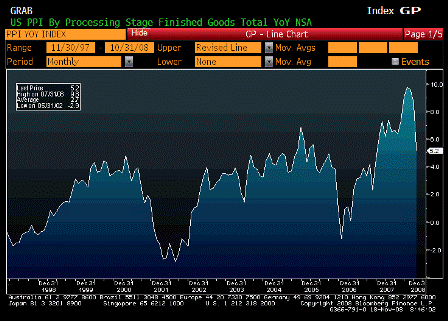
Producer Price Index YoY (Oct)

Survey 6.2%
Actual 5.2%
Prior 8.7%
Revised n/a

 
Still high but falling rapidly.

[top][end]

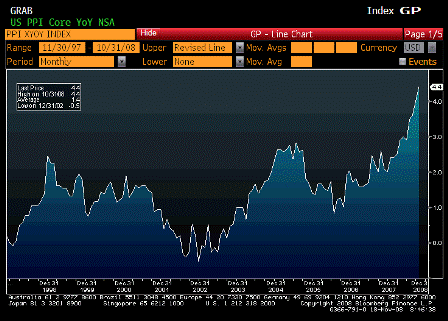
PPI Ex Food and Energy YoY (Oct)

Survey 4.0%
Actual 4.4%
Prior 4.0%
Revised n/a

 
Still moving higher.


[top]
2008-11-12 USER


[Skip to the end]


ICSC UBS Store Sales YoY (Nov 11)

Survey n/a
Actual 0.4%
Prior 0.9%
Revised n/a

[top][end]

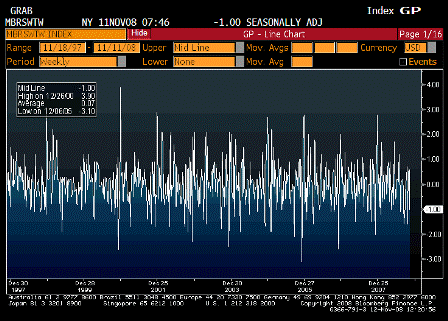
ICSC UBS Store Sales WoW (Nov 11)

Survey n/a
Actual -1.0%
Prior 0.6%
Revised n/a

[top][end]

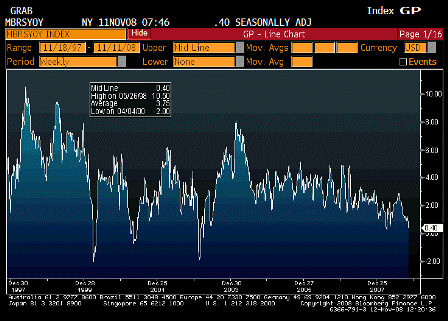
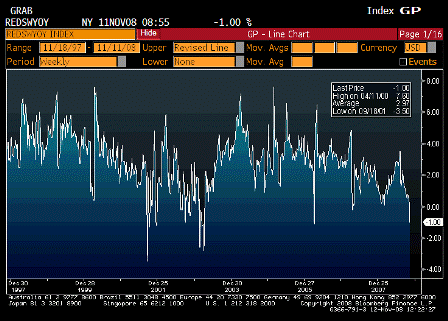
Redbook Store Sales Weekly YoY (Nov 11)

Survey n/a
Actual -1.0%
Prior 0.3%
Revised n/a

[top][end]

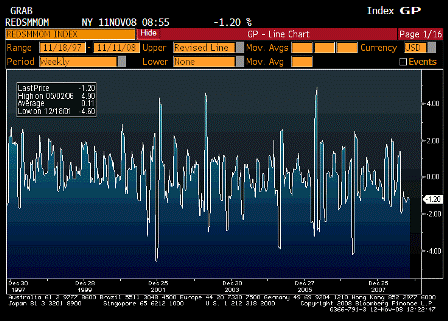
Redbook Store Sales MoM (Nov 11)

Survey n/a
Actual -1.2%
Prior -1.2%
Revised n/a

[top][end]

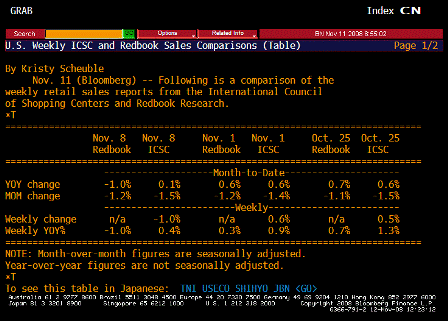
ICSC UBS Redbook Comparison TABLE (Nov 11)


[top]
2008-11-04 USER


[Skip to the end]


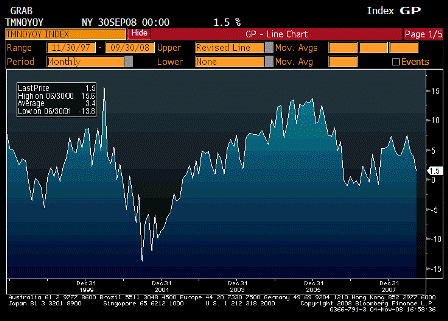
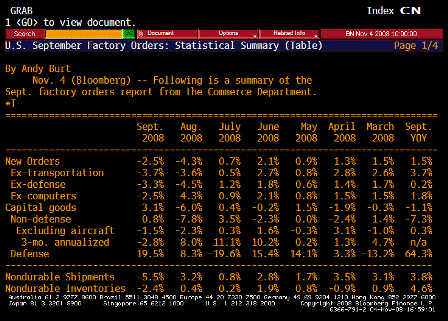
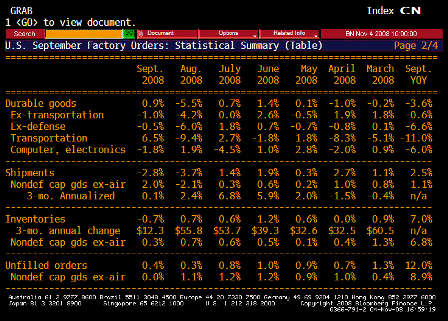
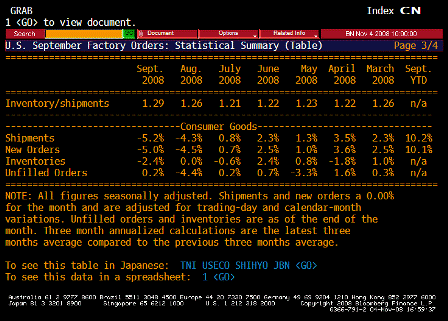
Factory Orders YoY (Sep)

Survey n/a
Actual 1.5%
Prior 3.9%
Revised n/a

 
Dip down, but not terrible yet.

[top][end]

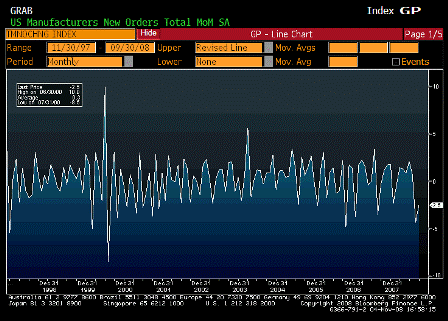
Factory Orders MoM (Sep)

Survey n/a
Actual -2.5%
Prior -4.3%
Revised n/a

 
Down, but down less than last month.

[top][end]

Factory Orders TABLE 1 (Sep)

[top][end]

Factory Orders TABLE 2 (Sep)

[top][end]

Factory Orders TABLE 3 (Sep)

[top][end]

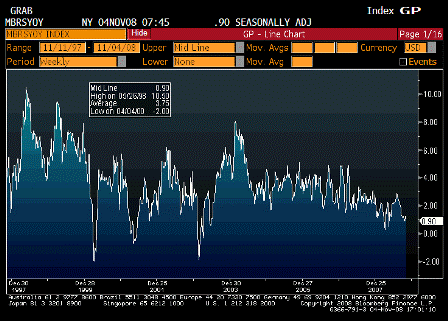
ICSC UBS Store Sales YoY (Nov 4)

Survey n/a
Actual .90%
Prior 1.30%
Revised n/a

 
Looks to still be weakening but off the bottom and still positive.

[top][end]

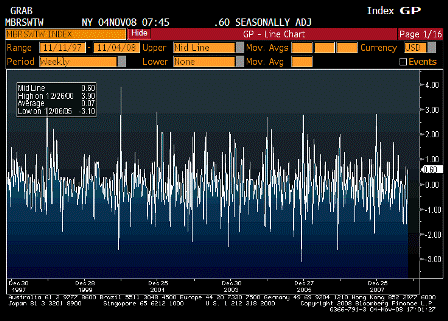
ICSC UBS Store Sales WoW (Nov 4)

Survey n/a
Actual 0.60%
Prior 0.50%
Revised n/a

 
Same, still on the plus side.

[top][end]

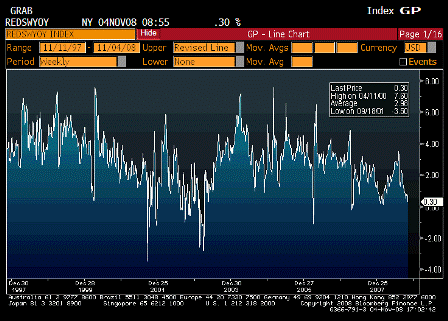
Redbook Store Sales Weekly YoY (Nov 4)

Survey n/a
Actual 0.30%
Prior 0.70%
Revised n/a

 
Looking lower, but still off the recent lows.

[top][end]

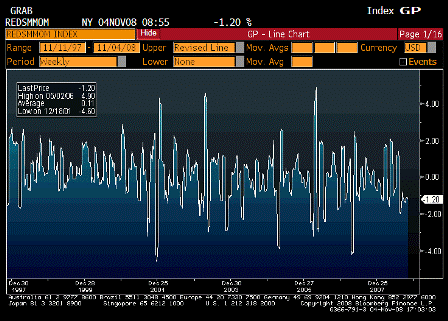
Redbook Store Sales MoM (Nov 4)

Survey n/a
Actual -1.20%
Prior -1.10%
Revised n/a

[top][end]

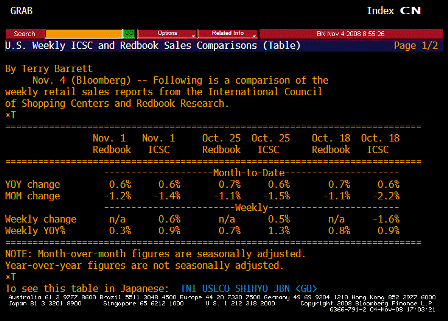
ICSC UBS Redbook Comparison TABLE


[top]
2008-10-28 USER


[Skip to the end]


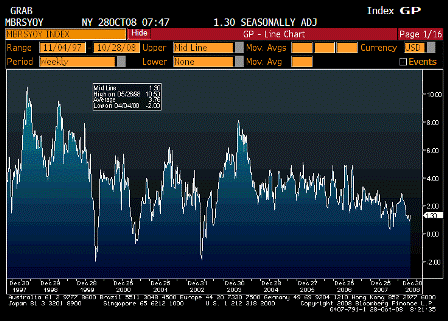
ICSC UBS Store Sales YoY (Oct 28)

Survey n/a
Actual 1.30%
Prior 0.90%
Revised n/a

 
Maybe rebounding some with lower gas prices?

[top][end]

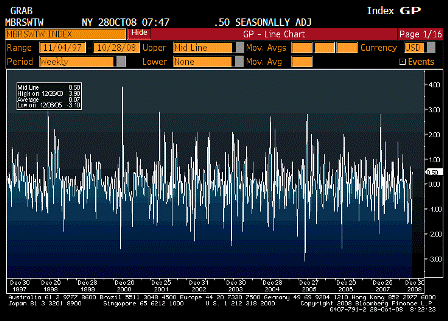
ICSC UBS Store Sales WoW (Oct. 28)

Survey n/a
Actual 0.50%
Prior -1.60%
Revised n/a

[top][end]


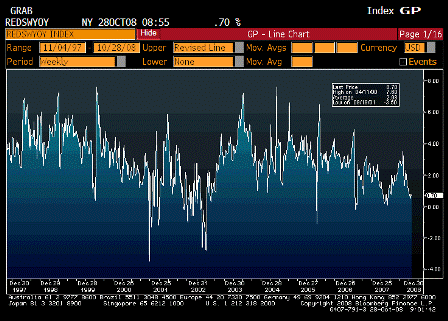
Redbook Store Sales Weekly YoY (Oct. 28)

Survey n/a
Actual 0.70%
Prior 0.80%
Revised n/a

[top][end]

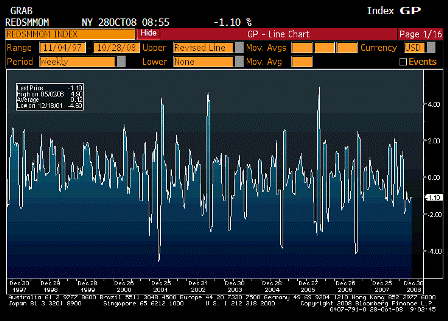
Redbook Store Sales MoM (Oct. 28)

Survey n/a
Actual -1.10%
Prior -1.10%
Revised n/a

[top][end]

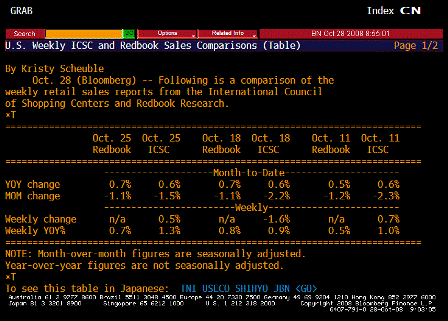
ICSC UBS Redbook Comparison TABLE (Oct. 28)

[top][end]


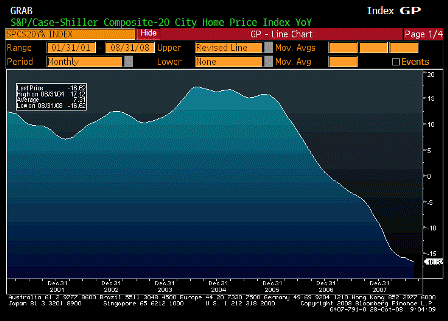
S&P CS Composite 20 YoY (Aug)

Survey -16.60%
Actual -16.62%
Prior -16.35%
Revised -16.32%

[top][end]

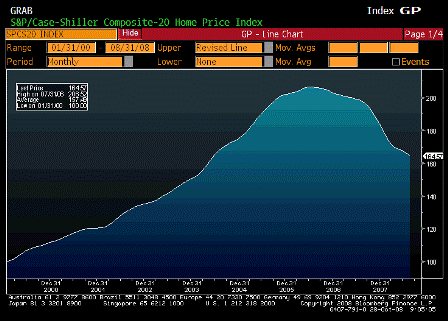
S&P Case Shiller Home Price Index (Aug)

Survey n/a
Actual 164.57
Prior 166.23
Revised 166.29

 
Still falling but at a slower rate

[top][end]

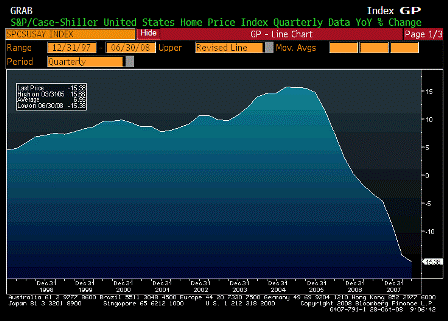
S&P Case Shiller Home Price Index YoY (Aug)

Survey n/a
Actual -15.38%
Prior -14.22%
Revised n/a

[top][end]

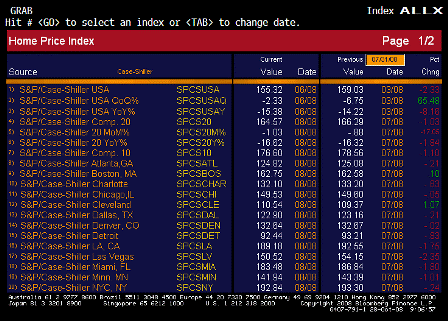
Case Shiller ALLX 1 (Aug)

[top][end]

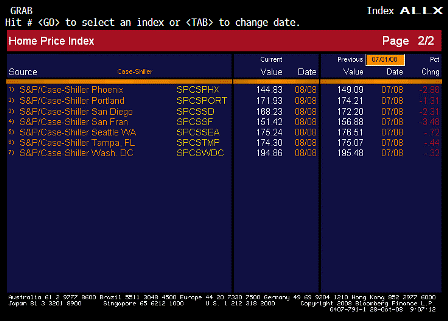
Case Shiller ALLX 2 (Aug)

[top][end]


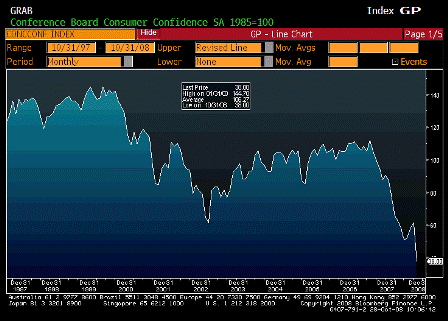
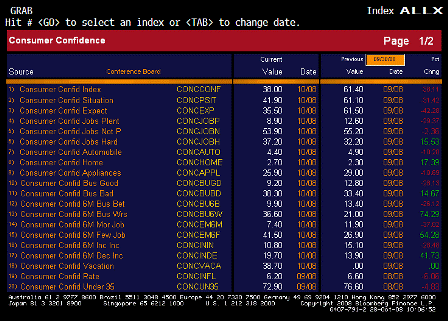
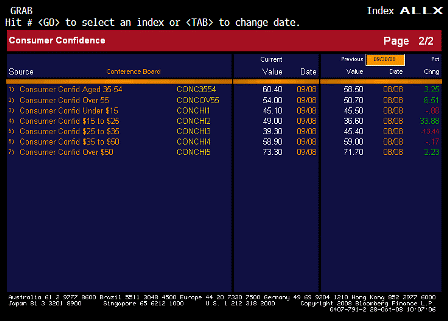
Consumer Confidence (Oct)

Survey 52.0
Actual 38.0
Prior 59.8
Revised 61.4

 
Major dip here.

[top][end]

Consumer Confidence ALLX 1 (Oct)

[top][end]

Consumer Confidence ALLX 2 (Oct)

[top][end]


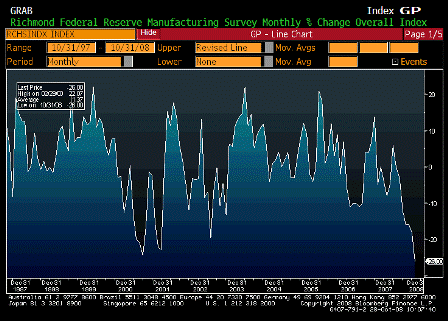
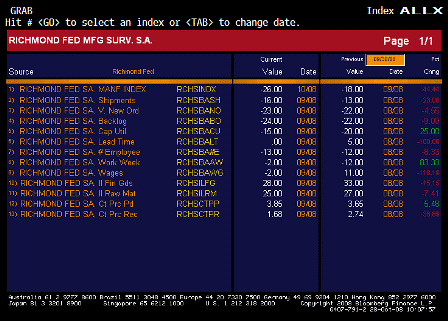
Richmond Fed Manufacturing Index (Oct)

Survey -23
Actual -26
Prior -18
Revised n/a

 
Also bad.

[top][end]

Richmond Fed Manufacturing Index ALLX (Oct)


[top]
2008-10-21 USER


[Skip to the end]


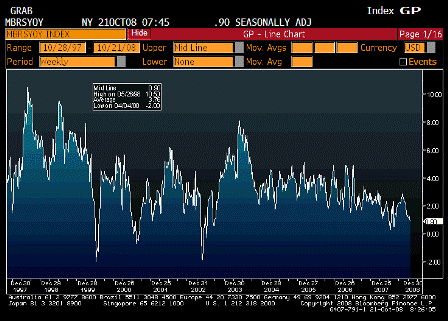
ICSC UBS Store Sales YoY (Oct 21)

Survey n/a
Actual .90
Prior 1.00
Revised n/a

 
Slipping, but no collapse yet. Should be doing better with lower gas prices.

[top][end]

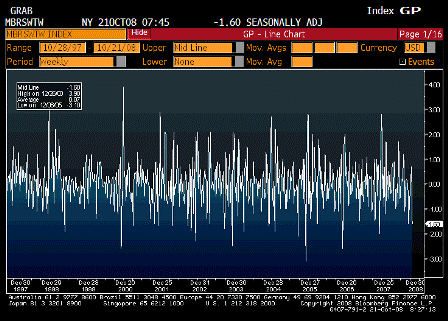
ICSC UBS Store Sales WoW (Oct 21)

Survey n/a
Actual -1.60
Prior .70
Revised n/a

[top][end]

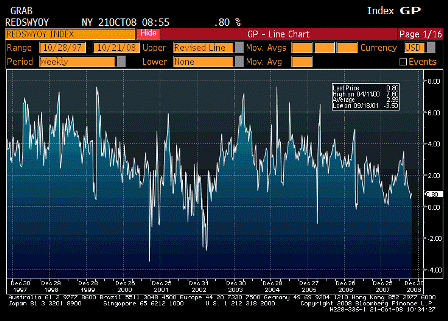
Redbook Store Sales Weekly YoY (Oct 21)

Survey n/a
Actual .80
Prior .50
Revised n/a

 
Low but steady.

[top][end]

Redbook Store Sales MoM (Oct 21)

Survey n/a
Actual -1.10
Prior -1.20
Revised n/a

[top][end]

ICSC UBS Redbook Comparison TABLE (Oct 21)


[top]
2008-10-07 USER


[Skip to the end]

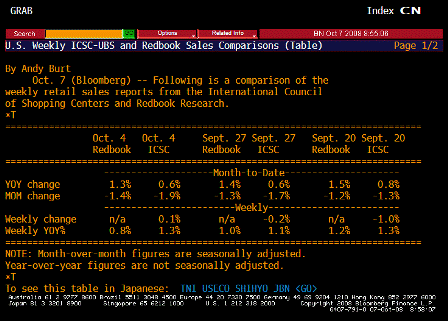
ICSC UBS Store Sales YoY (Oct 7)

Survey n/a
Actual 1.30%
Prior 1.10%
Revised n/a

 
No collapse here yet.

[top][end]

ICSC UBS Store Sales WoW (Oct 7)

Survey n/a
Actual 0.10%
Prior -0.20%
Revised n/a

 
Muddling through here as well.

[top][end]


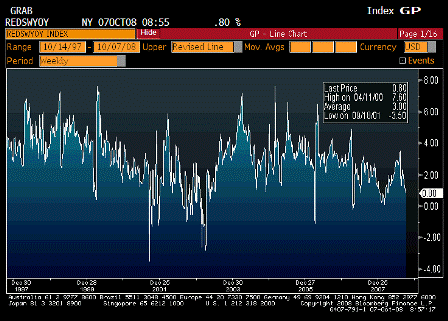
Redbook Store Sales Weekly YoY (Oct 7)

Survey n/a
Actual 0.80%
Prior 1.00%
Revised n/a

 
Still weak, but not yet a collapse.

[top][end]

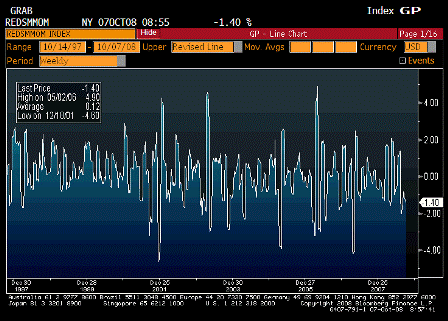
Redbook Store Sales MoM (Oct 7)

Survey n/a
Actual -1.40%
Prior -1.30%
Revised n/a

 
Also weakening.

[top][end]

ICSC UBS Redbook Comparison TABLE (Oct 7)

[top][end]


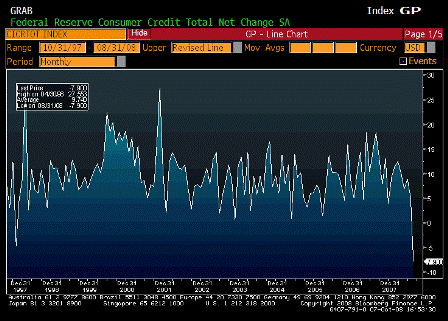
Consumer Credit (Aug)

Survey $5.0B
Actual -$7.9B
Prior $4.6B
Revised $5.2B

 
This is a collapse!

Consumers petrified from daily drubbing of the stock market and news media.

Payroll tax holiday now!

[top][end]

Consumer Credit TABLE 1 (Aug)

[top][end]

Consumer Credit TABLE 2 (Aug)


[top]