2008-05-20 US Economic Releases


[Skip to the end]


Whether the ‘definitions’ call the food and energy price hikes ‘inflation’ or not, they are still problematic.

There are two choices for government: try to sustain aggregate demand or try to reduce aggregate demand.

Currently, the policy is to say ‘inflation’ is not a problem and try to sustain aggregate demand, as evidenced by the tax rebates and Fed rate cuts.
(NOTE: I don’t think rate cuts add to demand, but the Fed does.)

And as oil climbs in price, markets discount lower rates from the Fed (markets also think lower rates add to demand).

And, for another fiscal example, Obama speaks of tax cuts for the middle class so people can pay for their food and energy. Adding to demand like that will drive prices up further.

Supply responses aren’t particularly price sensitive in the short run; so, crude could go up a lot more before something like pluggable hybrids in sufficient quantities cut demand for gasoline by the 5-10 million bpd necessary to break the rise in crude prices.

And by that time the pass throughs to the rest of the economy (yes, including housing and wages) will be well entrenched.

The other choice for government is to cut aggregate demand. This means tax hikes or spending cuts, and a deep, ugly recession to hopefully cut demand for gasoline that way. Looks even more painful and less promising, if that’s possible.

I have suggested cutting demand for gasoline with a ‘non-price’ policy of setting the national speed limit at 30 mph for private transportation. This is a conceptual extension of policies mandating mpg, etc. It will cut gasoline demand by perhaps 5 million bpd and if adopted world wide more than that, but has yet to even enter the national debate.

So it will be a debate between adding to aggregate demand and cutting aggregate demand – like choosing whether you want to get shot with a revolver or an automatic.

The days are numbered for current bias to add to demand – the limits of ‘inflation’ tolerance aren’t far away. We are only now probably seeing the pass through from $60 crude. There is much more to come, and for several years. And in hindsight, the current policy of adding to demand will at best be considered an error of judgment.


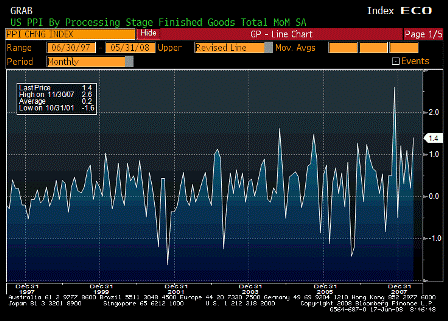
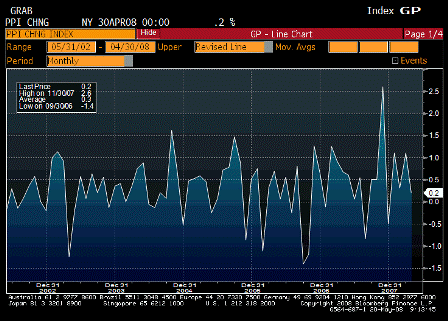
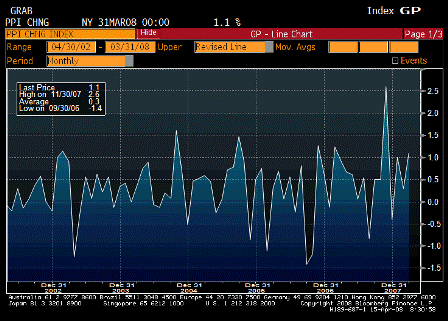
2008-05-20 Producer Price Index MoM

Producer Price Index MoM (Apr)

Survey 0.4%
Actual 0.2%
Prior 1.1%
Revised n/a

[top][end]


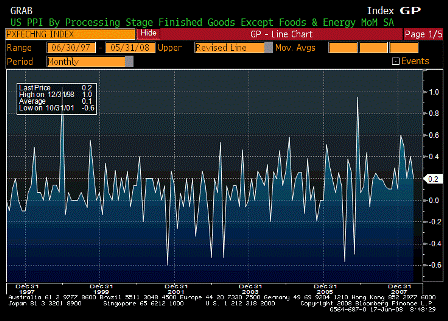
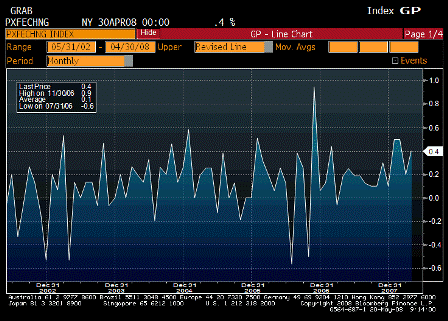
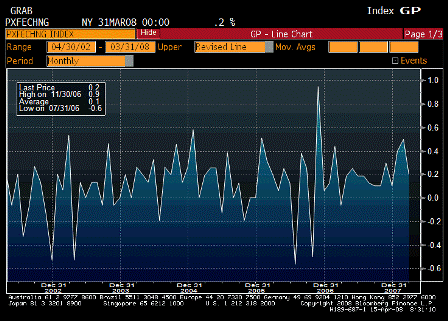
2008-05-20 PPI Ex Food & Energy MoM

PPI Ex Food & Energy MoM (Apr)

Survey 0.2%
Actual 0.4%
Prior 0.2%
Revised n/a

[top][end]


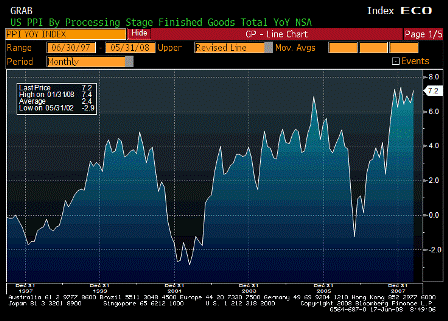
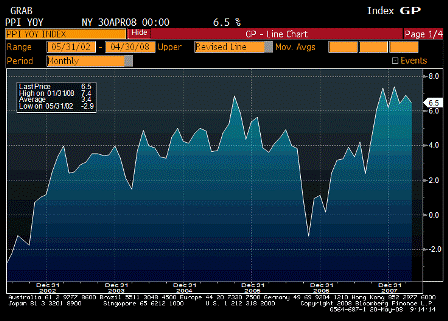
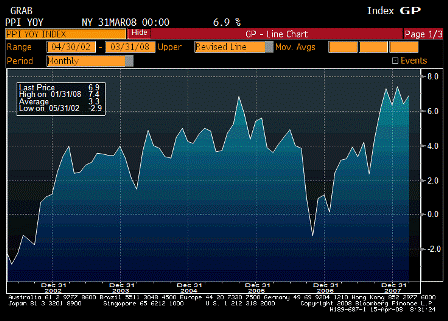
2008-05-20 Producer Price Index YoY

Producer Price Index YoY (Apr)

Survey 6.7%
Actual 6.5%
Prior 6.9%
Revised n/a

This all either gets passed through to all other prices (inflation) or real terms of trade deteriorate further – both unpleasant at best.

[top][end]


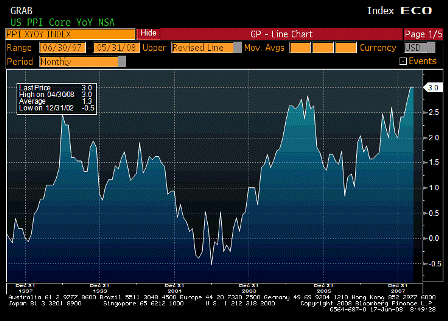
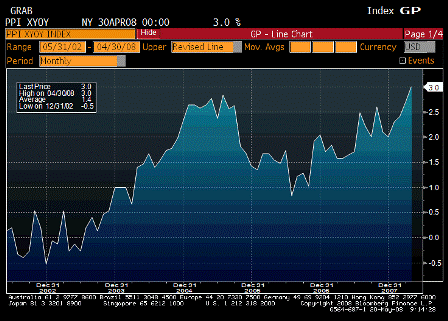
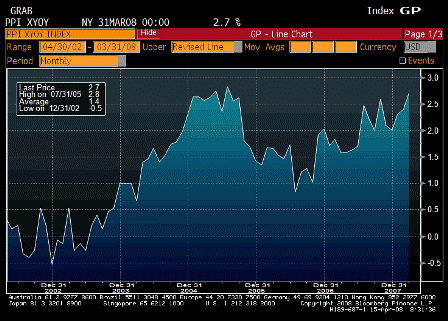
2008-05-20 PPI Ex Food & Energy YoY

PPI Ex Food & Energy YoY (Apr)

Survey 2.9%
Actual 3.0%
Prior 2.7%
Revised n/a

The pass through has started and has long way to go just based on current energy prices.

[top][end]


IBD/TIPP Economic Optimism (May)

Survey 37.8
Actual 40.3
Prior 39.2
Revised

Add one more to the ‘better than expected’ list.

[top][end]


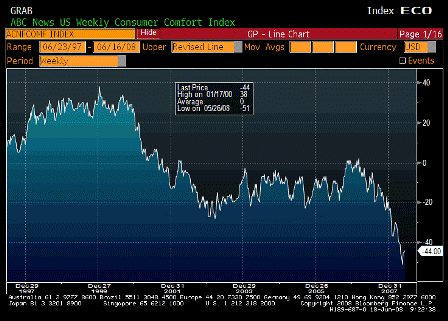
ABC Consumer Confidence (May 18)

Survey
Actual
Prior 2.9%
Revised

[comments]


[top]
2008-04-15 US Economic Releases

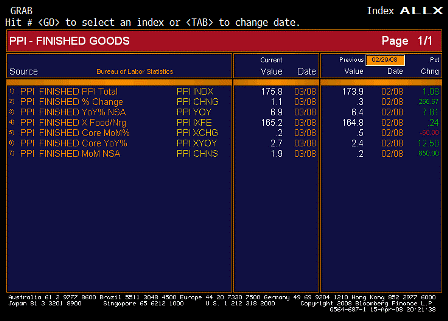
  • Producer Price Index
  • Empire Manufacturing
  • NAHB Housing Market Index
  • ABC Consumer Confidence

2008-04-15 Producer Price Index MoM

Producer Price Index MoM (Mar)

Survey 0.6%
Actual 1.1%
Prior 0.3%
Revised n/a

2008-04-15 PPI Ex Food & Energy MoM

PPI Ex Food & Energy MoM (Mar)

Survey 0.2%
Actual 0.2%
Prior 0.5%
Revised n/a

2008-04-15 Producer Price Index YoY

Producer Price Index YoY (Mar)

Survey 6.2%
Actual 6.9%
Prior 6.4%
Revised n/a

2008-04-15 PPI Ex Food & Energy YoY

PPI Ex Food & Energy YoY (Mar)

Survey 2.8%
Actual 2.7%
Prior 2.4%
Revised n/a

2008-04-15 Producer Price Index TABLE

Producer Price Index TABLE

Inflation ripping.

From Karim:

Headline/Core divergence continues

  • Headline up 1.1% m/m and 6.9% y/y

  • Core up 0.2% m/m and 2.7% y/y

  • Food (+1.2%) and gas (+1.3%) lead the way up, computers (-3.2%) and passenger cars (-0.2%) lead the way down.

  • Intermediate and crude pressures remain intense, rising 2.3% and 8.0% respectively for the month

  • Further margin squeeze likely to put further downward pressure on capex, especially in light of weak economy and credit conditions (see below)

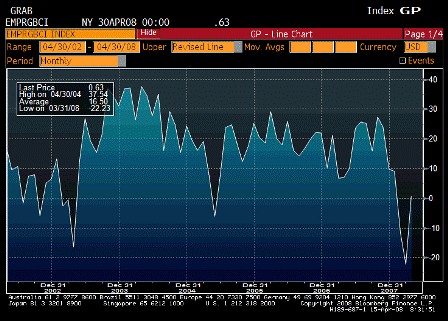
Empire jumps from -22.2 to 0.6. Index quite volatile and 10-20 point moves per month the norm as of late.

6mth expectations deteriorate from 25.8 to 19.6.

  • Shipments show largest jump from -5 to +17 (for current conditions)

  • Employment and average workweek both extremely weak

  • Capex intentions fall from 18 to 11.5

2008-04-15 Empire Manufacturing

Empire Manufacturing (Apr)

Survey -17.0
Actual 0.6
Prior -22.2
Revised n/a

Survey is colored by subjective recessions fears bouncing back some.


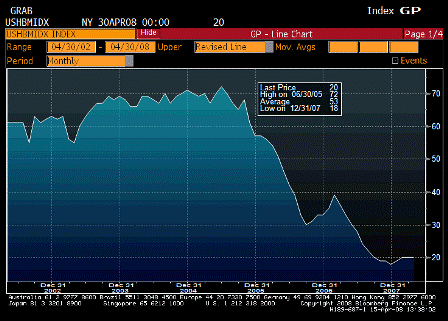
2008-04-15 NAHB Housing Market Index

NAHB Housing Market Index (Apr)

Survey 20
Actual 20
Prior 20
Revised n/a

Still looks to me like a bottom.


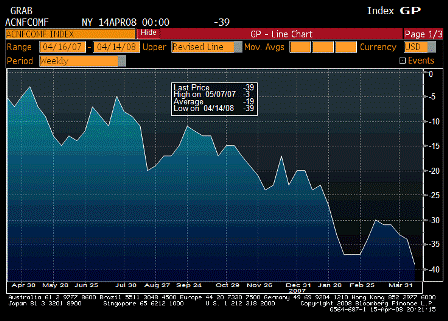
2008-04-15 ABC Consumer Confidence

ABC Consumer Confidence (Apr 13)

Survey n/a
Actual -39
Prior -34
Revised n/a

Still looking weak. Much like an export economy

2008-03-18 US Economic Releases

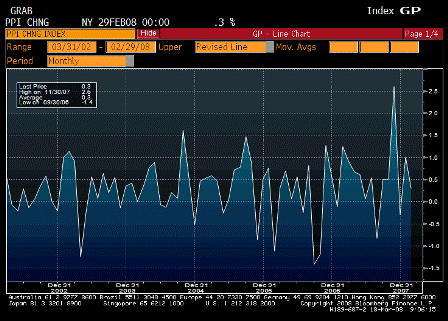
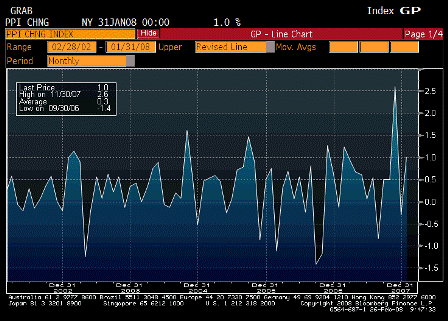
2008-03-18 Producer Price Index MoM

Producer Price Index MoM (Feb)

Survey 0.4%
Actual 0.3%
Prior 1.0%
Revised n/a

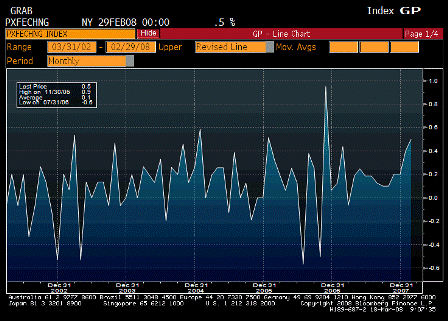
2008-03-18 PPI Ex Food & Energy MoM

PPI Ex Food & Energy MoM (Feb)

Survey 0.2%
Actual 0.5%
Prior 0.4%
Revised n/a

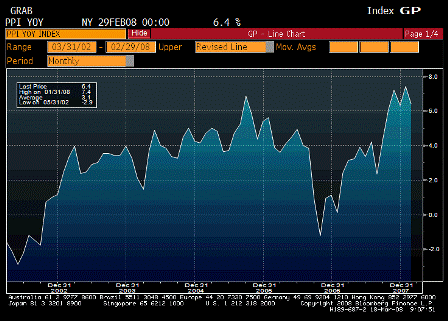
2008-03-18 Producer Price Index YoY

Producer Price Index YoY (Feb)

Survey 6.8%
Actual 6.4%
Prior 7.4%
Revised n/a

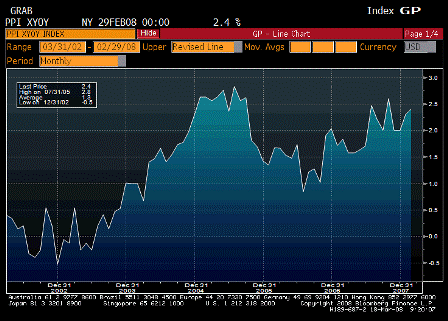
2008-03-18 PPI Ex Food & Energy YoY

PPI Ex Food & Energy YoY (Feb)

Survey 2.1%
Actual 2.4%
Prior 2.3%
Revised n/a

Troubling as the Fed has indicated it’s getting passed through to core CPI measures.


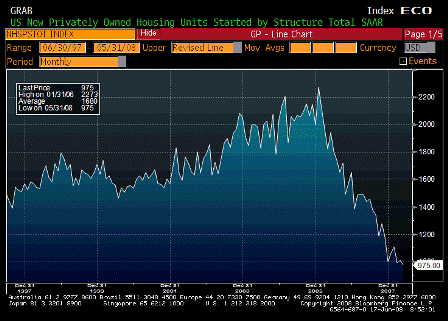
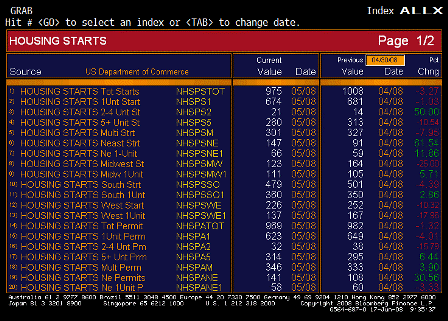
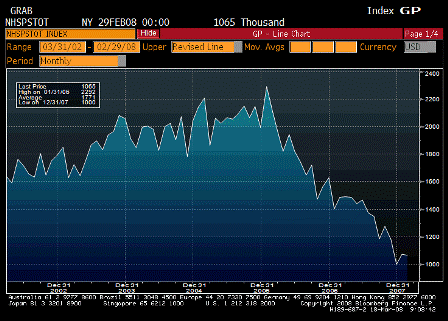
2008-03-18 Housing Starts

Housing Starts (Feb)

Survey 995K
Actual 1065K
Prior 1012K
Revised 1071K

More indications of a possible bottom in housing, meaning it won’t be subtracting as much from GDP for the rest of the year.

Karim Basta:

Housing starts fall 0.6% in Feb, but January revised higher by 5.8%.

One notable trend is single vs multi-family starts. The latter has now risen for 3 straight months, whereas the former continues to decline across most regions. A couple explanations out there-foreclosures, real income weakness driving trend towards apartments/condos vs homes.

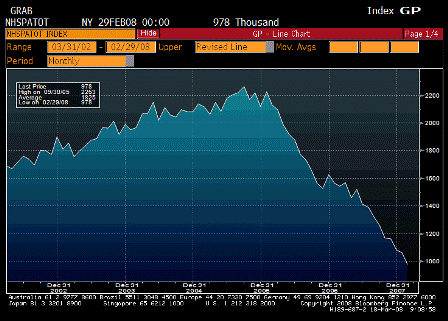
Permits fall another 7.8%; suggesting more declines in housing contribution to GDP going forward.

Margin squeeze evident in PPI as headline rises 0.3% and core by 0.5%.


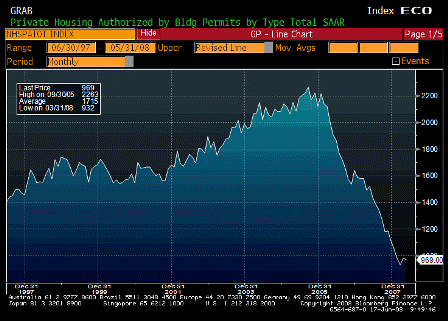
2008-03-18 Building Permits

Building Permits (Feb)

Survey 1020K
Actual 978K
Prior 1048K
Revised 1061K

Looking down, but the prior revision might be more relevant.


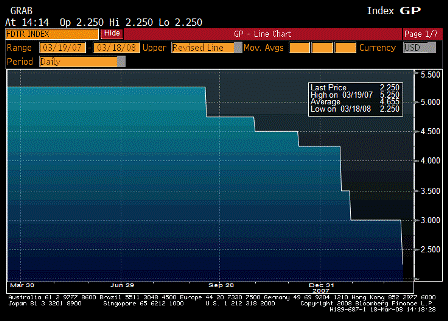
2008-03-18 FOMC Rate Decision

FOMC Rate Decision (Mar 18)

Survey 2.25%
Actual 2.25%
Prior 3.00%
Revised n/a

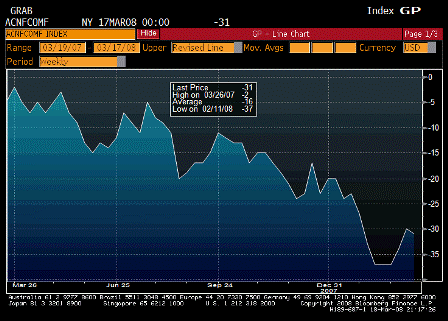
2008-03-18 ABC Consumer Confidence

ABC Consumer Confidence (Mar 16)

Survey n/a
Actual -31
Prior -30
Revised n/a

Yet another chart that may have bottomed?

2008-02-26 US Economic Releases

2008-02-26 Producer Price Index MoM

Producer Price Index MoM (Jan)

Survey 0.4%
Actual 1.0%
Prior -0.1%
Revised -0.3%

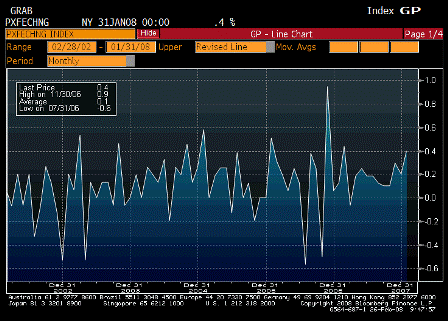
2008-02-26 PPI Ex Food & Energy MoM

PPI Ex Food & Energy MoM (Jan)

Survey 0.2%
Actual 0.4%
Prior 0.2%
Revised n/a

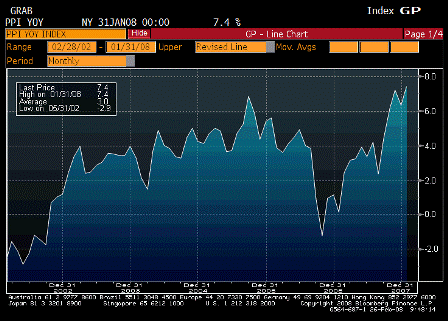
2008-02-26 Producer Price Index YoY

Producer Price Index YoY (Jan)

Survey 7.3%
Actual 7.4%
Prior 6.3%
Revised n/a

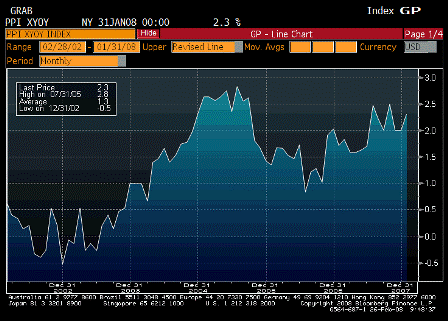
2008-02-26 PPI Ex Food & Energy YoY

PPI Ex Food & Energy YoY (Jan)

Survey 2.2%
Actual 2.3%
Prior 2.0%
Revised n/a

To high for the Fed and looking higher. Kohn speaking next today.

In the early 70’s inflation kept going up, even after crude flattened out for several years after a fivefold+ jump,


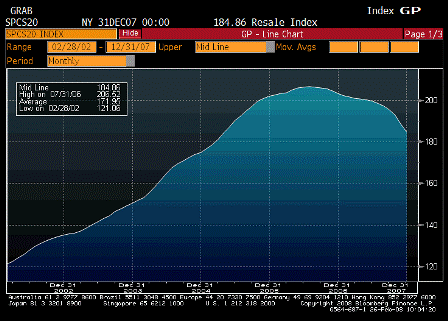
2008-02-26 S&P-CaseShiller Home Price Index

S&P/CaseShiller Home Price Index (Dec)

Survey n/a
Actual 184.9
Prior 188.8
Revised 188.9

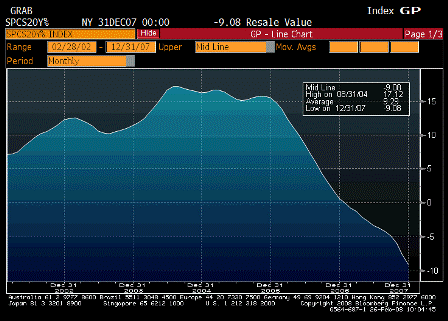
2008-02-26 S&P-CS Composite-20 YoY

S&P/CS Composite-20 YoY (Dec)

Survey -9.7%
Actual -9.1%
Prior -7.7%
Revised n/a

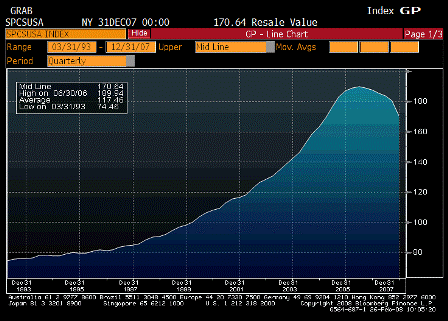
2008-02-26 S&P-CS US HPI

S&P/Case-Shiller US HPI (4Q)

Survey n/a
Actual 170.6
Prior 180.5
Revised 180.3

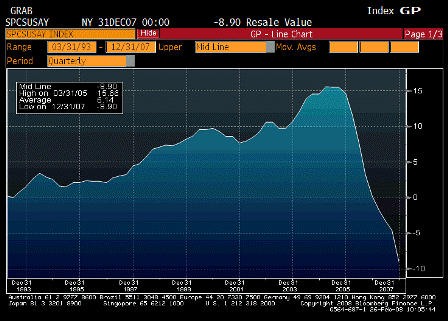
2008-02-26 S&P-CS US HPI YoY%

S&P/Case-Shiller US HPI YoY% (4Q)

Survey n/a
Actual -8.9%
Prior -4.5%
Revised -4.6%

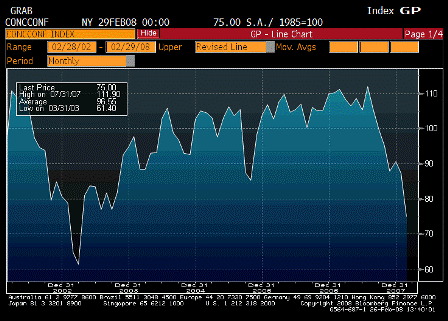
2008-02-26 Consumer Confidence

Consumer Confidence (Feb)

Survey 82.0
Actual 75.0
Prior 87.9
Revised 87.3

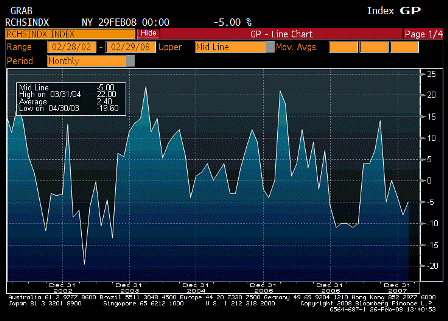
2008-02-26 Richmond Fed Manufact. Index

Richmond Fed Manufact. Index (Feb)

Survey -12
Actual -5
Prior -8
Revised n/a

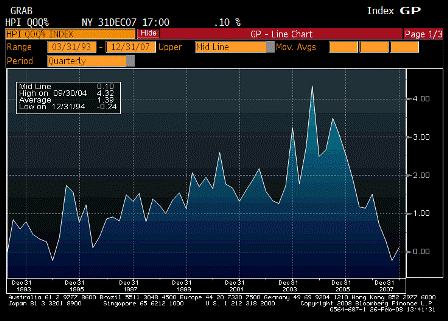
2008-02-26 Housing Price Index QoQ

House Price Index QoQ (4Q)

Survey -1.0%
Actual 0.1%
Prior -0.4%
Revised -0.2%

Not released yet..

ABC Consumer Confidence (Feb 24)

Survey
Actual
Prior -37
Revised

[comments]


2008-01-15 US Economic Releases

2008-01-15 Producer Price Index MoM

Producer Price Index MoM (Dec)

Survey 0.2%
Actual -0.1%
Prior 3.2%
Revised n/a

2008-01-15 PPI Ex Food & Energy MoM

PPI Ex Food & Energy MoM (Dec)

Survey 0.2%
Actual 0.2%
Prior 0.4%
Revised n/a

2008-01-15 Producer Price Index YoY

Producer Price Index YoY (Dec)

Survey 7.1%
Actual 6.3%
Prior 7.2%
Revised n/a

2008-01-15 PPI Ex Food & Energy YoY

PPI Ex Food & Energy YoY (Dec)

Survey 2.0%
Actual 2.0%
Prior 2.0%
Revised n/a

Inflation pressures remain alarming.

2007 highest inflation since the early 1980s, when inflation was on the way down.

Last hit this number on the way up was in the 1970s.


2008-01-15 Advance Retail Sales

Advance Retail Sales (Dec)

Survey 0.0%
Actual -0.4%
Prior 1.2%
Revised 1.0%

Previous month still very high, two month average looks OK.


2008-01-15 Retail Sales YoY % Change

Retail Sales YoY % Change

Year over year numbers still modestly moving back up.


2008-01-15 Retail Sales Less Autos

Retail Sales Less Autos (Dec)

Survey -0.1%
Actual -0.4%
Prior 1.8%
Revised 1.7%

Same as above.


2008-01-15 Empire Manufacturing

Empire Manufacturing (Jan)

Survey 10.0
Actual 9.0
Prior 10.3
Revised 9.8

2008-01-15 Empire Manufacturing TABLE

Empire Manufacturing TABLE

A close look at the table shows prices still very strong.


2008-01-15 Business Inventories

Business Inventories (Nov)

Survey 0.4%
Actual
Prior 0.1%
Revised

Chart looks OK – no excessive build.


Data not in, until 5PM EST..

ABC Consumer Confidence (Jan 13)

Survey -21
Actual
Prior -20
Revised

♥

2007-12-13 US Economic Releases

2007-12-13 Producer Price Index MoM

Producer Price Index MoM (Nov)

Survey -1.5%
Actual 3.2%
Prior 0.1%
Revised n/a

Off the charts!


2007-12-13 PPI Ex Food & Energy MoM

PPI Ex Food & Energy MoM (Nov)

Survey 0.2%
Actual 0.4%
Prior 0.0%
Revised n/a

Core moving up to headline?
That’s the fed’s worst nightmare now.


2007-12-13 Producer Price Index YoY

Producer Price Index YoY (Nov)

Survey 6.0%
Actual 2.0%
Prior 2.5%
Revised n/a

Moving higher from an already too high number.


2007-12-13 PPI Ex Food & Energy YoY

PPI Ex Food & Energy YoY (Nov)

Survey 1.8%
Actual 2.0%
Prior 3.5%
Revised n/a

The ‘anchor’ is slipping.


2007-12-13 Advance Retail Sales

Advance Retail Sales (Nov)

Survey 0.6%
Actual 1.2%
Prior 0.2%
Revised n/a

Consumer spent above energy price hikes.
Reserves the softness of the 0.2% spending number reported for October.


2007-12-13 Retail Sales Less Auto

Retail Sales Less Auto (Nov)

Survey 0.6%
Actual 1.8%
Prior 0.2%
Revised 0.4%

Very strong.


2007-12-13 Initial Jobless Claims

Initial Jobless Claims (Dec 1)

Survey 335K
Actual 333K
Prior 338K
Revised 340K

Fed sees no slack in the labor markets.


2007-12-13 Continuing Claims

Counting Claims (Dec 1)

Survey 2599K
Actual 2639K
Prior 2599K
Revised 2601K

Some weakness here but overwhelmed by the other numbers being reported.


2007-12-13 Business Inventories

Business Inventories (Oct)

Survey 0.3%
Actual 0.1%
Prior 0.4%
Revised n/a

No obvious signals here.


♥