2008-04-17 US Economic Releases

  • Initial Jobless Claims
  • Continuing Claims
  • Leading Indicators
  • Philadelphia Fed.

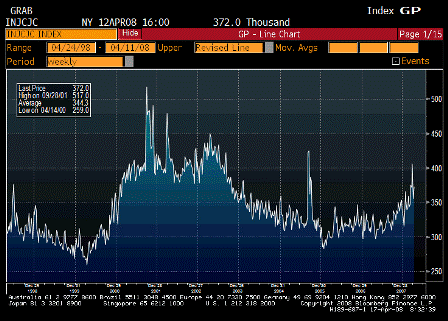
2008-04-17 Initial Jobless Claims

Initial Jobless Claims (Apr 12)

Survey 375K
Actual 372K
Prior 357K
Revised 355K

Not impossible that this spike to over 400,000 might be ending, much like in 2005, this time with help from a fiscal package and and government spending moved forward from 2007 to 2008.


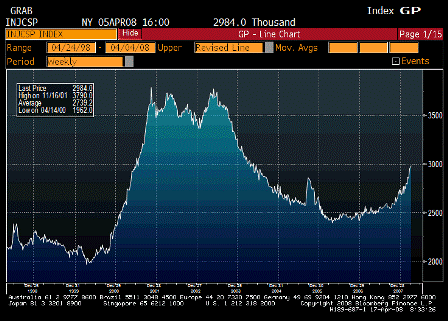
2008-04-17 Continuing Claims

Continuing Claims (Apr 5)

Survey 2950K
Actual 2984K
Prior 2940K
Revised 2958K

This lags the claims a bit, and could go further, but still not looking like recession type levels


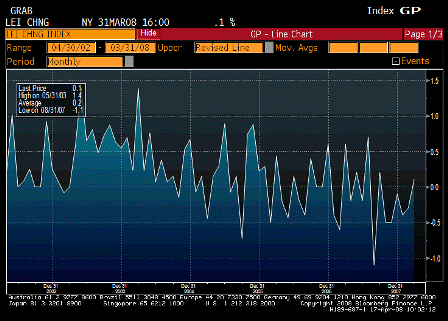
2008-04-17 Leading Indicators

Leading Indicators (Mar)

Survey 0.1%
Actual 0.1%
Prior -0.3%
Revised n/a

The future is starting to look a touch better, and the Fed uses ‘forward looking’ models.


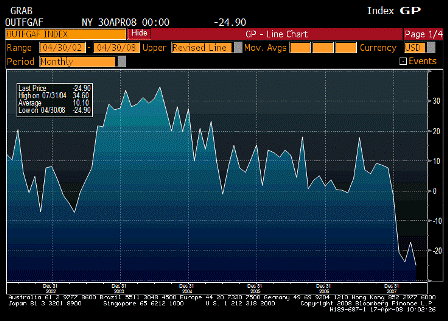
2008-04-17 Philadelphia Fed.

Philadelphia Fed. (Apr)

Survey -15.0
Actual -24.9
Prior -17.4
Revised n/a

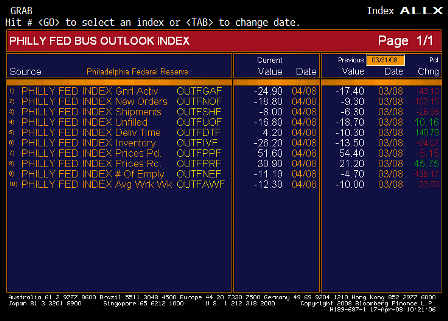
2008-04-17 Philadelphia Fed. TABLE

Philadelphia Fed. TABLE

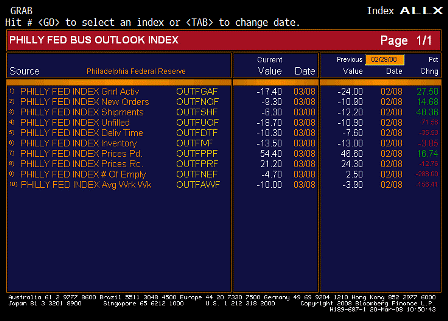
The Phili area is still in a ‘soft spot’ with only prices paid showing real strength.

Twin themes remain from Q2 06: weakness and higher prices.

2008-03-20 US Economic Releases

2008-03-20 Initial Jobless Claims

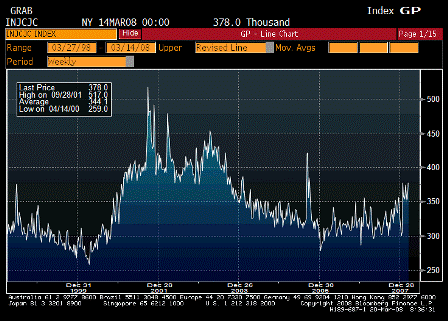
Initial Jobless Claims (Mar 15)

Survey 360K
Actual 378K
Prior 353K
Revised 356K

This has been trending higher but still not at recession levels.

(This series is not population adjusted so an upward drift over time is neutral.)

The American Axle strike also had some impact that will be reversed.


2008-03-0 Continuing Claims

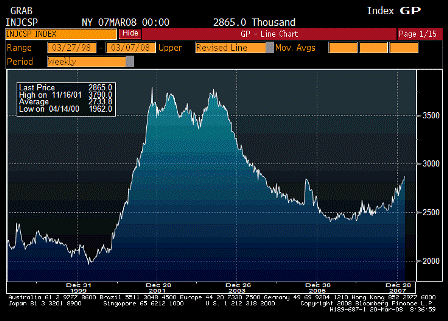
Continuing Claims (Mar 8)

Survey 2840K
Actual 2865K
Prior 2835K
Revised 2833K

This series is also not at recession levels but is a lagging indicator.

It shows the job situation has been weakening since Q3.

This is what export economies tend to look like – labor markets always have a bit of slack, and domestic consumption is relatively low as the population works, gets paid, and can’t afford to consume its own output domestically, with the balance getting exported.

And GDP muddles through.


2008-03-20 Philadelphia Fed.

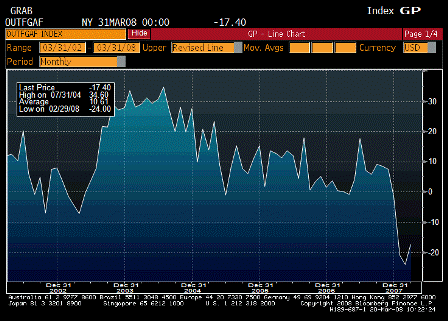
Philadelphia Fed. (Mar)

Survey -19.0
Actual -17.4
Prior -24.0
Revised n/a

2008-03-20 Philadelphia Fed. TABLE

Philadelphia Fed. TABLE

Better than forecast, some improvement, but still negative numbers.

For another rate cut, numbers have to come in worse than forecast.

Prices show continuing upward pressures. Fed needs these to level off.

Karim Basta:

  • Headline stays very weak at -17.4 (from -24)
  • Prices paid rises from 46.6 to 54.4 but Prices received drops from 24.3 to 21.2 (margin squeeze)
  • Employment drops from +2.5 to -4.7; emerging consensus of -50k drop in March payrolls
  • Workweek drops from -3.9 to -10
  • Special survey question on Q2 growth expectations: 0%

2008-03-20 Leading Indicators

Leading Indicators (Feb)

Survey -0.3%
Actual -0.3%
Prior -0.1%
Revised -0.4%

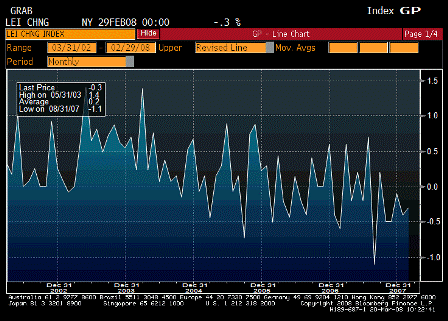
As expected, continuing weakness.

Stock market still the most reliable leading indicator.

2008-02-21 US Economic Releases

2008-02-21 Initial Jobless Claims

Initial Jobless Claims (Feb 16)

Survey 349K
Actual 349K
Prior 348K
Revised 358K

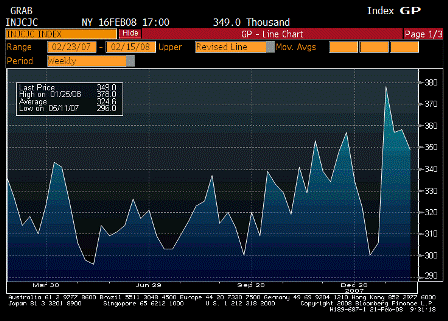
Down a bit but lost a day in California. Chart looks like it’s drifted to a bit higher levels.

Still not recession type numbers yet, however.


2008-02-21 Continuing Claims

Continuing Claims (Feb 9)

Survey 2760K
Actual 2784
Prior 2761K
Revised 2736

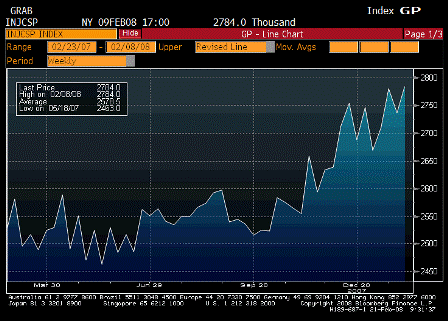
Also looking like it’s moved up to higher levels, but still far from typical recession levels.


2008-02-21 Philadelphia Fed.

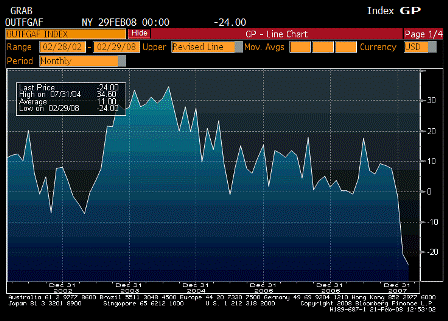
Philadelphia Fed. (Feb)

Survey -10.0
Actual -24.0
Prior -20.9
Revised n/a

Looks serious!  Strange that employment was up 2.5, however, and, of course, prices on the rise.


2008-02-21 Leading Indicators

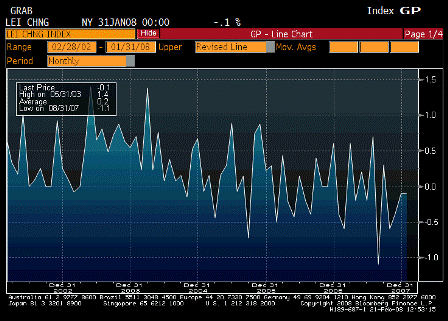
Leading Indicators (Jan)

Survey -0.1%
Actual -0.1%
Prior -0.2%
Revised -0.1%

Still drifting lower, but no collapse.

2008-01-17 US Economic Releases

2008-01-17 Housing Starts

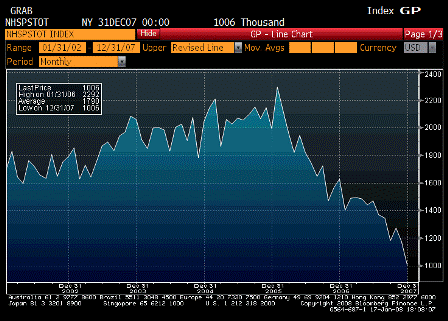
Housing Starts (Dec)

Survey 1145K
Actual 1006K
Prior 1187K
Revised 1173K

2008-01-17 Building Permits

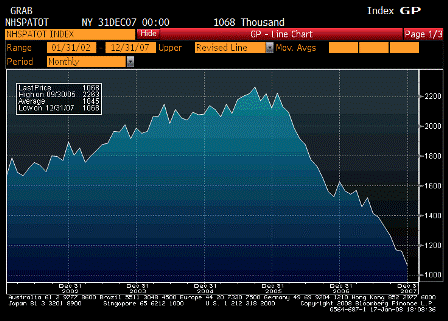
Building Permits (Dec)

Survey 1135K
Actual 1068K
Prior 1152K
Revised 1162K

Both still in free fall – may be weather distorted some, but they don’t look good.


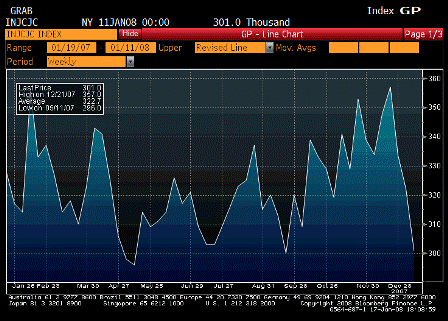
2008-01-17 Initial Jobless Claims

Initial Jobless Claims (Jan 12)

Survey 331K
Actual 301K
Prior 322K
Revised n/a

All the way back down. Seems out of line with housing and Philly Fed.

Could be the government spending kicking in that will subsequently support housing and other spending. (See previous posts on government spending.)

Spending resuming its growth after sagging for a couple of quarters as spending got moved forward.


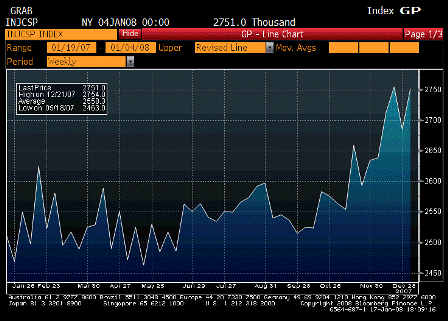
2008-01-17 Continuing Claims

Continuing Claims (Jan 5)

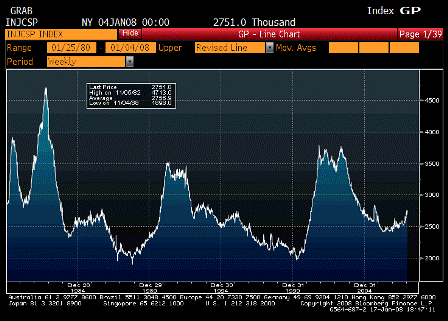
2008-01-17 Continuing Claims from 1980

Continuing Claims since 1980

Survey 2750K
Actual 2751K
Prior 2702K
Revised 2685K

Back up, but this is a tiny blip on the longer term chart.


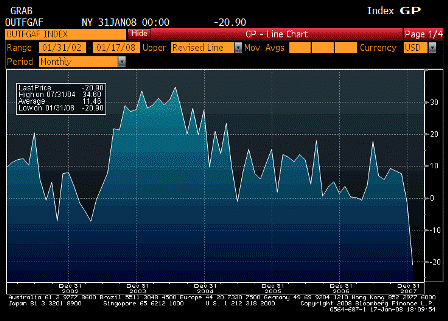
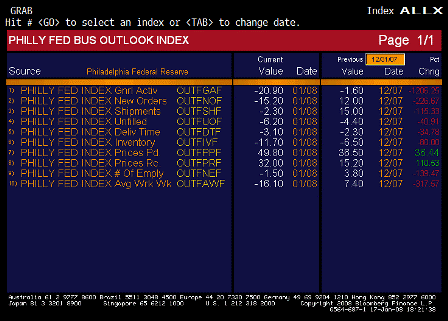
2008-01-17 Philadelphia Fed.

Philadelphia Fed. (Jan)

Survey -1.0
Actual -20.9
Prior -5.7
Revised n/a

Falling off a cliff.


2008-01-17 Philadelphia Fed. TABLE

Philadelphia Fed. TABLE

Weakness in every category – except prices paid and received, which skyrocketed.

Adds to the fed’s dilemma.


♥