Personal Income and Consumption, Employment reports and productivity


Full size image

Highlights
November was an uncertain month for the consumer in terms of sentiment. But in terms of hard numbers, it was a good month. Personal income rebounded 0.2 percent, following a 0.1 percent dip in October. But the important wages and salaries component improved to a 0.4 percent gain in November after rising 0.1 percent the month before.

Spending also accelerated a bit, jumping 0.5 percent after a 0.4 percent boost in October. No surprise, the latest gain was led by durables (largely motor vehicles) up 1.9 percent, following a 1.0 percent increase in October. Nondurable declined 0.4 percent after a 0.4 percent decrease in October. Lower gasoline prices likely played a role in November. Services jumped 0.6 in November, following a 0.3 percent rise the prior month.

Employment and Productivity

The Non Farm Payroll chart shows employment growth of about 1.7%. The Household survey has been indicating less than 1%.

And while the Payroll chart is arguably the far more reliable indicator because it’s far larger with about 145,000 businesses reporting, vs a survey of 60,000 households, and is actual reports vs survey questions. Also, the household survey is just about how many people are working, while the payroll survey is the number of jobs, even if one person is holding down more than one job.

But with year over year real GDP growth of about 2%, the Payroll report is implying near 0 productivity increases, while the household survey is implying and overall productivity gain of over 1%.


Full size image


Full size image

Employment and personal income

Employment continues to grow at the pace we’ve seen for the last couple of years at a pace that’s perhaps a bit ahead of population growth (chart).

The question is whether this is sufficient for the Fed to taper, which I’d say is anyone’s guess right now.

The FOMC clearly doesn’t like QE, but at the same time seems to me they will shy away from doing anything that might cause further increases in mortgage rates?

And for those who believe QE ‘works’ to sustain growth (or, as some believe, bring it back from the future), they have to be very concerned that with all the QE they’ve done this is all we have to show for it, wondering how bad it would have been without the QE, or what might happen if they back off.

October personal Income also was released at 8:30am and was weaker than expected, with the govt. shutdown likely a factor, so, as it’s been for a while, it’s a matter of waiting for cleaner data.

Inflation indicators continued weak as well, further complicating the tapering debate:

Personal Income and Outlays:

Highlights:
Overall consumer spending picked up a bit as expected at the beginning of the fourth quarter but not by much, to plus 0.3 percent in October vs plus 0.2 percent in September. Strength was in durable goods reflecting strong auto sales. Smaller gains were posted for nondurable goods and services.

The income side of the report is especially soft, at minus 0.1 percent following two very strong months at plus 0.5 percent. The decline is the first since January and may be related to the impact of the government shutdown on private wages. Wages & salaries are especially soft, up only 0.1 percent following gains of 0.4 and 0.6 percent in the two prior months.

Inflation readings are very soft with the price index unchanged and the core index up only 0.1 percent. The year-on-year rate for the price index is only plus 0.7 percent with the core year-on-year rate at plus 1.1 percent, both declining in the month and both well below the Fed’s goal of 2 percent.

PCE Deflator Graph
Personal Income Y/Y Graph

Economy Faces a Jolt as Benefit Checks Run Out

When there is a lack of aggregate demand due to high ‘savings desires’ as the unemployed take jobs when benefits expire, it just means someone else loses a job, and then some, as govt deficit spending falls as well, further reducing aggregate demand. It also serves to drive down wages, as per the latest jobs report.

Economy Faces a Jolt as Benefit Checks Run Out

By Motoko Rich

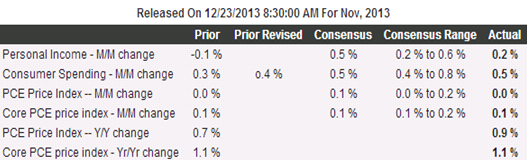
July 11 (NYT) — An extraordinary amount of personal income is coming directly from the government.

Close to $2 of every $10 that went into Americans’ wallets last year were payments like jobless benefits, food stamps, Social Security and disability, according to an analysis by Moody’s Analytics. In states hit hard by the downturn, like Arizona, Florida, Michigan and Ohio, residents derived even more of their income from the government.

By the end of this year, however, many of those dollars are going to disappear, with the expiration of extended benefits intended to help people cope with the lingering effects of the recession. Moody’s Analytics estimates $37 billion will be drained from the nation’s pocketbooks this year.

In terms of economic impact, that is slightly less than the spending cuts Congress enacted to keep the government financed through September, averting a shutdown.

Unless hiring picks up sharply to compensate, economists fear that the lost income will further crimp consumer spending and act as a drag on a recovery that is still quite fragile. Among the other supports that are slipping away are federal aid to the states, the Federal Reserve’s program to pump money into the economy and the payroll tax cut, scheduled to expire at the end of the year.

“If we don’t get more job growth and gains in wages and salaries, then consumers just aren’t going to have the firepower to spend, and the economy is going to weaken,” said Mark Zandi, chief economist of Moody’s Analytics, a macroeconomic consulting firm.

Job growth has remained elusive. There are 4.6 unemployed workers for every opening, according to the Labor Department, and Friday’s unemployment report showed that employers added an anemic 18,000 jobs in June.

In Arizona, where there are 10 job seekers for every opening, 45,000 people could lose benefits by the end of the year, according to estimates from the state Department of Economic Security. Yet employers in the state have added just 4,000 jobs over the last 12 months.

Some other states will also feel a disproportionate loss of income unless hiring revives. In Florida, where nearly 476,000 people are collecting unemployment benefits, employers have added only 11,200 jobs in the last year. In Michigan, employers have added about 40,000 jobs since May 2010, but about 267,000 people are claiming jobless benefits.

Throughout the recession and its aftermath, government benefits have helped keep money in people’s wallets and, in turn, circulating among businesses. Total government payments rose to $2.3 trillion in 2010, from $1.7 trillion in 2007, an increase of about 35 percent.

While some of that growth was in Social Security and disability benefits as the population aged, the majority resulted from payments to people continuing to suffer from the recession, said Mr. Zandi. Unemployment benefits, including emergency and extended benefits, are more than three times their prerecession level, he said. The nearly 20 percent of personal income now provided by the government is close to a record high.

Approved by Congress last December, the final extension of jobless benefits — for a maximum of 99 weeks for each unemployed person — is scheduled to conclude at the end of this year. A handful of states, like Wisconsin and Arizona, have already cut off weeks 80 through 99 for their residents. Meanwhile, more of the long-term unemployed are bumping up against the 99-week limit.

Consumers account for an estimated 60 to 70 percent of the country’s economic activity, but two years into the official recovery, businesses are still complaining that people simply are not spending enough.

“Regardless of why people have less money to spend, it affects all retailers in all industries,” said Michael Siemienas, spokesman for SuperValu, which operates grocery chains including Cub Foods, Shop ’n Save and Save-A-Lot. Mr. Siemienas said that the number of SuperValu’s customers using electronic benefit transfers to pay bills had grown over the last year.

Because benefit payments tend to be spent right away to cover basic needs like food and rent, they provide a direct boost to consumer spending. In a study for the Labor Department, Wayne Vroman, an economist at the Urban Institute, estimated that every $1 paid in jobless benefits generated as much as $2 in the economy.

For many of the nearly 7.5 million people collecting unemployment benefits, those payments are keeping them afloat. Laura Metz, 42, was laid off from a clerical job paying $15.30 an hour at a home health care provider near her home in Commerce, Mich., nearly 15 months ago. She has been collecting $362 a week in unemployment insurance and about $50 a month in food stamps.

That covers the basics. But Ms. Metz stopped making her mortgage payments last year on the modest home she shares with her 19-year-old son. A program that allowed her to make a lower monthly payment has expired, and she is waiting to see if the lender will modify her loan. She can no longer make her student loan payments for her bachelor’s degree or master’s in business administration, and she has downgraded her Internet and cable service and cut back on car trips and snacks.

Ms. Metz, who has been applying for administrative jobs, has been shocked at the dearth of opportunities. A decade ago, when she applied for clerical jobs, “as soon as I walked up, there was a sign saying ‘We’re hiring,’ but it’s not like that now,” she said. “It’s really, really difficult.”

Businesses that rely heavily on low-income shoppers worry that their customers will have little to spend. Najib Atisha, who co-owns two small grocery stores in Detroit, said people receiving government assistance made up about a third of his customers downtown and as much as 60 percent at his store on the west side of the city.

“Of course, we’re hoping that things will turn around, but it’s always easier to lose jobs than it is to gain jobs,” Mr. Atisha said. “I think it’s going to take twice as long to rebound as it took to get where we are now.”

Some business groups argue that extending unemployment benefits has had deleterious effects on employers and potential workers.

“It’s having a chilling effect on hiring,” said Wendy Block, director of health policy and human resources at the Michigan Chamber of Commerce. “At one point, our unemployment taxes were just a blip on the balance sheet, but when you’re talking over $500 a head, this is significant.” Last year, Michigan spent $6.2 billion on jobless benefits, according to the National Employment Law Center.

Some economic studies show that people who collect unemployment benefits are less likely to look for or accept work until their benefits are close to running out.

“Unemployment insurance extends the typical amount of time that people will spend off the job and not looking for work,” said Chris Edwards, an economist at the Cato Institute, a libertarian organization.

In Michigan, Ms. Metz said that if all else failed, she would have to move in with her parents, who live on a fixed income. But she is determined to find work before her benefits run out and plans to expand her search to include light industrial manufacturing. “It’s getting close to the end,” she said. “And I got to do what I got to do.”

Non-Mfg ISM

With modest GDP growth and a 1.4 trillion deficit downside to equities can only come from an external shock.

High unemployment keeps the Fed on hold and the 0 rate policy keeps costs of production down and keeps personal income gains modest.

At least for now, the combo of 0 rates and an 8%+ budget deficit continues to be supportive of only modest aggregate demand growth and only very modest employment growth.

Again, good for stocks, where a bit of top line growth and productivity gains keep earnings growth positive.


Karim writes:

  • Strong service sector report with particular strength in key components (orders and employment)
  • Employment index crosses 50 and at highest since 2008
  • Service sector picking up growth mantle from manufacturing
  • ADP gain plus upward revision to prior month suggest about 125-150k in private sector job growth


July June
Composite 54.3 53.8
Activity 57.4 58.1
Prices Paid 52.7 53.8
New Orders 56.7 54.4
Employment 50.9 49.7
Export orders 52.0 48.0
Imports 48.0 48.0

PCE/Personal Income

Very good, looks like continuing muddling through with moderate growth unemployment drifting lower in a few months when there are no more hours to add to the existing labor force.

Welcome to Japan, Mr. US bond market?

Ok market for stocks, especially with Euro zone risk fading. Just China h2 risk left, seems.


Karim writes:

PCE data today was encouraging and showed the positive impact of hours on labor income.

Personal income up 0.4% with wage and salary income up 0.5%.

Personal spending up 0.3% and headline deflator unchanged, so strong advance in real consumption spending.

For all the slowdown fears, real private sector demand will be stronger in Q2 than Q1.

Core deflator up .162%, largest advance in 7mths. Recent divergence from core CPI (PCE data has been firmer) reflective of lower weight of housing in PCE data.

Not saying inflation is picking up, just that deflation fears seem overblown.

JPMorgan, Citigroup Expand in ‘Jumbo’ Home Mortgages


[Skip to the end]

Lending follows the markets.

As the economy improves banks and other lenders figure it out and jump in.

Also, today’s news on personal income is very bullish as well.

It shows fiscal policy ‘works’ as it did for q2 last year.

The concern is that the ‘savings rate’ is high which takes away from spending.

Not necessarily.

The ‘savings’ comes from federal deficit spending.

Net federal spending adds financial assets to someone’s account in the non government sector that can’t ‘go away.’

The federal spending can be spent many times over and savings will still go up by the same amount.

So to me it looks like the deficit spending is currently high enough to have sufficiently restored savings to levels that promote at least modest increases in consumption.

But not yet enough to bring unemployment down as the output gap continues to grow.

JPMorgan, Citigroup Expand in ‘Jumbo’ Home Mortgages

by Jody Shenn

June 26 (Bloomberg) —JPMorgan Chase & Co. and Citigroup Inc. are expanding in “jumbo” mortgages used to buy the most expensive homes, helping revive a market that shriveled amid a three-year jump in homeowner defaults.

JPMorgan resumed buying new jumbo loans made by other lenders this month, after halting purchases in March, spokesman Tom Kelly said. Borrowers must have checking accounts with the bank, he said. Citigroup is again offering the loans through independent mortgage brokers, spokesman Mark Rodgers said.


[top]

2009-04-30 USER


[Skip to the end]

 
Karim writes:

  • Initial claims -13k to 631k; continuing claims up another 133k (up every week this year) to 6271k
  • Suggests another 650-700k drop in payrolls and rise in ue rate from 8.5% to 9% for April employment report
  • Those numbers will in turn cause the data we received today on incomes and wages for March, to worsen from already historically weak levels.
  • Personal income -0.3% m/m and +0.3% y/y
  • Wage and salary component of income -0.5% m/m and -1.2% y/y (prior all-time low was -0.3% y/y)
  • Personal spending -0.2%. Q1 profile for real personal spending= +0.9% in Jan, +0.1% in Feb, and -0.2% in Mar. This will create a challenge for the PCE component of GDP for Q2.
  • ECI up 0.3% q/q and 2.1% y/y in Q1, both all-time lows
  • Chicago PMI for April up from 31.4 to 40.1
  • Looks like national ISM should bounce to about 39-40 tomorrow after 36.3
  • Fed comments yesterday seem to echo what I heard from ECB/BOE: Recent bounce in PMIs seem unrelated to prospects for recovery in late 2009/early 2010.


Personal Income MoM (Mar)

Survey -0.2%
Actual -0.3%
Prior -0.2%
Revised n/a

[top][end]

Personal Income YoY (Mar)

Survey n/a
Actual 0.3%
Prior 1.0%
Revised n/a

[top][end]

Personal Income ALLX (Mar)

[top][end]

Personal Spending (Mar)

Survey -0.1%
Actual -0.2%
Prior 0.2%
Revised 0.4%

[top][end]

PCE Deflator YoY (Mar)

Survey 0.7%
Actual 0.6%
Prior 1.0%
Revised 0.9%

[top][end]

PCE Core MoM (Mar)

Survey 0.1%
Actual 0.2%
Prior 0.2%
Revised n/a

[top][end]

PCE Core YoY (Mar)

Survey 1.8%
Actual 1.8%
Prior 1.8%
Revised n/a

[top][end]


Employment Cost Index (1Q)

Survey 0.5%
Actual 0.3%
Prior 0.5%
Revised 0.6%

[top][end]

Employment Cost Index ALLX (1Q)

[top][end]


Initial Jobless Claims (Apr 25)

Survey 640K
Actual 631K
Prior 640K
Revised 645K

[top][end]

Continuing Claims (Apr 18)

Survey 6200K
Actual 6271K
Prior 6137K
Revised 6138K

[top][end]

Jobless Claims ALLX (Apr 25)

[top][end]


Chicago Purchasing Manager (Apr)

Survey 35.0
Actual 40.1
Prior 31.4
Revised n/a

[top][end]

NAPM Milwaukee (Apr)

Survey n/a
Actual 39.0
Prior 30.0
Revised n/a


[top]

2009-03-27 USER


[Skip to the end]


Personal Income MoM (Feb)

Survey -0.1%
Actual -0.2%
Prior 0.4%
Revised 0.2%

 
Karim writes:

  • Personal income down 0.2%, down 4 of last 5mths, and up 1% y/y
  • Wage and salary income down 0.4%, down 4mths in a row, and -0.2% y/y
  • Personal spending up 0.2%, and down 0.2% in real terms
  • Based on Jan-Feb data, real Q1 spending may be flat from -4.3% in Q4
  • But because of weakening trend thru Q1, sets up for another negative in Q2
  • Saw one forecaster change Q1 estimate from -7.2% to -6.5% and leave Q2 estimate unch at -4.8%

[top][end]

Personal Income YoY (Feb)

Survey n/a
Actual 1.0%
Prior 1.4%
Revised n/a

[top][end]

Personal Income ALLX (Feb)

[top][end]

Personal Spending (Feb)

Survey 0.2%
Actual 0.2%
Prior 0.6%
Revised 1.0%

[top][end]

PCE Deflator YoY (Feb)

Survey 0.8%
Actual 1.0%
Prior 0.7%
Revised 0.8%

[top][end]

PCE Core MoM (Feb)

Survey 0.2%
Actual 0.2%
Prior 0.1%
Revised 0.2%

[top][end]

PCE Core YoY (Feb)

Survey 1.6%
Actual 1.8%
Prior 1.6%
Revised 1.7%

[top][end]

U of Michigan Confidence (Mar F)

Survey 56.8
Actual 57.3
Prior 56.6
Revised n/a

 
Karim writes:

  • Final Michigan survey for March showed small upward revision in confidence: 56.6 to 57.3 (Feb was 56.3)
  • 5-10yr inflation expectations revised lower: 2.8 to 2.6 (Feb was 3.1)
  • [top][end]

    U of Michigan Confidence TABLE Inflation Expectations (Feb)


    [top]

More detail on Personal Income gains


[Skip to the end]

This is relentless and tends to cushion downturns:

Personal Income and Outlays

Mar 2 (BEA) — Personal current transfer receipts increased $66.6 billion in January, compared with an increase of $29.9 billion in December. The January change in current transfer receipts reflected 5.8-percent cost-of-living adjustments to social security benefits and to several other federal transfer payment programs; together, these changes added $41.1 billion to the January increase.

Government wage and salary disbursements increased $12.9 billion in January, compared with an increase of $1.4 billion in December. Pay raises for civilian and military personnel added $9.7 billion to government payrolls in January.


[top]

2009-03-02 USER


[Skip to the end]


Personal Income MoM (Jan)

Survey -0.2%
Actual 0.4%
Prior -0.2%
Revised n/a

[top][end]

Personal Income YoY (Jan)

Survey n/a
Actual 1.9%
Prior 1.6%
Revised n/a

[top][end]

Personal Income ALLX (Jan)

[top][end]

Personal Spending (Jan)

Survey 0.4%
Actual 0.6%
Prior -1.0%
Revised n/a

[top][end]

PCE Deflator YoY (Jan)

Survey 0.5%
Actual 0.7%
Prior 0.6%
Revised 0.8%

[top][end]

PCE Core MoM (Jan)

Survey 0.1%
Actual 0.1%
Prior 0.0%
Revised n/a

[top][end]

PCE Core YoY (Jan)

Survey 1.6%
Actual 1.6%
Prior 1.7%
Revised n/a

[top][end]

ISM Manufacturing (Feb)

Survey 33.8
Actual 35.8
Prior 35.6
Revised n/a

[top][end]

ISM Prices Paid (Feb)

Survey 33.5
Actual 35.8
Prior 35.6
Revised n/a

[top][end]

Construction Spending MoM (Jan)

Survey -1.5%
Actual -3.3%
Prior -1.4%
Revised -2.4%

[top][end]

Construction Spending YoY (Jan)

Survey n/a
Actual -9.1%
Prior -6.7%
Revised n/a


[top]