2008-05-08 US Economic Releases


[Skip to the end]


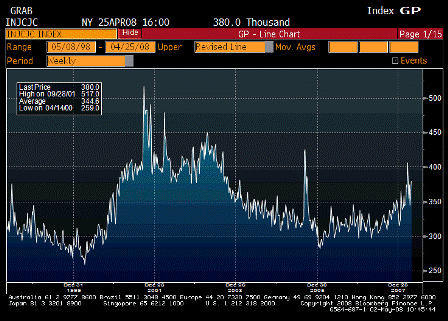
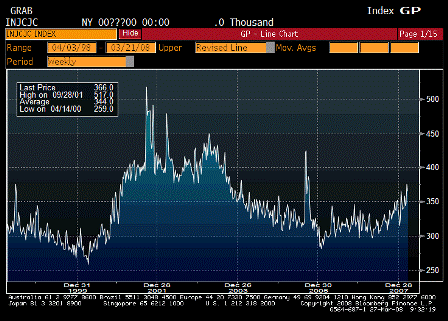
2008-05-08 Initial Jobless Claims

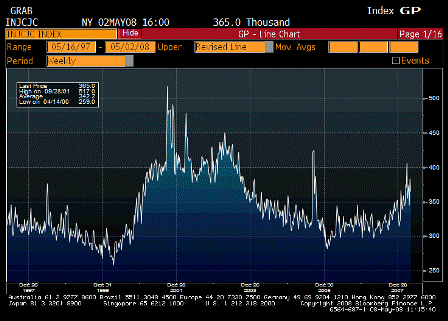
Initial Jobless Claims (May 3)

Survey 370K
Actual 365K
Prior 380K
Revised 383K

Still far from recession levels anticipated several months ago by most forecasters.

[top][end]


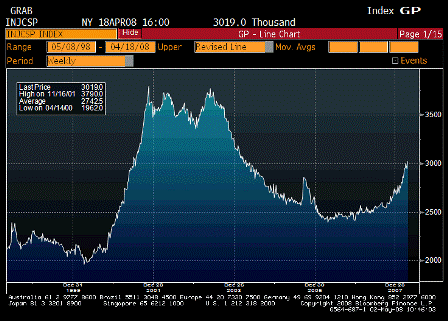
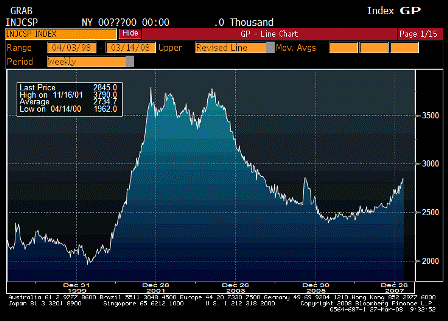
2008-05-08 Continuing Claims

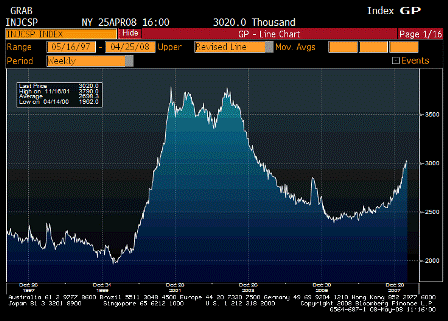
Continuing Claims (Apr 26)

Survey 3020K
Actual 3020K
Prior 3019K
Revised 3030K

Far from recession levels but the chart is still looking higher. This often lags initial claims.

[top][end]


2008-05-08 Wholesale Inventories

Wholesale Inventories (Mar)

Survey 0.5%
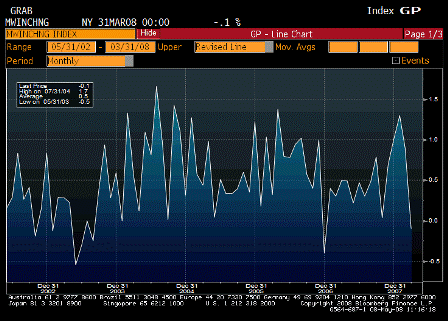
Actual -0.1%
Prior 1.1%
Revised 0.9%

Another sign that the odds of a recession are lower than anticipated a few months ago.

[top][end]


2008-05-08 ICSC Chain Store Sales YoY

ICSC Chain Store Sales YoY

Survey n/a
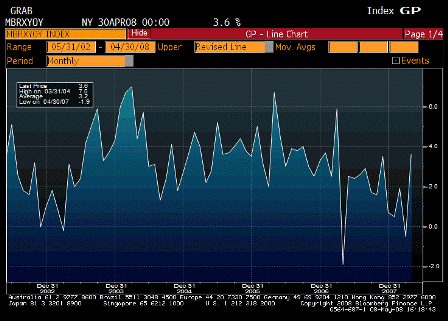
Actual 3.6%
Prior -0.5%
Revised n/a

More evidence the worst is over, and recession was never in the cards.


[top]

2008-05-01 US Economic Releases


[Skip to the end]


2008-05-01 Challenger Job Cuts YoY

Challenger Job Cuts YoY (Apr)

Survey n/a
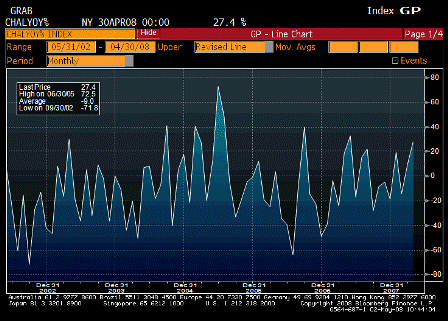
Actual 27.4%
Prior 9.4%
Revised n/a

Seem to be drifting higher.

[top]


2008-05-01 Personal Income

Personal Income (Mar)

Survey 0.4%
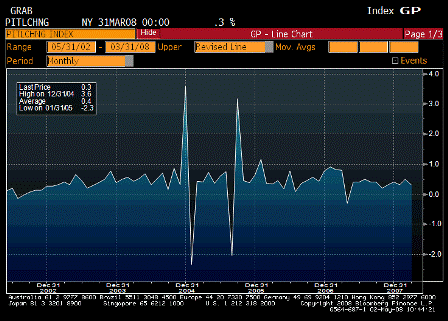
Actual 0.3%
Prior 0.5%
Revised n/a

Not the stuff of recessions.

[top]


2008-05-01 Personal Spending

Personal Spending (Mar)

Survey 0.2%
Actual 0.4%
Prior 0.1%
Revised n/a

Muddling through.

[top]


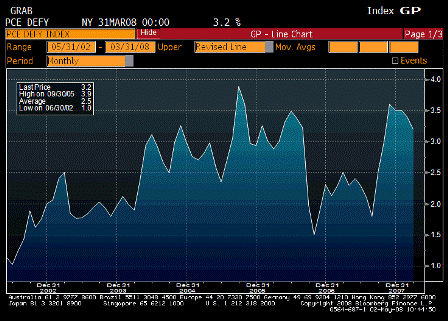
2008-05-01 PCE Deflator YoY

PCE Deflator YoY (Mar)

Survey 3.2%
Actual 3.2%
Prior 3.4%
Revised n/a

Still far too high for comfort for a mainstream economist.

[top]


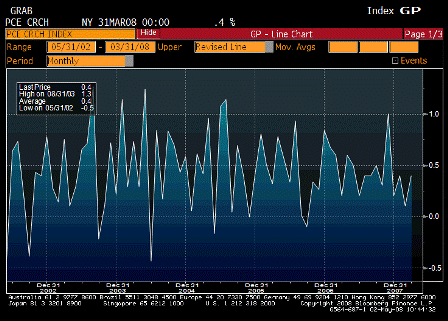
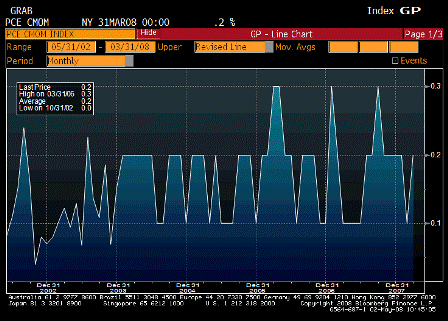
2008-05-01 PCE Core MoM

PCE Core MoM (Mar)

Survey 0.1%
Actual 0.2%
Prior 0.1%
Revised n/a

I’m anticipation more 0.3%s for the rest of this year.

[top]


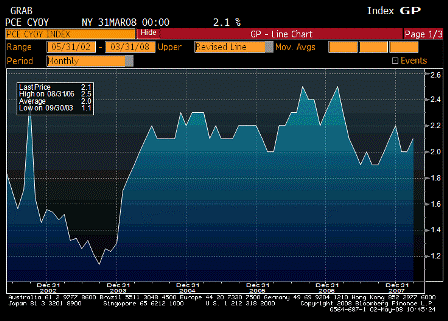
2008-05-01 PCE Core YoY

PCE Core YoY (Mar)

Survey 2.0%
Actual 2.1%
Prior 2.0%
Revised n/a

Starting to move back up.

[top]


2008-05-01 Initial Jobless Claims

Initial Jobless Claims (Apr 26)

Survey 365K
Actual 380K
Prior 342K
Revised 345K

No recession yet.

[top]


2008-05-01 Continuing Claims

Continuing Claims (Apr 19)

Survey 2950K
Actual 3019K
Prior 2934K
Revised 2945K

No recession yet.

[top]


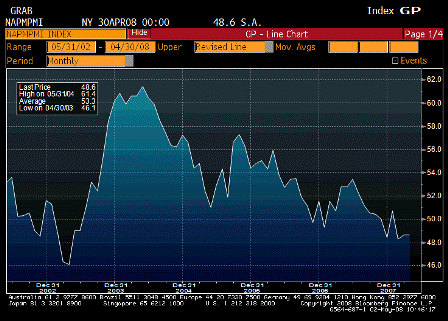
2008-05-01 ISM Manufacturing

ISM Manufacturing (Apr)

Survey 48.0
Actual 48.6
Prior 48.6
Revised n/a

Staying above recession levels.

[top]


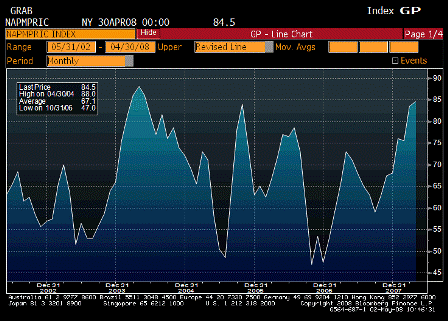
2008-05-01 ISM Prices Paid

ISM Prices Paid (Apr)

Survey 83.5
Actual 84.5
Prior 83.5
Revised n/a

Inflation ripping!

[top]


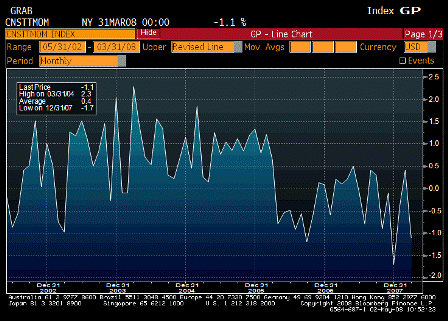
2008-05-01 Construction Spending MoM

Construction Spending MoM (Mar)

Survey -0.7%
Actual -1.1%
Prior -0.3%
Revised 0.4%

[top]


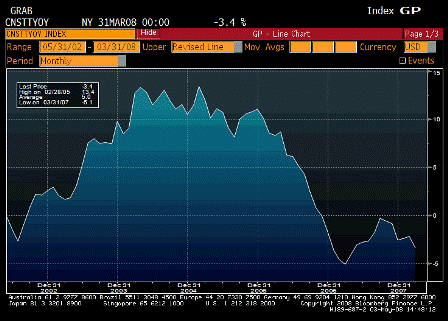
2008-05-01 Construction Spending YoY

Construction Spending YoY (Mar)

Survey n/a
Actual -3.4%
Prior -2.2%
Revised n/a

Still weak.

[top]


Total Vehicle Sales (Apr)

Survey 15.0M
Actual
Prior 15.1M
Revised

[comments]

[top]


Domestic Vehicle Sales (Apr)

Survey 11.4M
Actual
Prior 11.1M
Revised

[comments]


[top]

2008-04-24 US Economic Releases

  • Durable Goods Orders (Released 8:30AM EST)
  • Initial Jobless Claims (Released 8:30AM EST)
  • Continuing Claims (Released 8:30AM EST)
  • Help Wanted Index (Released 10AM EST)
  • New Home Sales (Released 10AM EST)

From Karim:

  • Initial claims down from 375k (revised from 372k) to 342k
  • Continuing claims down from 2999k (revised from 2984k) to 2934k
  • DGO ex-aircraft and defense unchanged and down -2% and -1% in Jan/Feb
  • Claims have been volatile lately due to seasonals, but if they were to somehow stabilize at these levels, would still be in line with 0 employment growth
  • Q1 business capex component of GDP likely to be negative (has never been a recession where business capex did not also contract)

IFO down from 104.8 to 102.4 and retail component down from -0.9 to -10.0

ECB Member Bonello returns fire to Weber:

On the basis of the data we have at hand and the ECB’s rationale for monetary policy strategy it is very difficult to make an argument for higher interest rates.


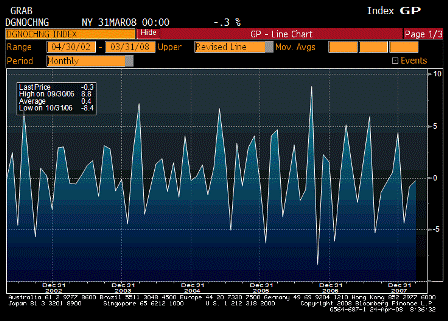
2008-04-24 Durable Goods Orders

Durable Goods Orders (Mar)

Survey 0.1%
Actual -0.3%
Prior -1.7%
Revised -0.9%

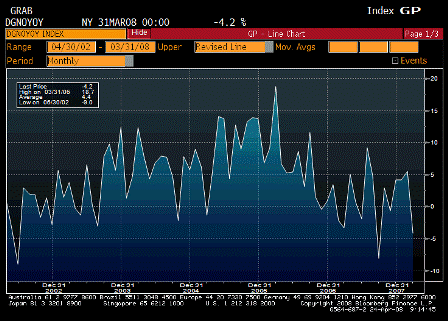
2008-04-24 Durable Goods Orders YoY

Durable Goods Orders YoY (Mar)

Survey n/a
Actual -4.2%
Prior 5.5%
Revised n/a

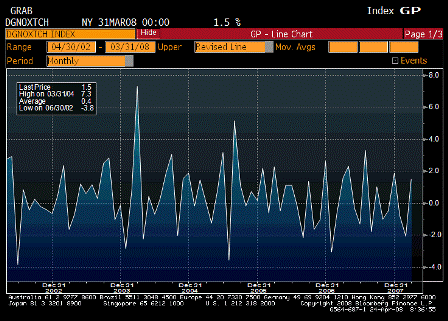
2008-04-24 Durables Ex Transportation

Durables Ex Transportation (Mar)

Survey 0.5%
Actual 1.5%
Prior -2.6%
Revised -2.1%

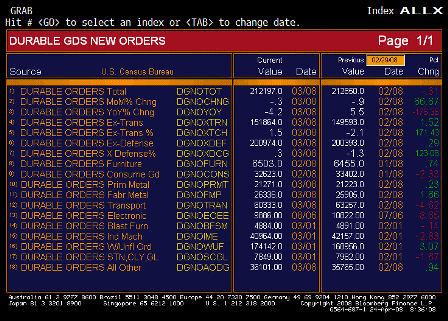
2008-04-24 Durable Goods TABLE

Durable Goods TABLE

Not all that bad. Two month total above expectations as Feb revised to a smaller drop.

Not at recession levels, yet.

And fiscal package kicking in soon.


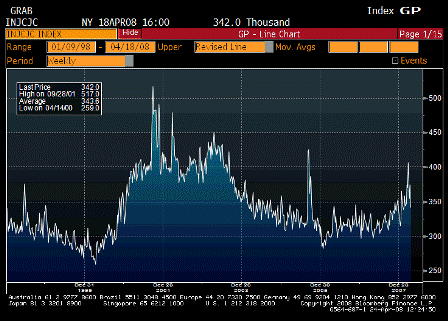
2008-04-24 Initial Jobless Claims since 1998

Initial Jobless Claims (Apr 19)

Survey 375K
Actual 342K
Prior 372K
Revised 375K

As suspected, from the jobless recovery to the full-employment recession.

Labor numbers soft but not all that bad. No where near recession levels, particularly population adjusted.


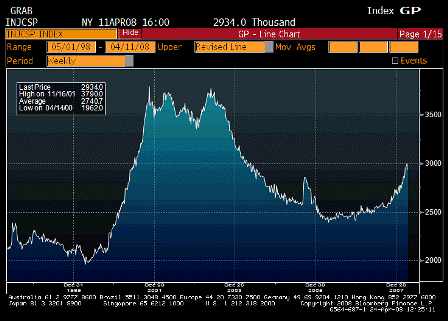
2008-04-24 Continuing Claims since 1998

Continuing Claims (Apr 12)

Survey 2990K
Actual 2934K
Prior 2984K
Revised 2999K

A lagging indicator, now following initial claims lower.


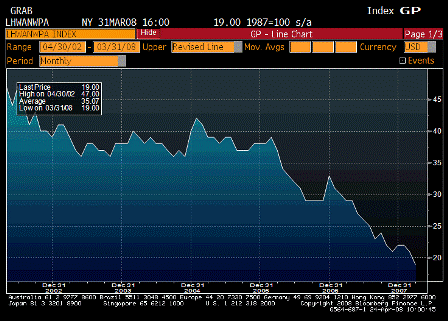
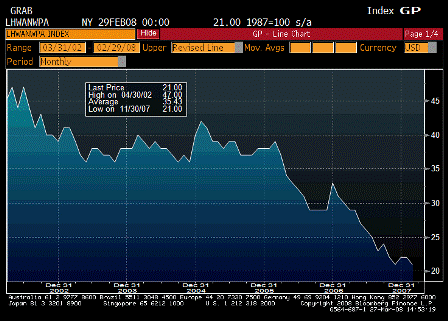
2008-04-24 Help Wanted Index

Help Wanted Index (Mar)

Survey 20
Actual 19
Prior 21
Revised n/a

Still going south, but a lagging indicator.


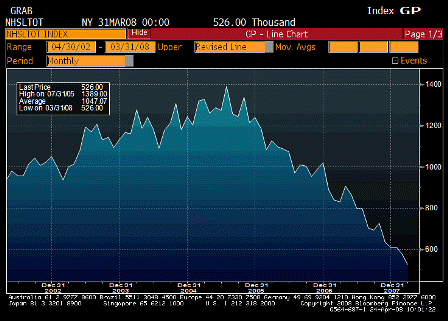
2008-04-24 New Home Sales

New Home Sales (Mar)

Survey 580K
Actual 526K
Prior 590K
Revised 575K

Sales still heading south.
Might be because production and inventories are down, and also subject to revisions next month.

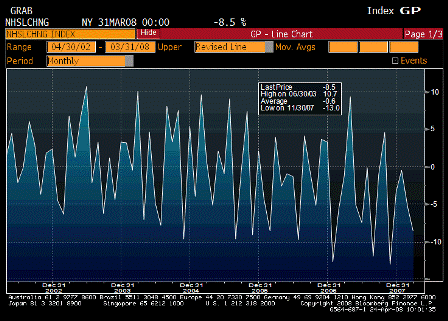
2008-04-24 New Home Sales MoM

New Home Sales MoM (Mar)

Survey -1.7%
Actual -8.5%
Prior -1.8%
Revised -5.3%

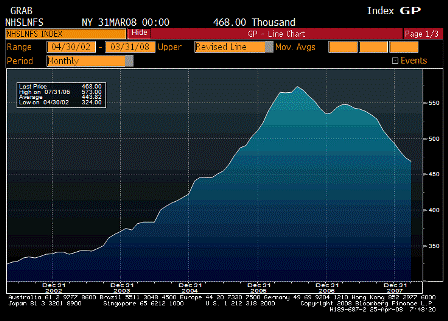
2008-04-24 Number of New Home For Sales

Number of New Homes for Sale (Mar)

Survey n/a
Actual 468K
Prior 473K
Revised n/a

Actual inventories are down substantially, and remaining inventory is probably not highly desirable.

Looking for regional shortages in the spring/summer buying season to drive up prices.

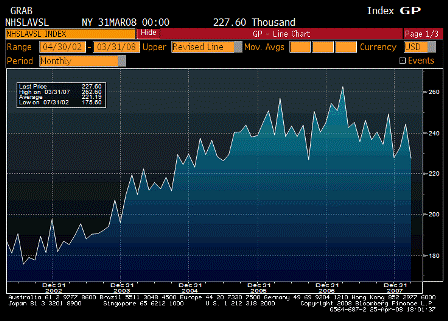
2008-04-24 New Home Sales Median Price

New Home Sales Median Price (Mar)

Survey n/a
Actual $227.6K
Prior $244.2K
Revised n/a

[comments]

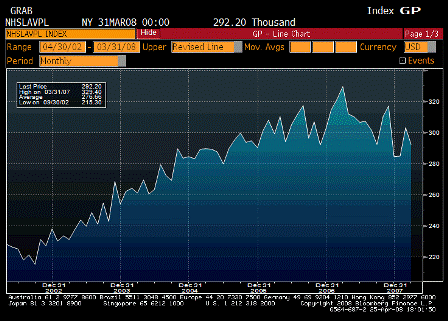
2008-04-24 New Home Sales Average Price

New Home Sales Average Price (Mar)

Survey n/a
Actual $292.2K
Prior $302.9K
Revised n/a

[comments]

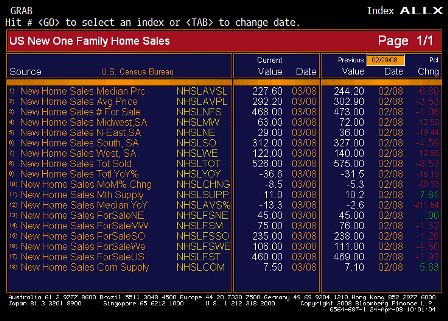
2008-04-24 New Home Sales TABLE

New Home Sales TABLE

2008-04-17 US Economic Releases

  • Initial Jobless Claims
  • Continuing Claims
  • Leading Indicators
  • Philadelphia Fed.

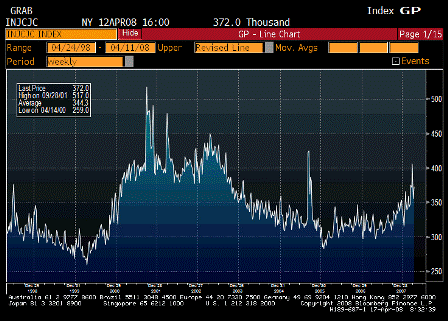
2008-04-17 Initial Jobless Claims

Initial Jobless Claims (Apr 12)

Survey 375K
Actual 372K
Prior 357K
Revised 355K

Not impossible that this spike to over 400,000 might be ending, much like in 2005, this time with help from a fiscal package and and government spending moved forward from 2007 to 2008.


2008-04-17 Continuing Claims

Continuing Claims (Apr 5)

Survey 2950K
Actual 2984K
Prior 2940K
Revised 2958K

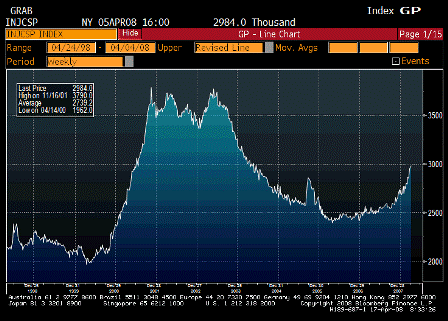
This lags the claims a bit, and could go further, but still not looking like recession type levels


2008-04-17 Leading Indicators

Leading Indicators (Mar)

Survey 0.1%
Actual 0.1%
Prior -0.3%
Revised n/a

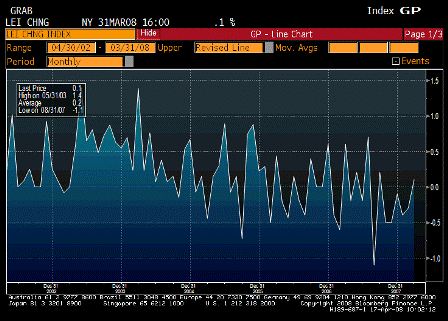
The future is starting to look a touch better, and the Fed uses ‘forward looking’ models.


2008-04-17 Philadelphia Fed.

Philadelphia Fed. (Apr)

Survey -15.0
Actual -24.9
Prior -17.4
Revised n/a

2008-04-17 Philadelphia Fed. TABLE

Philadelphia Fed. TABLE

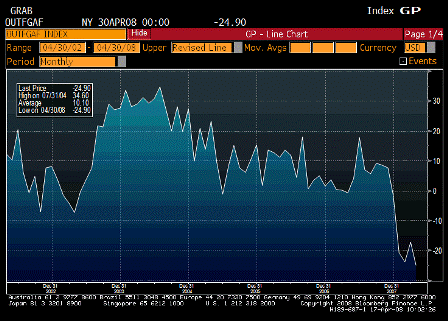
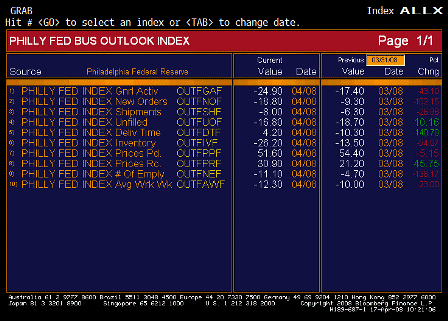
The Phili area is still in a ‘soft spot’ with only prices paid showing real strength.

Twin themes remain from Q2 06: weakness and higher prices.

2008-04-10 US Economic Releases

2008-04-10 Trade Balance

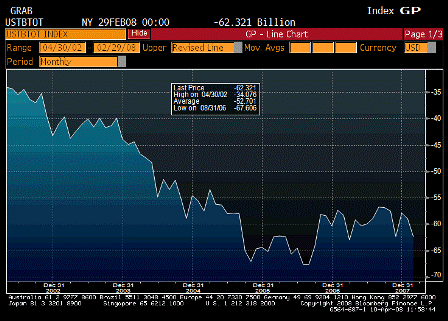
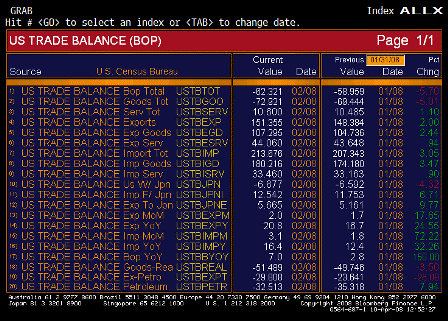
Trade Balance (Feb)

2008-04-10 Trade Balance TABLE

Trade Balance TABLE

Survey -$57.5B
Actual -$62.3B
Prior -$58.2B
Revised -$59.0B

Exports still accelerating- up 2% over last month, a 26%+ annual rate, and 20.8% year over year.

Looks like an anomaly with imports, up 3.1% month over month and petroleum imports down. Very odd for non petroleum imports to be up – look for adjustments with next month’s number.

While this February number means Q1 GDP will be revised lower, the March report is likely to more than reverse this.


2008-04-10 Initial Jobless Claims since 1998

Initial Jobless Claims (Apr 5)

Survey 383K
Actual 357K
Prior 407K
Revised 410K

Back down but 4 week moving average still inching up some.

Not at recession levels yet.


2008-04-10 Continuing Claims since 1998

Continuing Claims (Mar 29)

Survey 2935K
Actual 2840K
Prior 2937K
Revised n/a

This lags a week. It has moved up over the last year, but still far from previous recession levels.


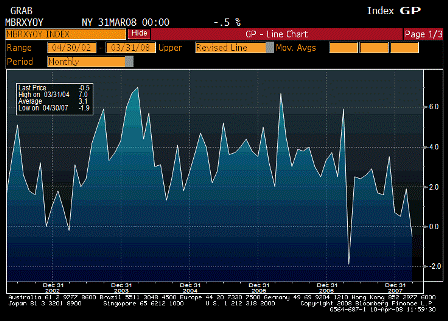
2008-04-10 ICSC Chaing Stores Sales YoY

ICSC Chain Stores Sales YoY (Mar)

Survey 0.9%
Actual -0.5%
Prior 1.9%
Revised n/a

Consumer remained weak in March – that’s what an export economy looks like.


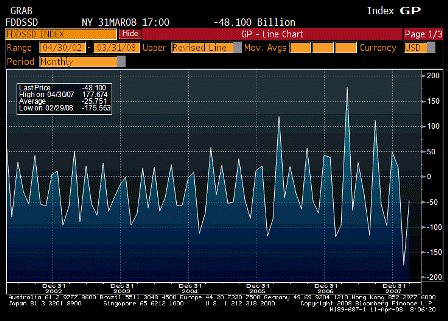
2008-04-10 Monthly Budget Statement

Monthly Budget Statement (Mar)

Survey -$70.0B
Actual -$48.1B
Prior -$96.3B
Revised n/a

2008-04-11 Monthly Budget Statement TABLE

Monthly Budget Statement TABLE

2008-04-03 US Economic Releases

2008-04-03 Initial Jobless Claims

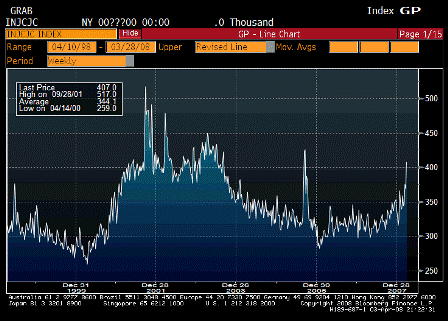
Initial Jobless Claims (Mar 29)

Survey 366K
Actual 407K
Prior 366K
Revised 369K

2008-04-03 Continuing Claims

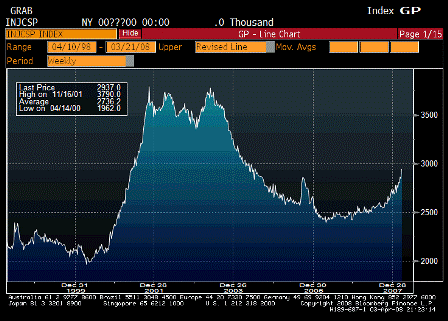
Continuing Claims (Mar 22)

Survey 2860K
Actual 2937K
Prior 2845K
Revised 2840K

This is now more in line with what’s looked like near zero growth for the first quarter, and not much more is expected for Q2.

While fear of systemic risk has been reduced with the realization that the Fed/Tsy can -and probably will- simply ‘write checks’ as needed, that doesn’t guarantee general weakness won’t continue.

As Karim has been indicating, we may be near the end of rate cuts, but continued weakness could mean rates stay down for a ‘considerable period.’

Also note markets aren’t (yet) moving much on this.

With reduced systemic risk fears, these types of numbers are more ‘rear view mirror’ events than forward looking regarding the future of GDP growth.

In other words, data can be forward looking for some purposes, like systemic risk, and rear view mirror for other purposes, like GDP growth.

Also, Bernanke pointed to differences between now and the 1930’s, leaving out the largest factor – the gold standard. With a fixed exchange rate policy the govt can’t ‘simply write checks’ as that tends to result in outflows of gold/spikes in interest rates that can quickly lead to default/devaluation.

(The US shut down in the payments system in 1934 and reopened with a domestically suspended gold standard and federal deposit insurance.)

From Karim:

  • Initial claims spike from 369k to 407k; a labor department spokesman said that more claims were processed last week due to good Friday holiday the week before

  • So that means that the rate of change is exaggerated, but not the level (prior week should have been more than 369k

  • Continuing claims (which come out with a 1 week lag) rose from 2840k to 2937k; if to follow the same pattern as continuing claims, should rise again next week

  • Employment component of last non-mfg ISM will be important in shaping final estimates for payrolls tomorrow; right now looks to be about flat
2008-04-03 ISM Non-Manf. Composite

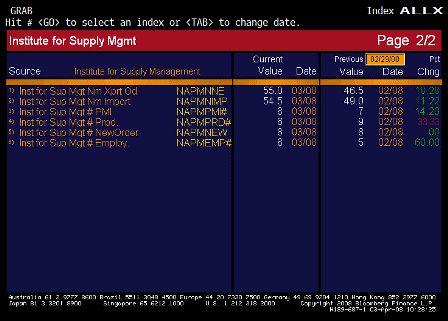
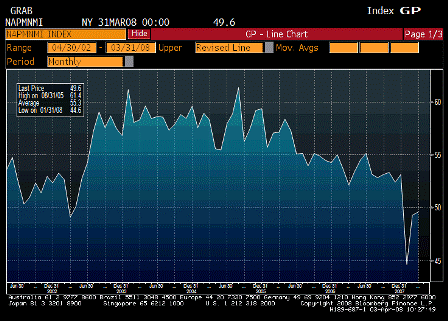
ISM Non-Manf. Composite (Mar)

Survey 48.5
Actual 49.6
Prior 49.3
Revised n/a


Nice bounce off the bottom though longer term still drifting lower.

2008-04-03 ISM TABLE

2008-04-03 ISM TABLE

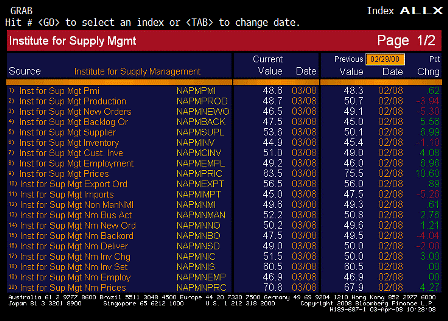
ISM TABLE (Mar)

From Karim:

Consolidating at contraction levels; employment unch at 46.9;

Yes, bodes for flat Q1 and probably a slow start to Q2.

inventory
sentiment remains poor (inventories too high)

Yes, meaning they are running relatively lean for a recession.

Also, new orders up some export orders up very sharply to 55, indicating continuing weakness for domestic demand but exports picking up the slack and then some.

Prices paid up and too high as well.

Weakness and higher prices continues.

(Crude now up on the day.)

2008-03-27 US Economic Releases

2008-03-27 GDP Annualized

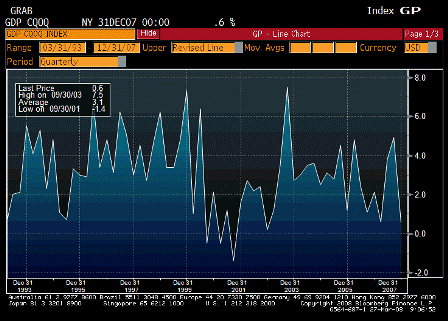
GDP Annualized (4Q F)

Survey 0.6%
Actual 0.6%
Prior 0.6%
Revised n/a

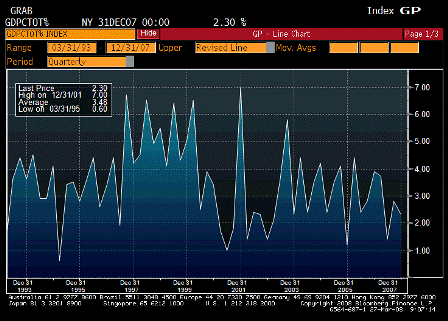
2008-03-27 Personal Consumption

Personal Consumption (4Q F)

Survey 1.9%
Actual 2.3%
Prior 1.9%
Revised n/a

Revised up to a very respectable number. And income remains positive, and employment is at high levels.


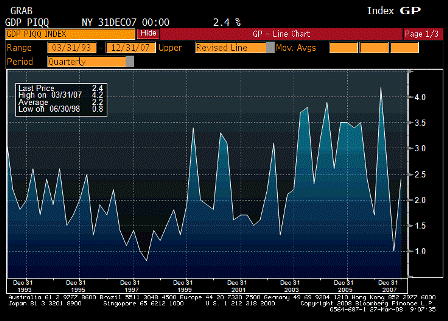
2008-03-27 GDP Price Index

GDP Price Index (4Q F)

Survey 2.7%
Actual 2.4%
Prior 2.7%
Revised n/a

A bit better than previously reported, but prices have subsequently gone much higher.


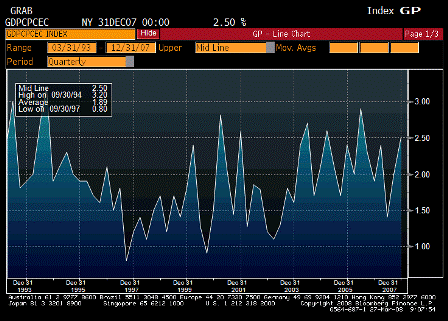
2008-03-27 Core PCE QoQ

Core PCE QoQ (4Q F)

Survey 2.7%
Actual 2.5%
Prior 2.7%
Revised n/a

The Fed is more concerned about this and the evidence food and energy is getting passed through from headline to core measures.


2008-03-27 Initial Jobless Claims since 1998

Initial Jobless Claims (Mar 22)

Survey 370K
Actual 366K
Prior 378K
Revised 375K

2008-03-27 Continuing Claims since 1998

Continuing Claims (Mar 15)

Survey 2885K
Actual 2845K
Prior 2865K
Revised 2850K

Best guess:

The jobless recovery that morphed into the full employment recession now appears to be over with today’s jobless claims numbers leaning in the same direction as other data released earlier this week.

That does not mean the issues with the financial sector are all behind us – far from it.

It does mean the real economy has figured out how to move on with what’s left of the financial sector.


2008-03-27 Help Wanted Index

Help Wanted Index (Feb)

Survey 20
Actual 21
Prior 21
Revised 22

[comments]

2008-03-20 US Economic Releases

2008-03-20 Initial Jobless Claims

Initial Jobless Claims (Mar 15)

Survey 360K
Actual 378K
Prior 353K
Revised 356K

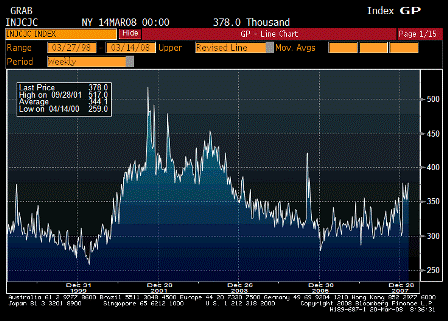
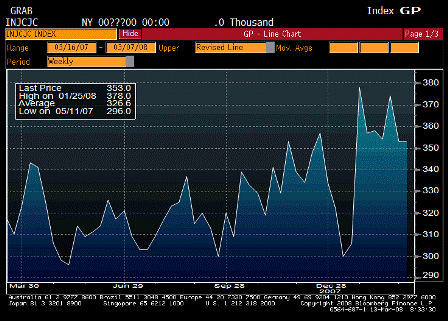
This has been trending higher but still not at recession levels.

(This series is not population adjusted so an upward drift over time is neutral.)
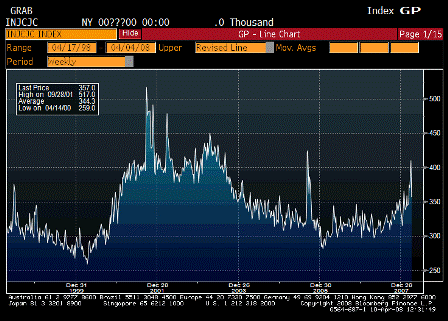
The American Axle strike also had some impact that will be reversed.


2008-03-0 Continuing Claims

Continuing Claims (Mar 8)
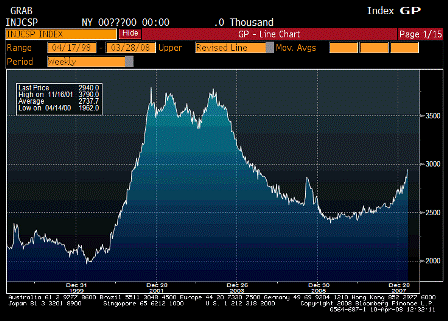
Survey 2840K
Actual 2865K
Prior 2835K
Revised 2833K

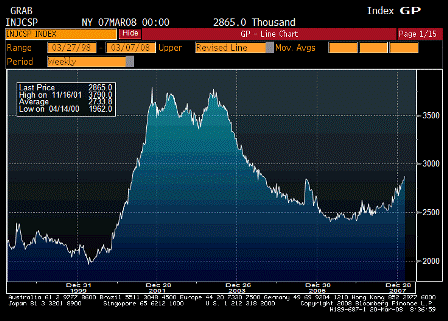
This series is also not at recession levels but is a lagging indicator.

It shows the job situation has been weakening since Q3.

This is what export economies tend to look like – labor markets always have a bit of slack, and domestic consumption is relatively low as the population works, gets paid, and can’t afford to consume its own output domestically, with the balance getting exported.

And GDP muddles through.


2008-03-20 Philadelphia Fed.

Philadelphia Fed. (Mar)

Survey -19.0
Actual -17.4
Prior -24.0
Revised n/a

2008-03-20 Philadelphia Fed. TABLE

Philadelphia Fed. TABLE

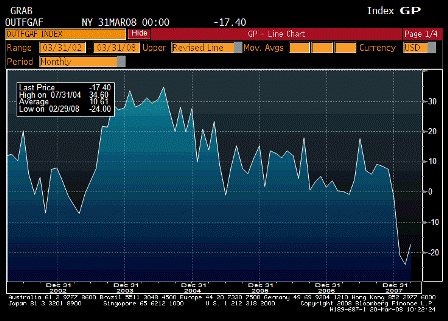
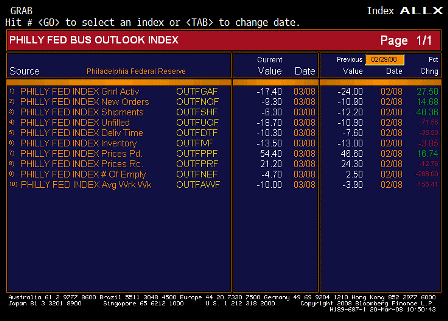
Better than forecast, some improvement, but still negative numbers.

For another rate cut, numbers have to come in worse than forecast.

Prices show continuing upward pressures. Fed needs these to level off.

Karim Basta:

  • Headline stays very weak at -17.4 (from -24)
  • Prices paid rises from 46.6 to 54.4 but Prices received drops from 24.3 to 21.2 (margin squeeze)
  • Employment drops from +2.5 to -4.7; emerging consensus of -50k drop in March payrolls
  • Workweek drops from -3.9 to -10
  • Special survey question on Q2 growth expectations: 0%

2008-03-20 Leading Indicators

Leading Indicators (Feb)

Survey -0.3%
Actual -0.3%
Prior -0.1%
Revised -0.4%

As expected, continuing weakness.

Stock market still the most reliable leading indicator.

2008-03-13 US Economic Releases

2008-03-13 Import Price Index MoM

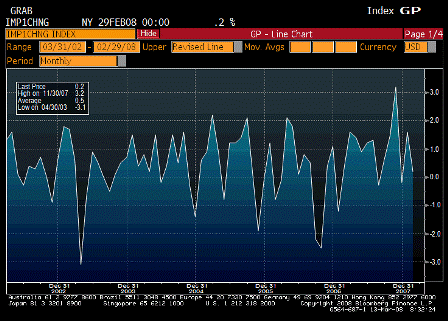
Import Price Index MoM (Feb)

Survey 0.8%
Actual 0.2%
Prior 1.7%
Revised 1.6%

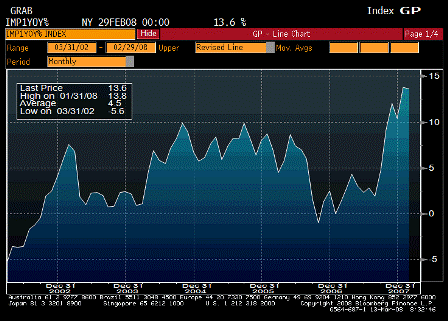
2008-03-13 Import Price Index YoY

Import Price Index YoY (Feb)

Survey n/a
Actual 13.6%
Prior 13.7%
Revised 13.8%

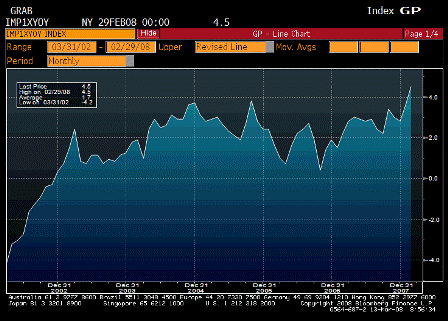
2008-03-13 Import Prices Ex Petroleum YoY

Import Prices Ex Petroleum YoY

Survey n/a
Actual 4.5%
Prior 3.6%
Revised n/a

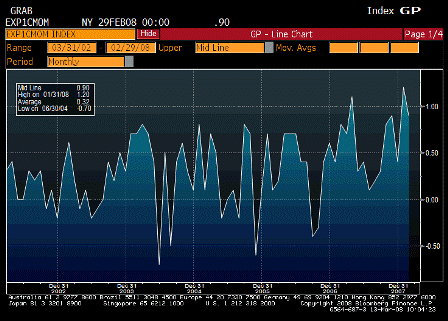
2008-03-13 Exports MoM

Exports MoM (Feb)

Survey n/a
Actual 0.9%
Prior 1.2%
Revised n/a

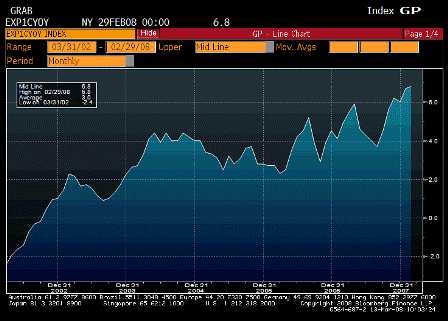
2008-03-13 Exports YoY

Exports YoY (Feb)

Survey n/a
Actual 6.8%
Prior 6.7%
Revised n/a

Inflation ripping via the ‘weak dollar’ channel.

Note: non-petroleum imports up 0.6%.


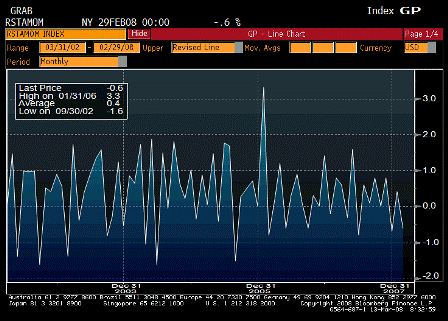
2008-03-13 Advance Retail Sales

Advance Retail Sales (Feb)

Survey 0.2%
Actual -0.6%
Prior 0.3%
Revised 0.4%

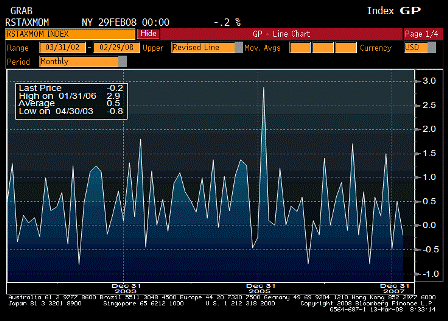
2008-03-13 Retail Sales Less Autos

Retail Sales Less Autos (Feb)

Survey 0.2%
Actual -0.2%
Prior 0.3%
Revised 0.5%

Retail sales soft, but not in collapse. That’s what an export economy looks like: domestic sales soft, while exports pick up the slack and support GDP, real terms of trade, and standards of living deteriorate.


2008-03-13 Initial Jobless Claims

Initial Jobless Claims (Mar 8)

Survey 357K
Actual 353K
Prior 351K
Revised 353K

Leveling off – nowhere near recession levels yet.

Would need to be 400K+.


2008-03-13 Continuing Claims since 1980

Continuing Claims (Mar 1)

Survey 2835K
Actual 2835K
Prior 2831K
Revised 2828K

Moving a bit higher, but still far below recession levels.


2008-03-13 Business Inventories

Business Inventories (Jan)

Survey 0.5%
Actual 0.8%
Prior 0.6%
Revised 0.7%

Up some, but still much lower than prior to other recessions.

2008-03-06 US Economic Releases

2008-03-06 Initial Jobless Claims

Initial Jobless Claims (Mar 1)

Survey 360K
Actual 351K
Prior 373K
Revised 375K

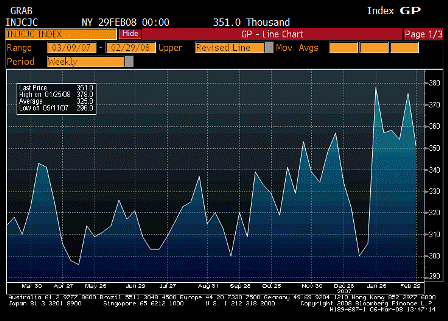
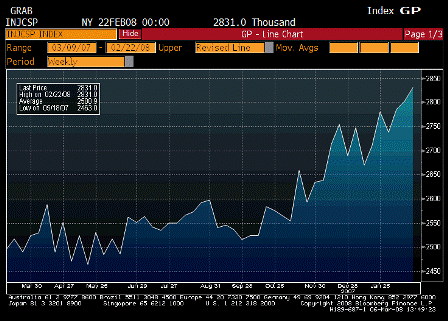
So far staying near the 4 week average of about 360,000. While higher than before, this is no longer high enough for a large enough output gap to address the now elevated rate of inflation and upward creeping inflation expectations.


2008-03-06 Continuing Claims

Continuing Claims (Feb 23)

2008-03-06 Continuing Claims since 1985

Continuing Claims since 1985

Survey 2810K
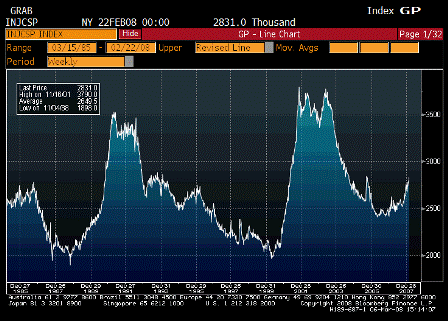
Actual 2831K
Prior 2807K
Revised 2802K

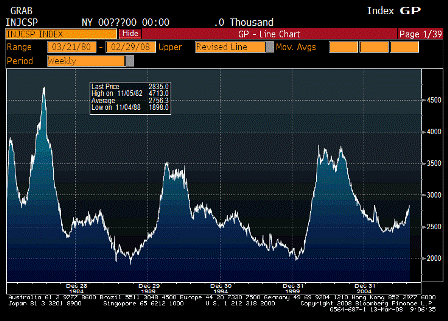
This too, is far to low for an output gap that the Fed may deem necessary to bring down inflation. The longer term chart is more informative in this regard.


2008-03-06 Pending Home Sales MoM

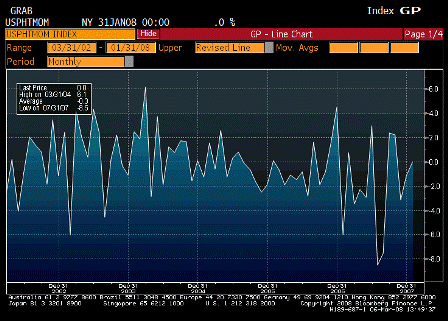
Pending Home Sales MoM (Jan)

Survey -1.0%
Actual 0.0%
Prior -1.5%
Revised -1.2%

The last thing the Fed needs is for housing to pick up now and shrink the current output gap.
That would put them hundreds of basis points behind the inflation curve.


2008-03-06 Mortgage Delinquencies

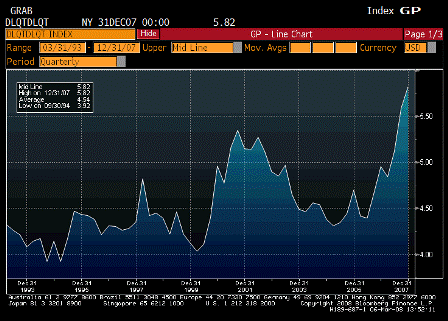
Mortgage Delinquencies (4Q)

Survey n/a
Actual 5.82%
Prior 5.59%
Revised n/a

Mostly the sub prime buldge, but higher quality mtg delinquencies are up as well. Again, with higher inflation, the Fed needs a larger output gap.


2008-03-06 ICSC Chain Store Sales YoY

ICSC Chain Store Sales YoY (Feb)

Survey 0.6%
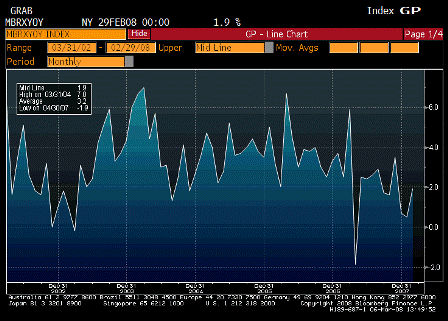
Actual 1.9%
Prior 0.5%
Revised n/a

Shows how domestic demand has been moderating over time, but not collapsing to recession levels.