Empire survey, IP, homebuilder’s survey

Empire State Mfg Survey


Highlights
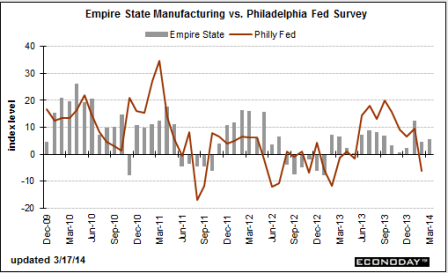
Steady but slow is the indication from the Empire State index which is up slightly this month, to 5.61 from 4.48 in February. New orders also show a slight increase, to 3.13 vs last month’s slightly contractionary reading of minus 0.21, as do shipments, at 3.97 vs 2.13. Growth in the sample’s employment reading slowed, to 5.88 from 11.25.

Other readings include a rise in inventories and a sizable draw in backlog orders. Price readings, despite this month’s rise in fuel costs, show easing pressure. Readings on the six-month outlook are a little less optimistic than prior months.


Full size image

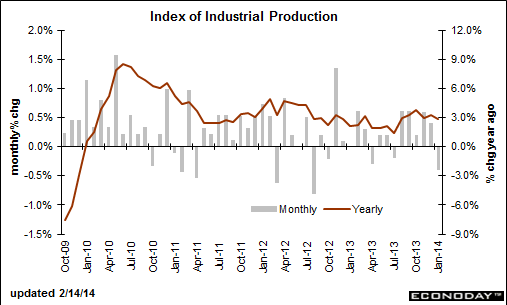
This always seems to chug along at about 3% and doesn’t say much about anything else:

Industrial Production


Highlights
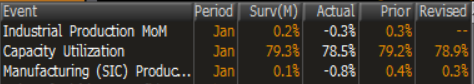
Capacity utilization Consensus Forecast for February 14: 78.6 percent
Range: 78.4 to 78.8 percent

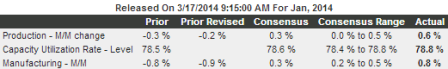
Industrial production was unexpectedly strong in February and utilities actually tugged down on the latest number. Industrial production rebounded 0.6 percent after dipping 0.2 percent in January. Market expectations were for a 0.3 percent gain.

By major components, manufacturing jumped 0.8 percent in February, following a 0.9 percent drop the month before. Mining rose 0.3 percent, following a 0.5 percent boost in January. Utilities slipped 0.2 percent after a 3.8 percent surge the prior month.


Full size image

So the challenge for 2014, at least so far, is to overcome drops in the growth of autos and housing vs 2013:

Housing Market Index


Highlights
The housing market index failed to bounce back much from February’s record loss, coming in at a lower-than-expected 47 for only a 1 point gain. Details for March once again show serious weakness in traffic, at 33 vs February’s 31. Weakness in traffic points to a lack of first-time buyers and underscores the continued importance of all cash buyers in the housing market.

Other details are on the plus side of 50 to indicate monthly growth but just barely, at 52 for current sales and 53 for future sales. The regional breakdown shows little separation except for the Northeast which lags badly but which however is by far the smallest region for new homes.

New home sales, which had been badly depressed, surged in January but this report points only to incremental growth for February and March. And the traffic component of this report points to a lack of sales growth in the months ahead. Watch for housing starts and permit data tomorrow morning on the Econoday calendar, both of which are expected to bounce back.

IP Chart

More downward revisions on the way, with expectations of a reversal when the weather issues subside.

But with the federal deficit probably south of 3%, which seems to be struggling to keep pace with the demand leakages, the income lost due to the reduced growth of sales/output/employment means there is that much less support for any post weather rebound in spending/GDP.

“But freezing temperatures boosted demand for heating last month, causing utilities production to jump 4.1 percent.”

Industrial Production

Highlights
The manufacturing sector is losing traction-weather related or not. Overall industrial production fell 0.3 percent in January, following a 0.3 percent gain the month before. Analysts expected a 0.3 percent rise for the latest month.

Turning to major components, it was worse for manufacturing which dropped 0.8 percent after a 0.3 percent increase in December. The consensus projected a 0.1 percent increase for January. Atypically adverse weather helped the overall number from being weaker as utilities jumped 4.1 percent in January, following a 1.4 percent dip the prior month. Mining slipped 0.9 percent after gaining 1.8 percent.

Looking at detail for manufacturing, durables fell 0.8 percent in January, led down by a 5.0 percent drop in motor vehicles and parts. Nondurables declined 0.8 percent in January.

Manufacturing excluding motor vehicles decreased 0.5 percent in January, following a 0.3 percent rise in December.

Capacity utilization declined to 78.5 percent from 78.9 percent in December.

Today’s report adds to the argument that the first quarter will be sluggish. It also calls to attention as to whether the Fed will pause in its “measured steps” for tapering quantitative easing. But the Fed clearly will watch the next employment report before making that decision in mid-March.

The traditional non-NAICS numbers for industrial production may differ marginally from the NAICS basis figures.

CPI/IP/Michigan


[Skip to the end]

Yes, there’s clearly an ‘unidentified demand leakage’ to have all this deficit spending with demand only holding at very low levels.

I keep coming back to the depressing effects of low interest rates and a large Fed portfolio shifting interest income from savers to govt., banks, and corporate borrowers with consumers who borrow getting very little benefit as incomes at best stagnate.

As Bernanke stated in his 2004 paper, the fiscal drag from lower interest rates can be offset by a tax cut or fed spending increase.


Karim writes:

Biggest news this morning was surprising drop in Michigan survey. Despite equity rally, lower gas prices and labor market becoming ‘less bad’, Michigan survey drops 2.8pts to lowest level since March. Consumer still nowhere to be found in current ‘recovery’.

  • Michigan Survey falls from 66 to 63.2
  • 1y Fwd Inflation expex drop from 3.0 to 2.9; 5-10yr fwd from 2.9 to 2.8
  • IP for July up 0.5%; aided by auto production; ex-autos -0.1%
  • CPI unchanged m/m for both headline and core; headline -2.1% y/y and core +1.5%
  • OER (Unch) and lodging away from home (-2.1%) offset apparel (0.6%), vehicles (0.3%) and tobacco (2.2%).
  • Look for quirks in vehicle pricing to resolve in coming months and help drive core below 1% by yr-end.


[top]

2009-04-15 USER


[Skip to the end]


MBA Mortgage Applications (Apr 10)

Survey n/a
Actual -11.0%
Prior 4.7%
Revised n/a

[top][end]

MBA Purchasing Applications (Apr 10)

Survey n/a
Actual 264.10
Prior 297.70
Revised n/a

[top][end]

MBA Refinancing Applications (Apr 10)

Survey n/a
Actual 6071.70
Prior 6813.50
Revised n/a

[top][end]


Consumer Price Index MoM (Mar )

Survey 0.1%
Actual -0.1%
Prior 0.4%
Revised n/a

[top][end]

CPI Ex Food and Energy MoM (Mar)

Survey 0.1%
Actual 0.2%
Prior 0.2%
Revised n/a

[top][end]

Consumer Price Index YoY (Mar)

Survey -0.1%
Actual -0.4%
Prior 0.2%
Revised n/a

[top][end]

CPI Ex Food and Energy YoY (Mar)

Survey 1.7%
Actual 1.8%
Prior 1.8%
Revised n/a

[top][end]

CPI Core Index SA (Mar)

Survey n/a
Actual 218.042
Prior 217.670
Revised n/a

[top][end]

Consumer Price Index NSA (Mar)

Survey 212.900
Actual 212.709
Prior 212.193
Revised n/a

[top][end]


Empire State Manufacturing Survey (Apr)

Survey -35.00
Actual -14.65
Prior -38.23
Revised n/a

[top][end]

Empire State Manufacturing Survey ALLX 1 (Apr)

[top][end]

Empire State Manufacturing Survey ALLX 2 (Apr)

[top][end]


Net Long Term TIC Flows (Feb)

Survey $14.0B
Actual $22.0B
Prior -$43.0B
Revised -$36.8B

[top][end]

Total Net TIC Flows (Feb)

Survey n/a
Actual -$97.0B
Prior -$148.9B
Revised -$146.8B

[top][end]


Industrial Production MoM (Mar)

Survey -0.9%
Actual -1.5%
Prior -1.4%
Revised -1.5%

[top][end]

Industrial Production YoY (Mar)

Survey n/a
Actual -12.8%
Prior -11.8%
Revised n/a

[top][end]


Capacity Utilization (Mar)

Survey 69.6%
Actual 69.3%
Prior 70.9%
Revised 70.3%

[top][end]

Capacity Utilization TABLE 1 (Mar)

[top][end]

Capacity Utilization TABLE 2 (Mar)

[top][end]

Capacity Utilization TABLE 3 (Mar)

[top][end]


NAHB Housing Market Index (Apr)

Survey 10
Actual 14
Prior 9
Revised n/a

[top][end]

NAHB Housing Market Index TABLE 1 (Mar)

[top][end]

NAHB Housing Market Index TABLE 2 (Mar)


[top]

2009-02-18 USER


[Skip to the end]


ICSC UBS Store Sales WoW (Feb 10)

Survey n/a
Actual 0.90%
Prior 0.00%
Revised n/a

[top][end]

ICSC UBS Store Sales YoY (Feb 10)

Survey n/a
Actual -0.90%
Prior -1.80%
Revised n/a

[top][end]

Redbook Store Sales Weekly YoY (Feb 10)

Survey n/a
Actual -1.40%
Prior -1.70%
Revised n/a

[top][end]

Redbook Store Sales MoM (Feb 10)

Survey n/a
Actual 0.90%
Prior 0.70%
Revised n/a

[top][end]

ICSC UBS Redbook Comparison TABLE (Feb 10)

[top][end]


MBA Mortgage Applications (Feb 13)

Survey n/a
Actual 45.7%
Prior -24.5%
Revised n/a

[top][end]

MBA Purchasing Applications (Feb 13)

Survey n/a
Actual 257.30
Prior 235.90
Revised n/a

[top][end]

MBA Refinancing Applications (Feb 13)

Survey n/a
Actual 4472.90
Prior 2722.70
Revised n/a

[top][end]


Import Price Index MoM (Jan)

Survey -1.2%
Actual -1.1%
Prior -4.2%
Revised -5.0%

 
Karim writes:

  • Import prices -1.1% m/m and -12.5% y/y; -0.8% m/m ex-petroleum; imports from China -0.7% m/m (-0.5% and -0.7% prior 2mths)
  • [top][end]

    Import Price Index YoY (Jan)

    Survey -11.2%
    Actual -12.5%
    Prior -9.3%
    Revised -10.3%

    [top][end]

    Import Price Index ALLX 1 (Jan)

    [top][end]

    Import Price Index ALLX 2 (Jan)

    [top][end]


    Housing Starts (Jan)

    Survey 529K
    Actual 466K
    Prior 550K
    Revised 560K

     
    Karim writes:

    Housing starts and building permits fall to all-time lows.

    • Starts -16.8% m/m (all 4 regions down) and -56.2% y/y; 3rd consecutive double digit m/m decline
    • Permits -4.8% m/m (all 4 regions down)
    • When adding the supply of vacant homes (over 1mm) to starts, excess supply (relative to new household formation and obsolesence) still exists and in turn downward pressure on home prices

    [top][end]

    Building Permits (Jan)

    Survey 525K
    Actual 521K
    Prior 549K
    Revised 547K

    [top][end]


    Industrial Production MoM (Jan)

    Survey -1.5%
    Actual -1.8%
    Prior -2.0%
    Revised -2.4%

    [top][end]

    Industrial Production YoY (Jan)

    Survey n/a
    Actual -10.0%
    Prior -8.2%
    Revised n/a

    [top][end]

    Capacity Utilization (Jan)

    Survey 72.4%
    Actual 72.0%
    Prior 73.6%
    Revised 73.3%

    [top][end]

    Capacity Utilization TABLE 1 (Jan)

    [top][end]

    Capacity Utilization TABLE 2 (Jan)

    [top][end]

    Capacity Utilization TABLE 3 (Jan)


    [top]

    2009-01-16 USER


    [Skip to the end]


    Consumer Price Index MoM (Dec)

    Survey -0.9%
    Actual -0.7%
    Prior -1.7%
    Revised n/a

    [top][end]

    CPI Ex Food and Energy MoM (Dec)

    Survey 0.1%
    Actual 0.0%
    Prior 0.0%
    Revised n/a

    [top][end]

    Consumer Price Index YoY (Dec)

    Survey -0.2%
    Actual 0.1%
    Prior 1.1%
    Revised n/a

    [top][end]

    CPI Ex Food and Energy YoY (Dec)

    Survey 1.8%
    Actual 1.8%
    Prior 2.0%
    Revised n/a

    [top][end]

    CPI Core Index SA (Dec)

    Survey n/a
    Actual 216.816
    Prior 216.849
    Revised n/a

    [top][end]

    Consumer Price Index NSA (Dec)

    Survey 210.210
    Actual 210.228
    Prior 212.425
    Revised n/a

    [top][end]

    Consumer Price Index TABLE 1 (Dec)

    [top][end]

    Consumer Price Index TABLE 2 (Dec)

    [top][end]

    Consumer Price Index TABLE 3 (Dec)

    [top][end]


    Net Long Term TIC Flows (Nov)

    Survey $15.0B
    Actual -$21.7B
    Prior $1.5B
    Revised -$0.4B

    [top][end]

    Total Net TIC Flows (Nov)

    Survey n/a
    Actual $56.8B
    Prior $286.3B
    Revised $260.6B

    [top][end]


    Industrial Production MoM (Dec)

    Survey -1.0%
    Actual -2.0%
    Prior -0.6%
    Revised -1.3%

    [top][end]

    Industrial Production YoY (Dec)

    Survey n/a
    Actual -5.5%
    Prior -4.5%
    Revised n/a

    [top][end]

    Capacity Utilization (Dec)

    Survey 74.5%
    Actual 73.6%
    Prior 75.4%
    Revised 75.2%

    [top][end]

    Capacity Utilization TABLE 1 (Dec)

    [top][end]

    Capacity Utilization TABLE 2 (Dec)

    [top][end]

    Capacity Utilization TABLE 3 (Dec)

    [top][end]


    U of Michigan Confidence (Jan P)

    Survey 59.0
    Actual 61.9
    Prior 60.1
    Revised n/a

    [top][end]

    U of Michigan TABLE Inflation Expectations (Jan P )


    [top]

    2008-12-15 USER


    [Skip to the end]


    Empire State Manufacturing Survey (Dec)

    Survey -28.00
    Actual -25.76
    Prior -25.43
    Revised n/a

    [top][end]

    Empire State Manufacturing Survey ALLX 1 (Dec)

    [top][end]

    Empire State Manufacturing Survey ALLX 2 (Dec)

    [top][end]

    Net Long Term TIC Flows (Oct)

    Survey $40.0B
    Actual $1.5B
    Prior $66.2B
    Revised $65.4B

    [top][end]

    Total Net TIC Flows (Oct)

    Survey n/a
    Actual $286.3B
    Prior $143.4B
    Revised $142.6B

    [top][end]

    TIC ALLX (Oct)

    [top][end]

    TIC TABLE 1 (Oct)

    [top][end]

    TIC TABLE 2 (Oct)

    [top][end]

    TIC TABLE 3 (Oct)

    [top][end]

    Industrial Production MoM (Nov)

    Survey -0.8%
    Actual -0.6%
    Prior 1.3%
    Revised 1.5%

    [top][end]

    Industrial Production YoY (Nov)

    Survey n/a
    Actual -5.5%
    Prior -4.5%
    Revised n/a

    [top][end]

    Capacity Utilization (Nov)

    Survey 75.6%
    Actual 75.4%
    Prior 76.4%
    Revised 76.0%

    [top][end]

    Capacity Utilization TABLE 1 (Nov)

    [top][end]

    Capacity Utilization TABLE 2 (Nov)

    [top][end]

    Capacity Utilization TABLE 3 (Nov)


    [top]

    2008-11-17 USER


    [Skip to the end]


    Empire State Manufacturing Survey (Nov)

    Survey -26.00
    Actual -25.43
    Prior -24.62
    Revised n/a

     
    Remains depressed.

    [top][end]

    Empire State Manufacturing Survey ALLX 1 (Nov)

    [top][end]

    Empire State Manufacturing Survey ALLX 2 (Nov)

    [top][end]

    Industrial Production MoM (Oct)

    Survey 0.2%
    Actual 1.3%
    Prior -2.8%
    Revised -3.7%

     
    Routine bounce back of a volatile series.

    [top][end]

    Industrial Production YoY (Oct)

    Survey n/a
    Actual -4.1%
    Prior -5.7%
    Revised n/a

    [top][end]

    Capacity Utilization (Oct)

    Survey 76.5%
    Actual 76.4%
    Prior 76.4%
    Revised 75.5%

    [top][end]

    Capacity Utilization TABLE 1 (Oct)

    [top][end]

    Capacity Utilization TABLE 2 (Oct)

    [top][end]

    Capacity Utilization TABLE 3 (Oct)


    [top]

    2008-09-15 USER


    [Skip to the end]


    Empire State Manufacturing Survey (Sep)

    Survey 1.0
    Actual -7.4
    Prior 2.8
    Revised n/a

     
    Down and worse than expected but still off the lows.

    [top][end]

    Empire State Manufacturing Survey ALLX 1 (Sep)

     
    Employees and new orders up, while prices paid and received numbers moderated.

    [top][end]

    Empire State Manufacturing Survey ALLX 2 (Sep)

     
    Capex and Tech spending up.

    [top][end]


    Industrial Production MoM (Aug)

    Survey -0.3%
    Actual -1.1%
    Prior 0.2%
    Revised 0.1%

     
    A lot worse than expected and prior month revised down.

    [top][end]

    Industrial Production YoY (Aug)

    Survey n/a
    Actual -1.5%
    Prior -0.4%
    Revised n/a

     
    Not looking good. Ex autos still down .6 month over month.


    [top]

    2008-08-15 US Economic Releases


    [Skip to the end]


    Empire Manufacturing (Aug)

    Survey -4.0
    Actual 2.8
    Prior -4.9
    Revised n/a

    Yet another series that could be making a comeback, albeit from very low levels.

    Even the work week went up.

    Prices paid still way high, and prices received high and moved higher.

    [top][end]

    Empire Manufacturing ALLX (Aug)

    [top][end]


    Net Long-term TIC Flows (Jun)

    [top][end]

    Total Net TIC Flows (Jun)

    Survey n/a
    Actual $51.1B
    Prior -$2.5B
    Revised $12.3B

    Should be slowing with trade flows reversing.

    [top][end]

    TIC ALLX (Jun)

    [top][end]

    TIC TABLE 1 (Jun)

    [top][end]

    TIC TABLE 2 (Jun)

    [top][end]

    TIC TABLE 3 (Jun)

    [top][end]


    Industrial Production MoM (Jul)

    Survey 0.0%
    Actual 0.2%
    Prior 0.5%
    Revised 0.4%

    A little better than expected.

    [top][end]

    Industrial Production YoY (Jul)

    Survey n/a
    Actual -0.1%
    Prior 0.2%
    Revised n/a

    Certainly not a collapse.

    Being helped by the relatively weak USD.

    [top][end]


    Capacity Utilization (Jul)

    Survey 79.8%
    Actual 79.9%
    Prior 79.9%
    Revised 79.8%

    No collapse here either.

    The Fed’s counting on slack to bring prices down.

    [top][end]

    [top][end]

    Capacity Utilization TABLE 2 (Jul)

    [top][end]

    Capacity Utilization TABLE 3 (Jul)

    [top][end]


    U of Michigan Confidence (Aug P)

    Survey 62.0
    Actual 61.7
    Prior 61.2
    Revised n/a

    This too looks like it has bottomed from very low levels.

    ‘Inflation’ still hurting confidence.


    [top]