- ICSC-UBS Store Sales YoY (Released 7:45 EST)
- ICSC-UBS Store Sales TABLE (Released 7:45 EST)
- Producer Price Index MoM (Released 8:30 EST)
- PPI Ex Food & Energy MoM (Released 8:30 EST)
- Producer Price Index YoY (Released 8:30 EST)
- PPI Ex Food & Energy YoY (Released 8:30 EST)
- Advance Retail Sales MoM (Released 8:30 EST)
- Retail Sales Less Autos MoM (Released 8:30 EST)
- Advance Retail Sales YoY (Released 8:30 EST)
- Empire Manufacturing (Released 8:30 EST)
- Redbook Store Sales (Released 8:55 EST)
- Redbook Store Sales TABLE (Released 8:55 EST)
- IBD/TIPP Economics Optimism (Released 10:00 EST)
- Business Inventories (Released 10:00 EST)
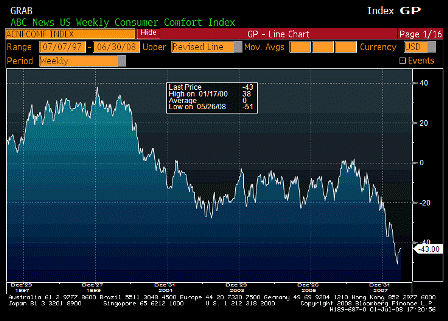
- ABC Consumer Confidence (Released 17:00 EST)
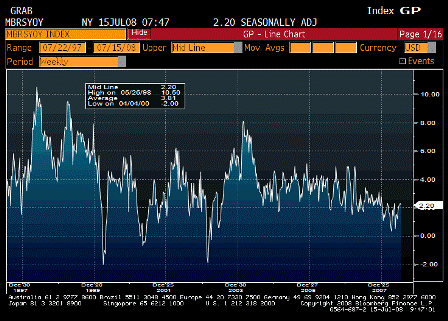
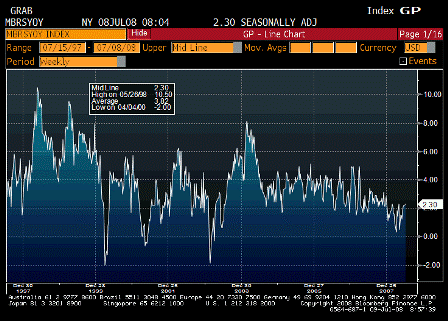
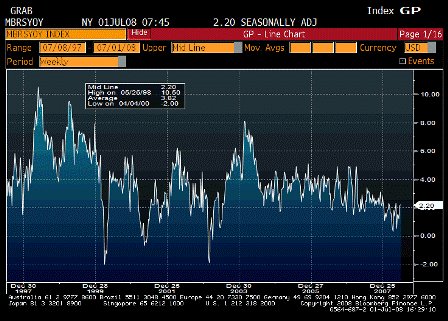
ICSC-UBS Store Sales YoY (Jun)
| Survey | n/a |
| Actual | 2.2% |
| Prior | 2.3% |
| Revised | n/a |
Fiscal spending seems to have stemmed the decline.
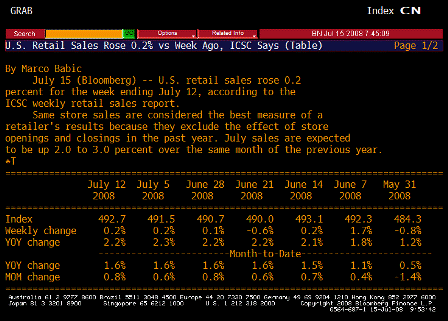
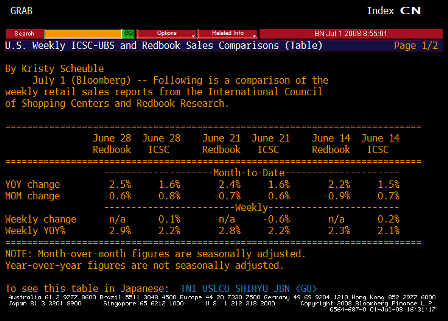
ICSC-UBS Store Sales TABLE (Jun)
Same.
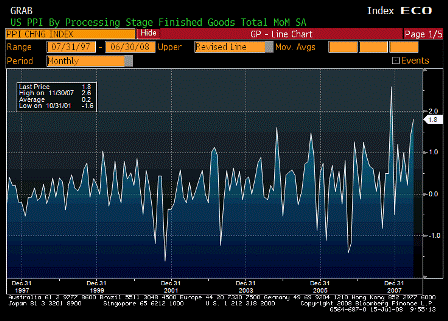
Producer Price Index MoM (Jun)
| Survey | 1.4% |
| Actual | 1.8% |
| Prior | 1.4% |
| Revised | n/a |
Looks like a banana republic with a weak currency.
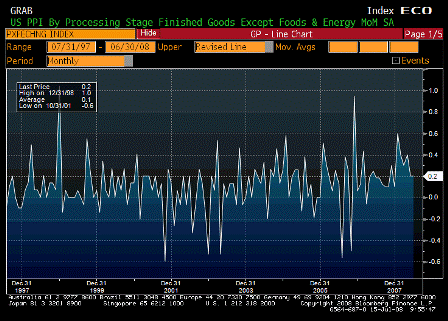
PPI Ex Food & Energy MoM (Jun)
| Survey | 0.3% |
| Actual | 0.2% |
| Prior | 0.2% |
| Revised | n/a |
Also looks to be working its way higher.
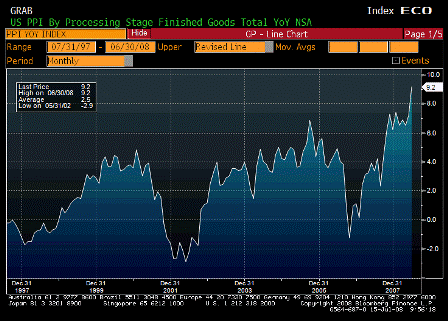
Producer Price Index YoY (Jun)
| Survey | 8.7% |
| Actual | 9.2% |
| Prior | 7.2% |
| Revised | n/a |
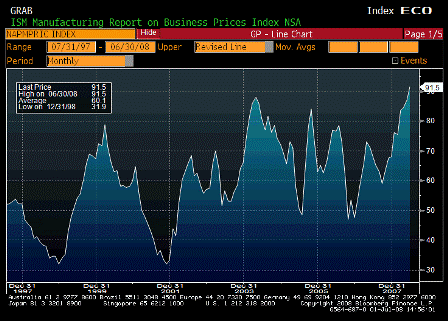
Inflation pouring in through the front door – import prices.
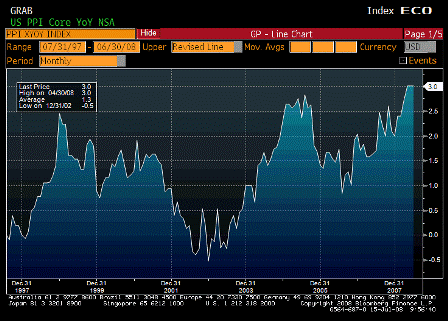
PPI Ex Food & Energy YoY (Jun)
| Survey | 3.2% |
| Actual | 3.0% |
| Prior | 3.0% |
| Revised | n/a |
Looking like its on the way up, as it’s recovered and surpassed the level of Aug 06 when Goldman changed their commodity index and triggered massive selling of gasoline.
The Fed is watching for headline to leak into core, which they’ve said is already happening.
When only food/crude/import prices go up, it’s a relative value story, as funds to buy that stuff mean less to buy other things, and they lag in price.
But in this case core measures are not going down to offset headline numbers.
True, they haven’t gone up that much yet, but they have gone up rather than down.
That means that yes, demand is ‘weak’ and unemployment creeping up,
But demand is still strong enough to support both higher headline CPI and rising core measures as well,
Supported by government spending which is not revenue constrained nor liquidity constrained,
And supported by booming exports as non residents trip over each other trying to spend their now unwanted multi $trillion hoard of US financial assets.
Current levels of demand are more than sufficient to support much higher levels of housing starts (though still low levels), relatively flat employment, and rising core inflation measures.
And US real terms of trade continue to deteriorate along with the standard of living as a foreign oil monopolist exacts ever higher relative prices.
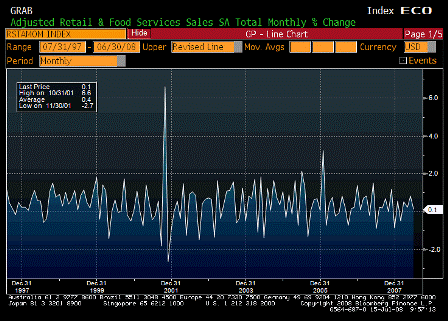
Advance Retail Sales MoM (Jun)
| Survey | 0.4% |
| Actual | 0.1% |
| Prior | 1.0% |
| Revised | 0.8% |
Lower than expected, due to weaker than expected auto sales, due to the wrong vehicles on the showroom floors, which will take a while to correct.
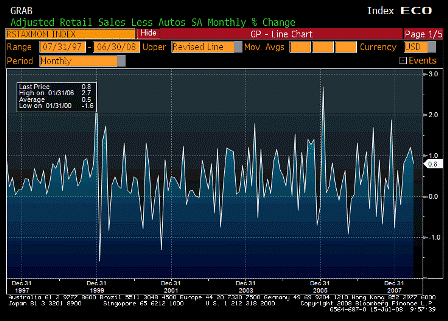
Retail Sales Less Autos MoM (Jun)
| Survey | 1.0% |
| Actual | 0.8% |
| Prior | 1.2% |
| Revised | n/a |
A little weaker than expected but pretty good from a strong previous month.
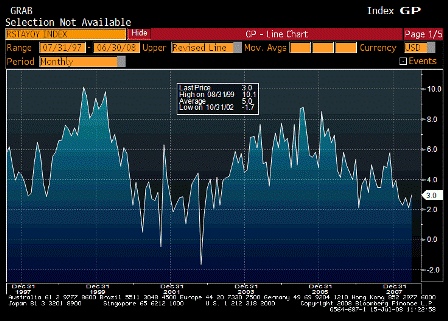
Advance Retail Sales YoY (Jun)
| Survey | n/a |
| Actual | 3.0% |
| Prior | 2.1% |
| Revised | n/a |
Once again fiscal policy, not monetary policy, stops the slide.
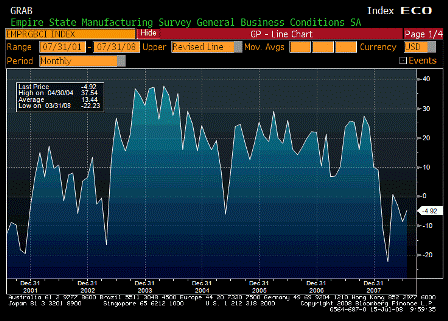
Empire Manufacturing (Jul)
| Survey | -8.0% |
| Actual | -4.9% |
| Prior | -8.7% |
| Revised | n/a |
May be on the mend from the lows.
Karim writes:
- Retail sales a bit softer than expected..up 0.1% headline, up 0.8% ex-autos, and -0.5% ex-gas
- Control (ex-autos, gas and building materials) up 0.3% and minor downward revisions to prior two months
- PPI up 1.8% headline and 0.2% core; y/y 9.2% and 3.0% respectively
- Pipeline pressures remain intense with intermediate up 2.1% m/m and crude 3.7%
- Medical goods and services component decline (large component of PCE deflator; so June core PCE may come in 0.0% or 0.1%).
- Empire survey shows modest improvement but stays in negative territory: -8.68 to -4.92
Right, Redbook sales show same moderate growth in non-auto sales. The wrong vehicles are on the showroom floors right now and it will take a while for the right ones to take their place.
I have no idea what’s driving lower medical costs and whether further declines are to be expected, but seems highly unlikely.
The dollar’s down again today.
‘Inflation’ is flowing in through that channel like water through a screen door on a submarine.
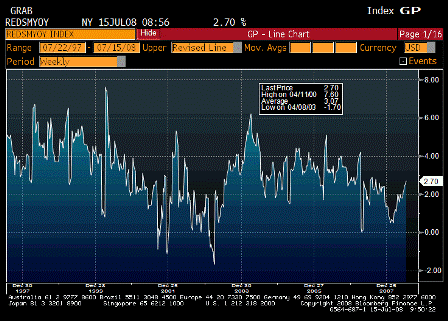
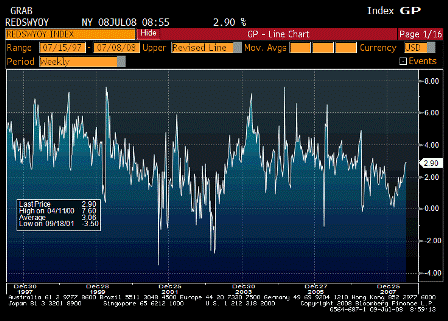
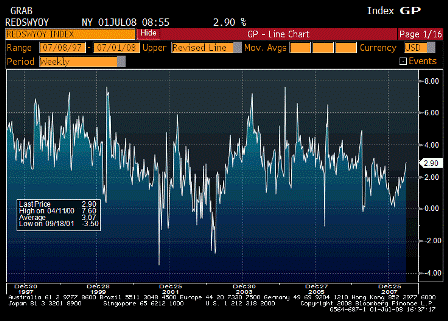
Redbook Store Sales (Jul 8)
| Survey | n/a |
| Actual | 2.7% |
| Prior | 2.6% |
| Revised | n/a |
Moving up as fiscal policy kicks in.
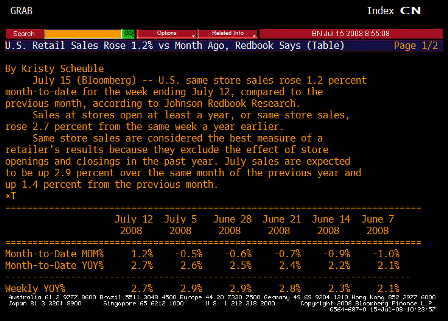
Redbook Store Sales TABLE (Jul 8)
IBD/TIPP Economics Optimism (Jul)
| Survey | 36.8 |
| Actual | 37.4 |
| Prior | 37.4 |
| Revised | n/a |
A little better than expected.
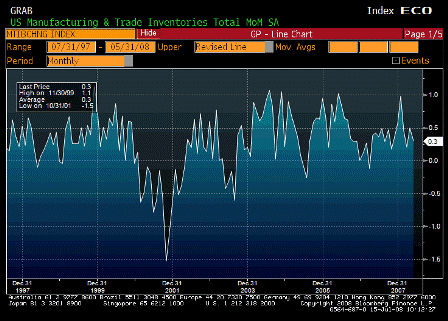
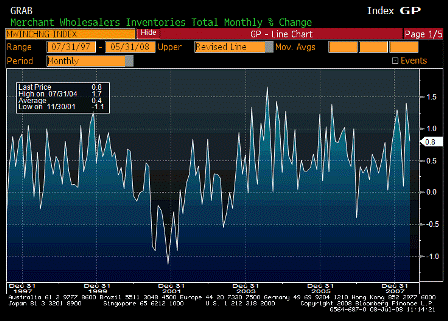
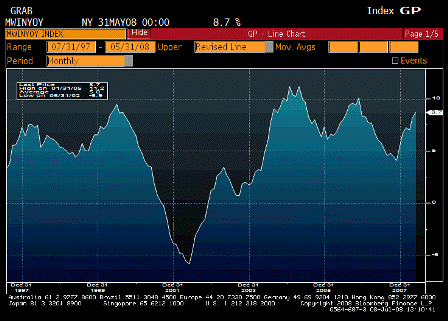
Business Inventories (May)
| Survey | 0.5% |
| Actual | 0.3% |
| Prior | 0.5% |
| Revised | n/a |
Possible that sales may be exceeding estimates and lowering inventories.
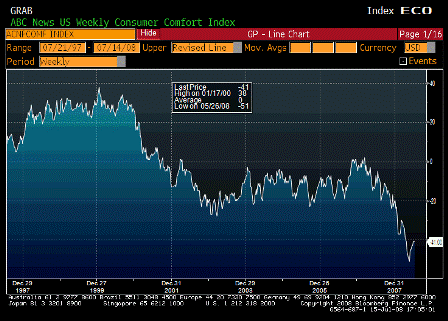
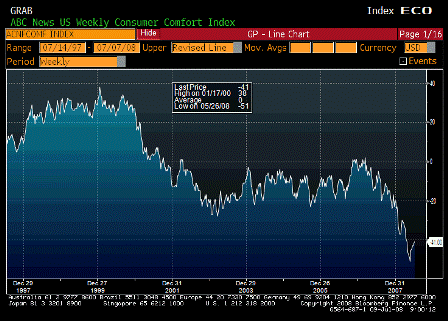
ABC Consumer Confidence (Jul 13)
| Survey | -41 |
| Actual | -41 |
| Prior | -41 |
| Revised | n/a |
Seems to have bottomed, but remains at low levels, probably due to inflation.
[top]


