2009-04-22 USER


[Skip to the end]


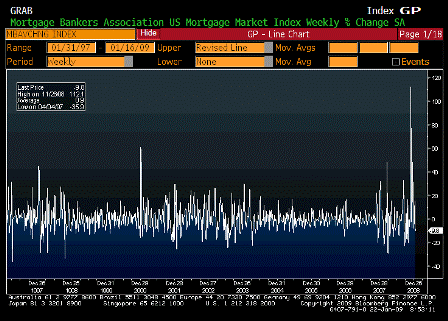
MBA Mortgage Applications (Apr 17)

Survey n/a
Actual 5.3%
Prior -11.0%
Revised n/a

[top][end]

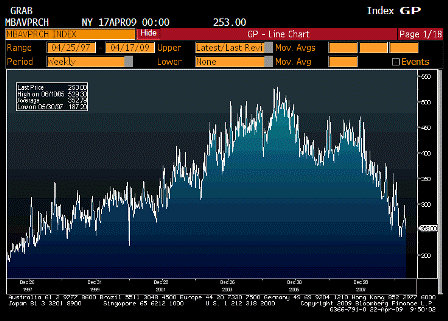
MBA Purchasing Applications (Apr 17)

Survey n/a
Actual 253.00
Prior 264.10
Revised n/a

[top][end]

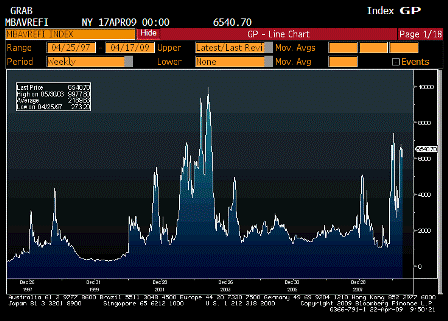
MBA Refinancing Applications (Apr 17)

Survey n/a
Actual 6540.70
Prior 6071.70
Revised n/a

[top][end]

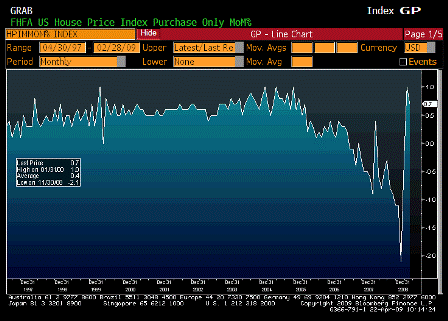
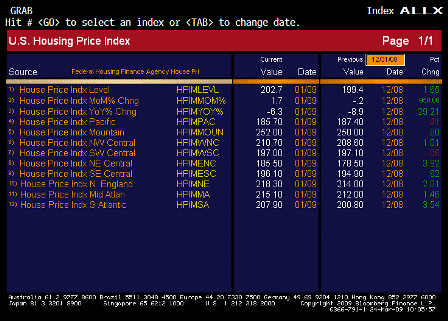
House Price Index MoM (Feb)

Survey -0.7%
Actual 0.7%
Prior 1.7%
Revised 1.0%

[top][end]

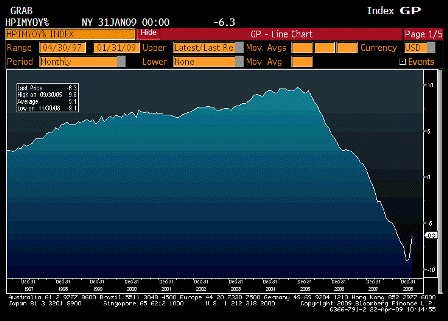
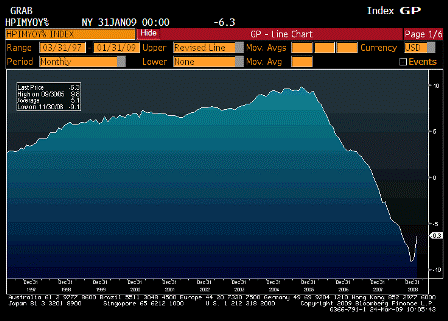
House Price Index YoY (Feb)

Survey n/a
Actual -6.3%
Prior -8.9%
Revised n/a

[top][end]

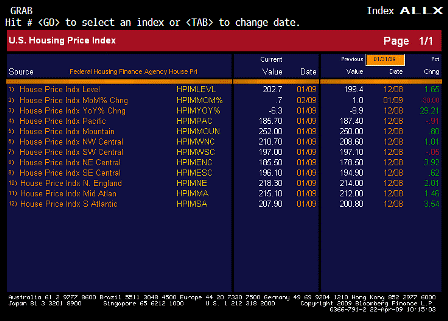
House Price Index ALLX (Feb)


[top]

2009-03-24 USER


[Skip to the end]


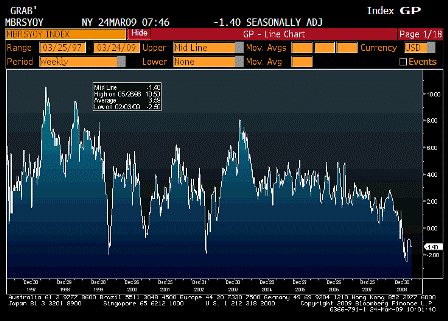
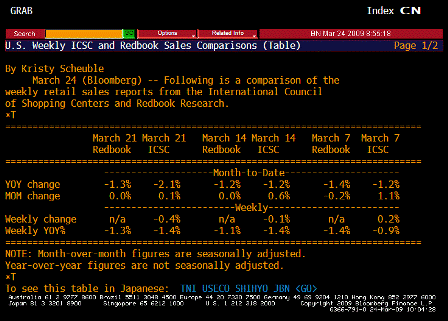
ICSC UBS Store Sales YoY (Mar 24)

Survey n/a
Actual -1.4%
Prior -1.4%
Revised n/a

[top][end]

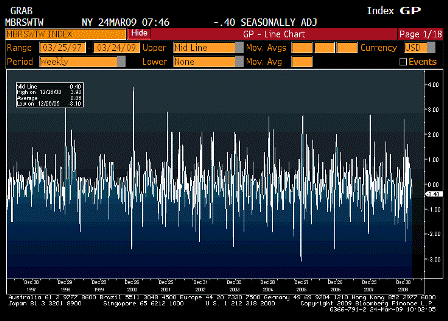
ICSC UBS Store Sales WoW (Mar 24)

Survey n/a
Actual -0.4%
Prior -0.1%
Revised n/a

[top][end]

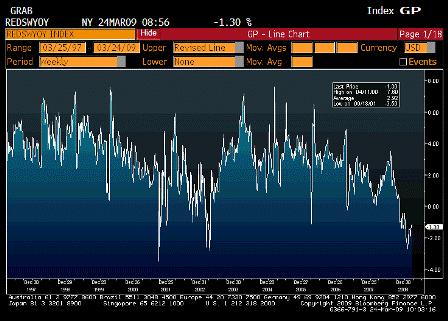
Redbook Store Sales Weekly YoY (Mar 24)

Survey n/a
Actual -1.3%
Prior -1.1%
Revised n/a

[top][end]

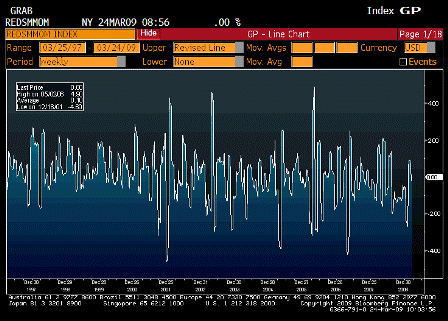
Redbook Store Sales MoM (Mar 24)

Survey n/a
Actual 0.0%
Prior 0.0%
Revised n/a

[top][end]

ICSC UBS Redbook Comparison TABLE (Mar 24)

[top][end]


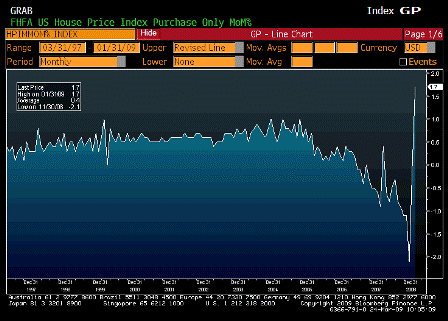
House Price Index MoM (Jan)

Survey -0.9%
Actual 1.7%
Prior 0.1%
Revised -0.2%

[top][end]

House Price Index YoY (Jan)

Survey n/a
Actual -6.3%
Prior -8.9%
Revised n/a

[top][end]

House Price Index ALLX (Jan)

[top][end]


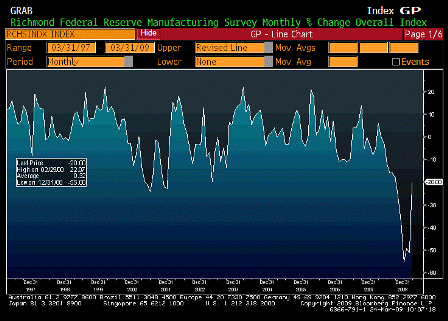
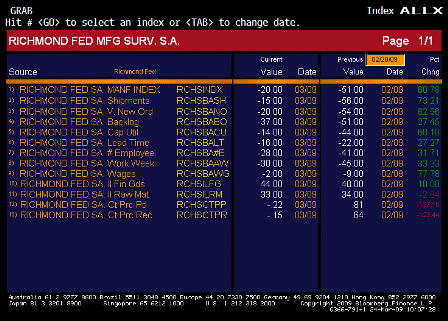
Richmond Fed Manufacturing Survey (Mar)

Survey -51
Actual -20
Prior -51
Revised n/a

[top][end]

Richmond Fed Manufacturing Survey ALLX (Mar)


[top]

2009-01-22 USER


[Skip to the end]


MBA Mortgage Applications (Jan 16)

Survey n/a
Actual -9.8%
Prior 15.8%
Revised n/a

[top][end]

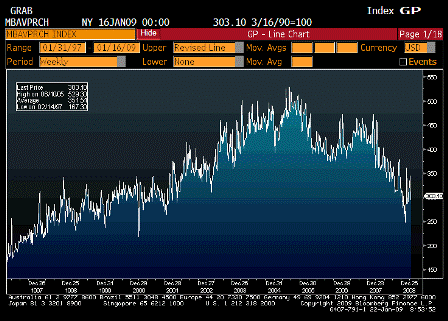
MBA Purchasing Applications (Jan 16)

Survey n/a
Actual 303.10
Prior 295.10
Revised n/a

[top][end]

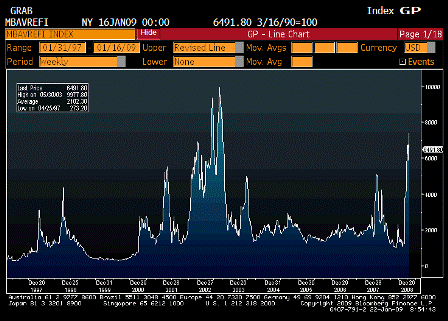
MBA Refinancing Applications (Jan 16)

Survey n/a
Actual 6491.80
Prior 7414.10
Revised n/a

[top][end]

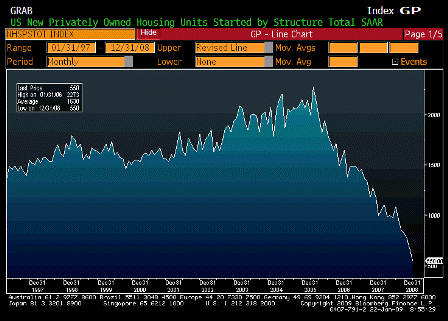
Housing Starts (Dec)

Survey 605K
Actual 550K
Prior 625K
Revised 651K

 
Karim writes:

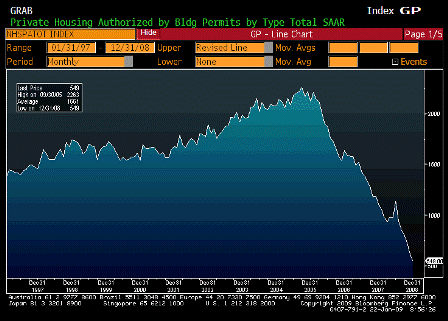
  • Housing starts fell 16% in December and building permits fell 10.7%, and both to all-time lows in nominal terms.
  • These numbers indicate that housing will be a drag on the economy in terms of GDP accounting at least through year-end.
  • The level of starts consistent with new household formation (and adjusting for obsolescence of the existing housing stock) is about 1.25mm.
  • But what the current level of starts of 550k does not reflect is the record level of vacant homes (about 1mm more than the 1985-2005 average).

[top][end]

Building Permits (Dec)

Survey 600K
Actual 549K
Prior 616K
Revised 615K

[top][end]

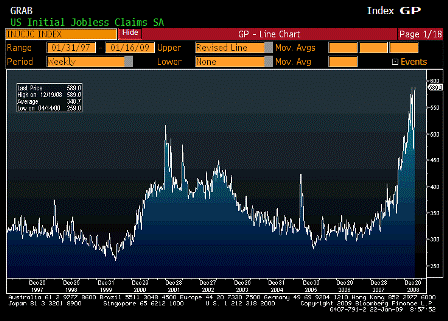
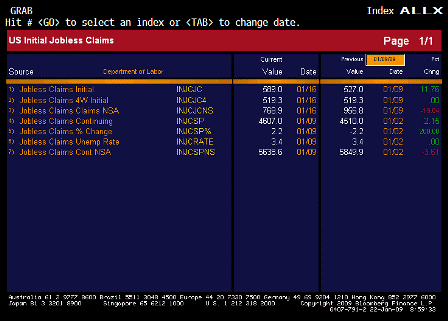
Initial Jobless Claims (Jan 17)

Survey 543K
Actual 589K
Prior 524K
Revised 527K

 
Karim writes:

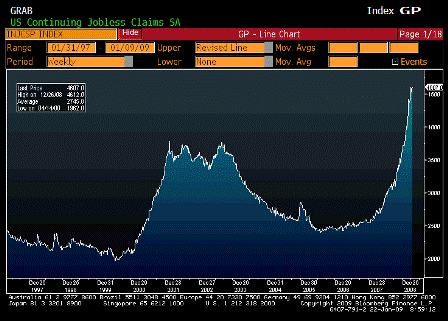
  • Initial claims jumped 62k to 589k, and continuing claims by 93k to 4607k.
  • Both are new highs for the current cycle and the highest since 1982.

[top][end]

Continuing Claims (Jan 10)

Survey 4534K
Actual 4607K
Prior 4497K
Revised 4510K

[top][end]

Jobless Claims ALLX (Jan 17)

[top][end]

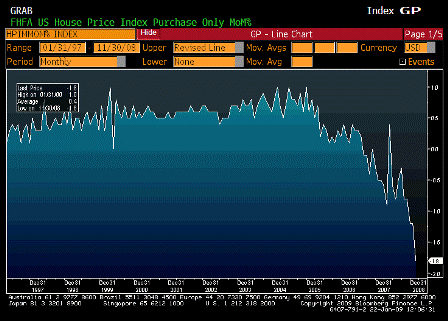
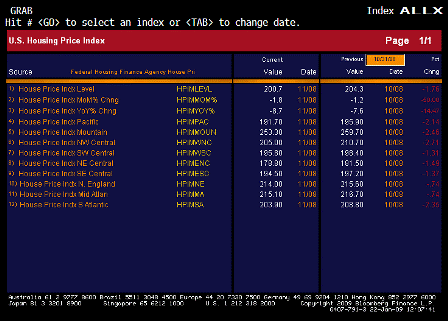
House Price Index MoM (Nov)

Survey -1.2%
Actual -1.8%
Prior -1.1%
Revised n/a

[top][end]

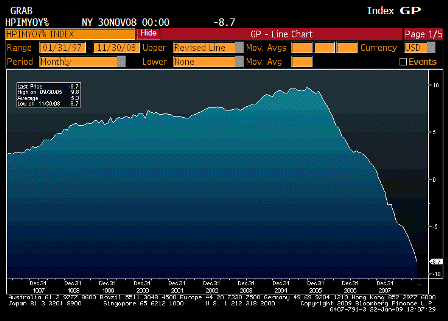
House Price Index YoY (Nov)

Survey n/a
Actual -8.7%
Prior -7.6%
Revised n/a

[top][end]

House Price Index ALLX (Nov)


[top]

2008-12-23 USER


[Skip to the end]


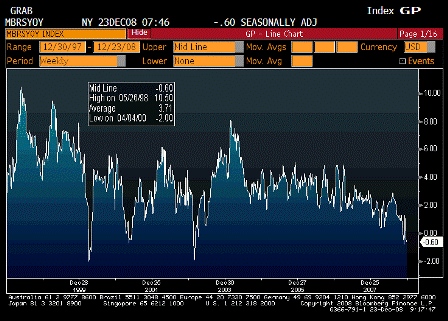
ICSC UBS Store Sales YoY (Dec 23)

Survey n/a
Actual -0.60%
Prior -0.40%
Revised n/a

 
Continues to slip.

[top][end]

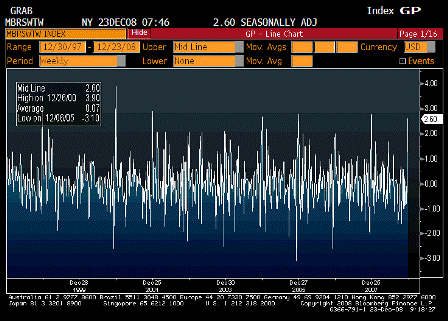
ICSC UBS Store Sales WoW (Dec 23)

Survey n/a
Actual 2.60%
Prior 0.60%
Revised n/a

 
Cheaper gasoline helping some?

[top][end]
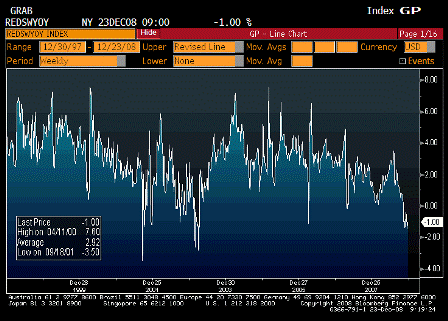
Redbook Store Sales Weekly YoY (Dec 16)

Survey n/a
Actual -1.00%
Prior -1.40%
Revised n/a

 
Still slipping.

[top][end]

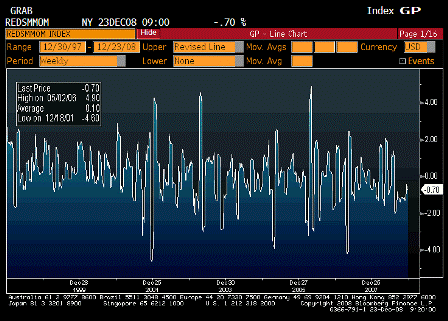
Redbook Store Sales MoM (Dec 16)

Survey n/a
Actual -0.70%
Prior -0.70%
Revised n/a

 
Still slipping.

No meaningul sign of cheaper gasoline helping here yet.

[top][end]
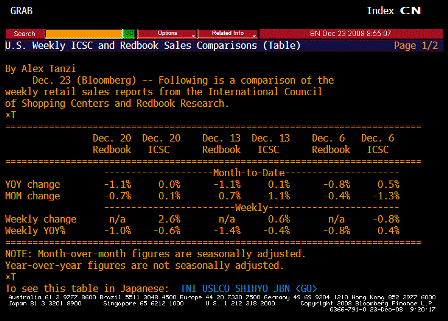
ICSC UBS Redbook Comparison TABLE (Dec 16)

[top][end]
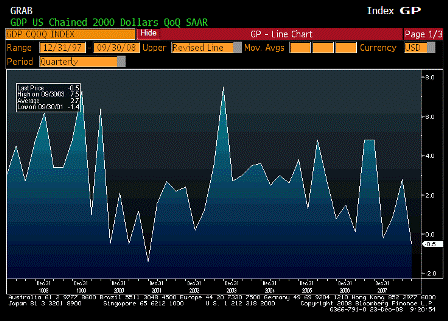

GDP QoQ Annualized (3Q F)

Survey -0.5%
Actual -0.5%
Prior -0.5%
Revised n/a

 
As expected.

[top][end]

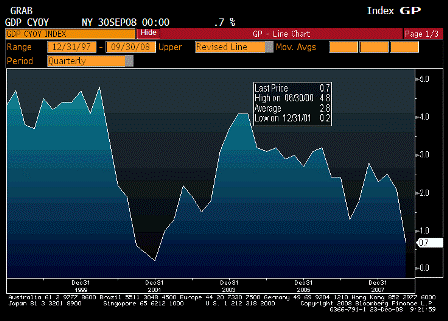
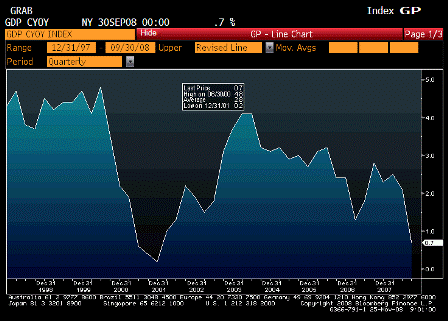
GDP YoY Annualized Real (3Q F)

Survey n/a
Actual 0.70%
Prior 2.1%
Revised n/a

 
Tiny positive for the year.

Next quarter looking negative.

[top][end]
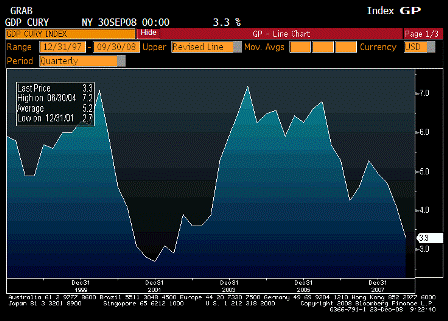
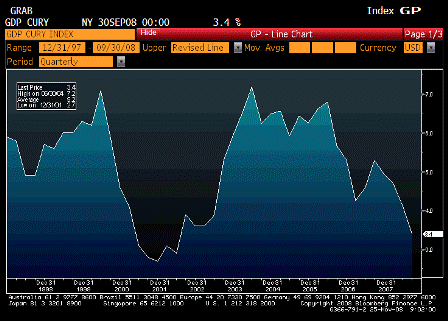
GDP YoY Annualized Nominal (3Q F)

Survey n/a
Actual 3.3%
Prior 4.1%
Revised n/a

 
This is heading to new lows as well.

[top][end]
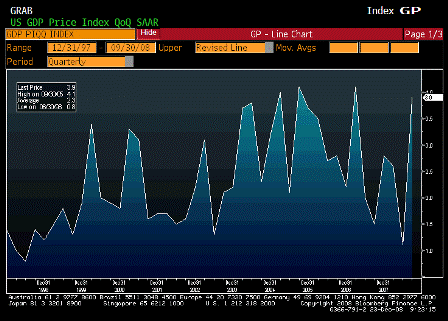
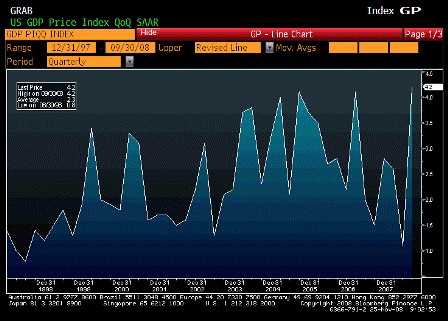
GDP Price Index (3Q F)

Survey 4.25
Actual 3.9%
Prior 4.2%
Revised n/a

 
Should reverse.

[top][end]

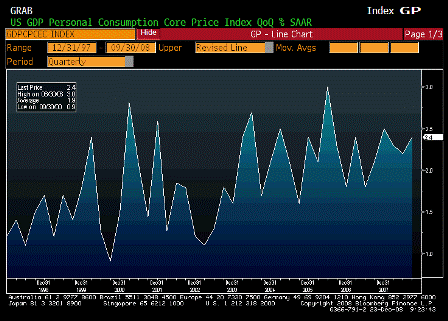
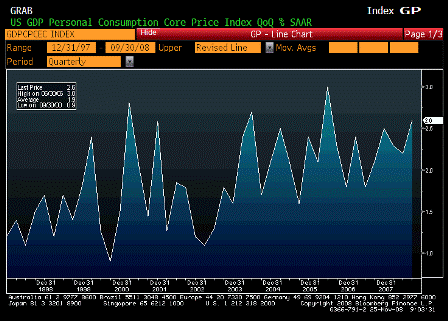
Core PCE QoQ (3Q F)

Survey 2.6%
Actual 2.4%
Prior 2.6%
Revised n/a

 
Should reverse some.

[top][end]

GDP ALLX 1 (3Q F)

[top][end]
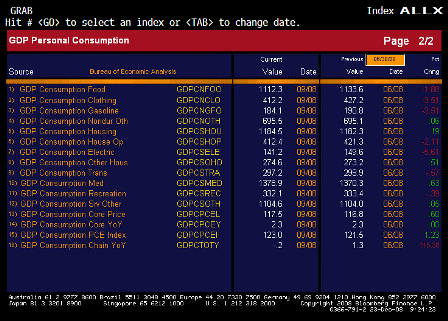
GDP ALLX 2 (3Q F)

[top][end]
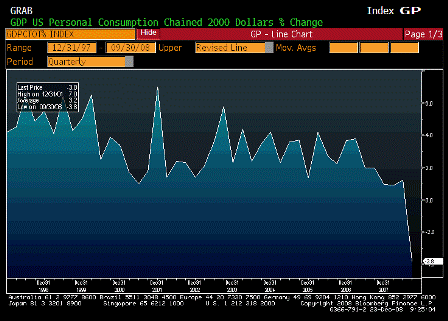

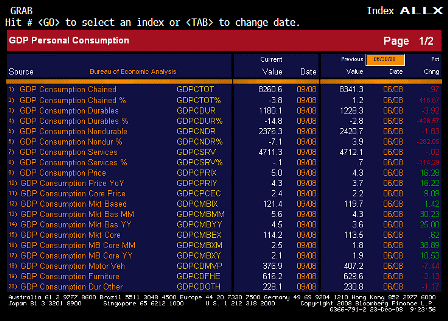
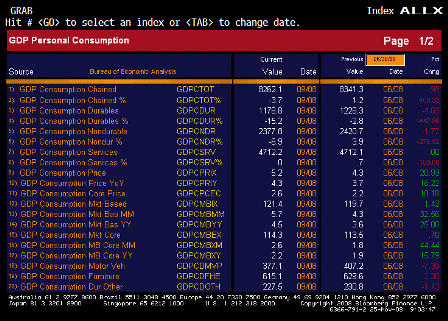
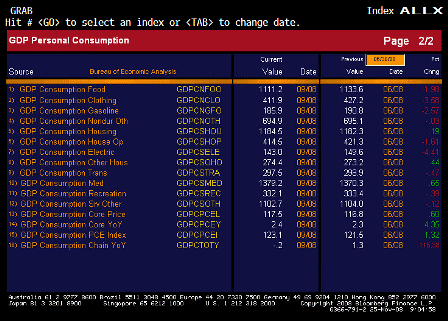
Personal Consumption (3Q F)

Survey -3.7%
Actual -3.8%
Prior -3.7%
Revised n/a

 
Sudden fall from ‘muddling through’ to recession.

[top][end]
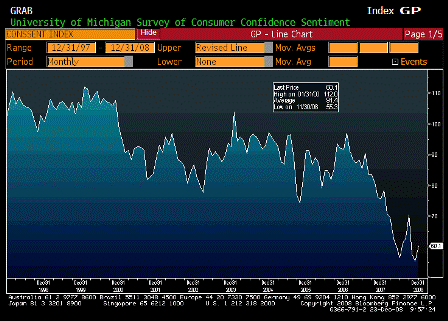
Univ of Michigan Confidence (Dec F)

Survey 58.8
Actual 60.1
Prior 59.1
Revised n/a

 
Gasoline prices helping here.

[top][end]
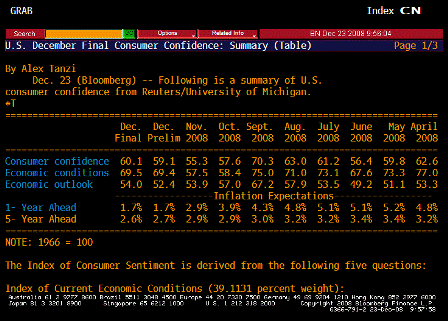
Univ of Michigan TABLE Inflation Expectations (Dec F)

 
Back to where the Fed wants them to be.

[top][end]
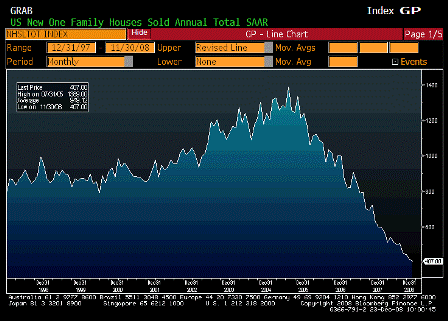

New Home Sales (Nov)

Survey 415k
Actual 407k
Prior 433k
Revised 419k

 
A bit lower than expected and last month revised down some.

[top][end]
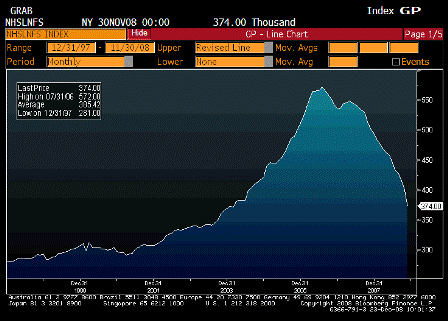
New Home Sales Total for Sale (Nov)

Survey n/a
Actual 374.00
Prior 402.00
Revised n/a

 
Down to very low levels and one reason sales are low.

[top][end]
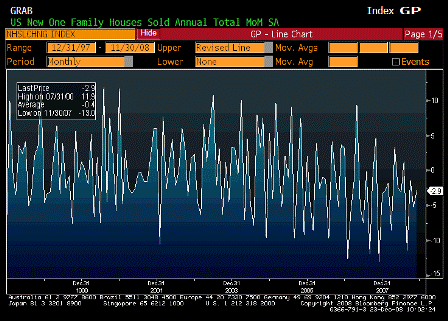
New Home Sales MoM (Nov)

Survey n/a
Actual -2.9%
Prior -5.2%
Revised n/a

[top][end]

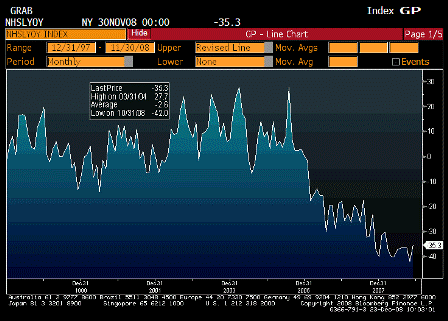
New Home Sales YoY (Nov)

Survey n/a
Actual -35.3%
Prior -42.0%
Revised n/a

[top][end]

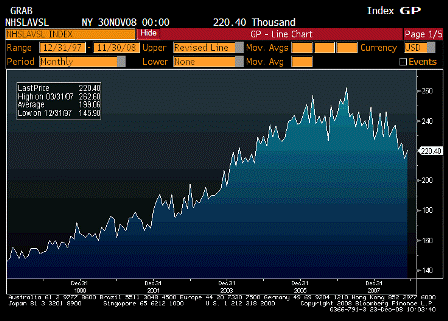
New Home Sales Median Price (Nov)

Survey n/a
Actual 220.40
Prior 214.60
Revised n/a

 
Up, but still trending lower.

[top][end]
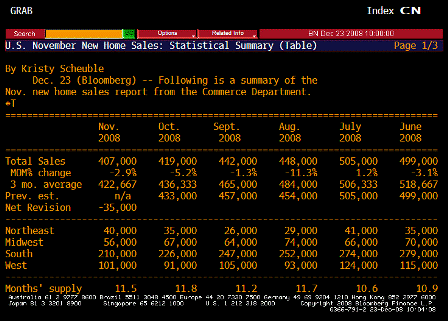
New Home Sales TABLE 1 (Nov)

[top][end]
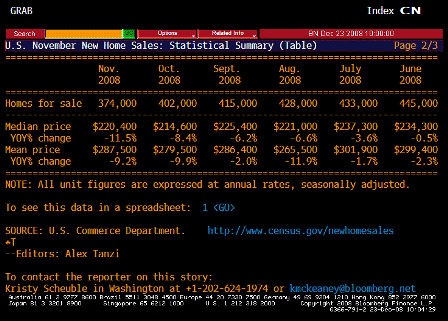
New Home Sales TABLE 2 (Nov)

[top][end]
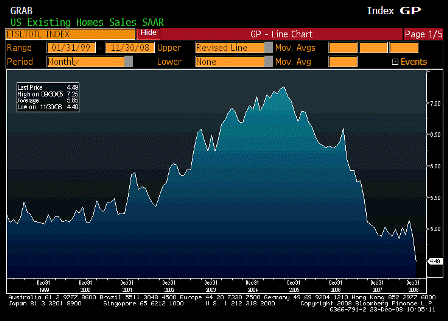

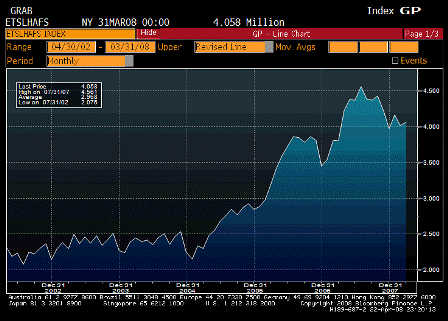
Existing Home Sales (Nov)

Survey 4.93M
Actual 4.49M
Prior 4.98M
Revised 4.91M

 
Large drop.

[top][end]

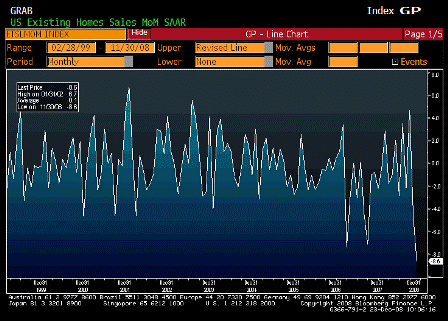
Existing Home Sales MoM (Nov)

Survey -1.0%
Actual -8.6%
Prior -3.1%
Revised -4.5%

[top][end]

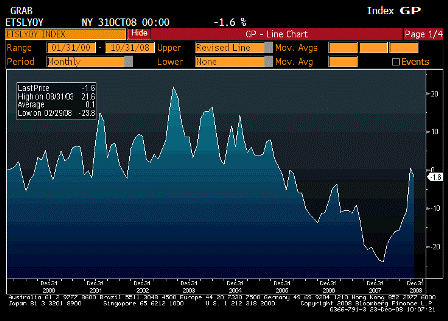
Existing Home Sales YoY (Nov)

Survey n/a
Actual -1.6%
Prior 0.6%
Revised n/a

 
Still well off the bottom.

[top][end]

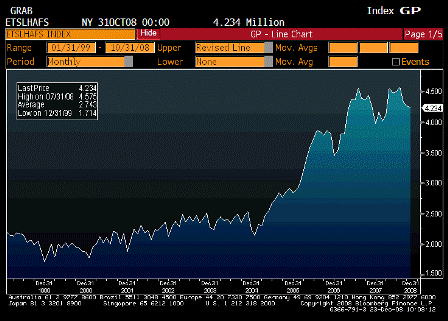
Existing Home Sales Inventory (Nov)

Survey n/a
Actual 4.234
Prior 4.272
Revised n/a

 
Falling some, but new foreclosures probably keeping this high.

[top][end]
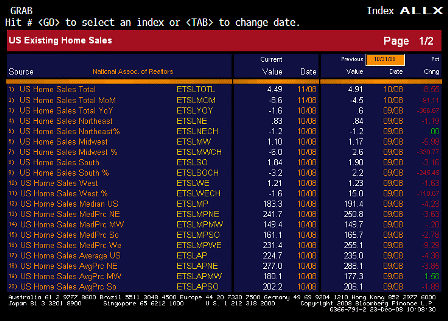
Existing Home Sales ALLX 1 (Nov)

[top][end]
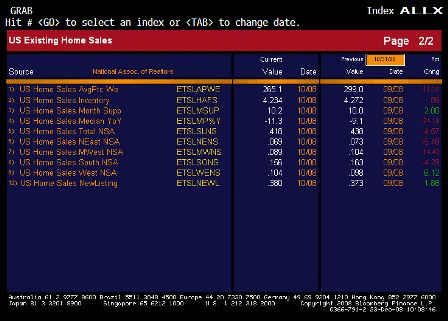
Existing Home Sales ALLX 2 (Nov)

[top][end]
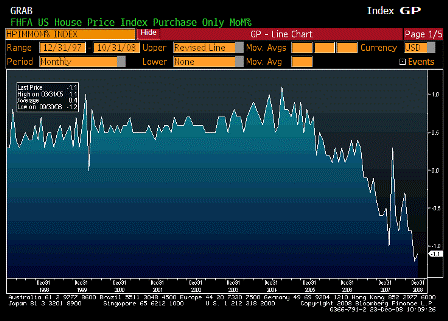

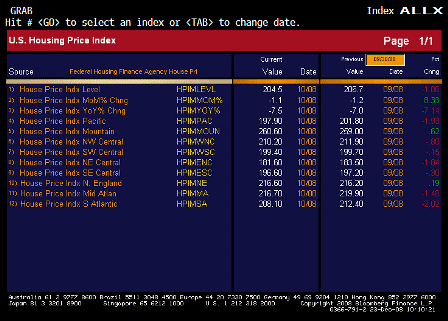
House Price Index MoM (Oct)

Survey -1.3%
Actual -1.1%
Prior -1.3%
Revised -1.2%

 
Still falling.

[top][end]

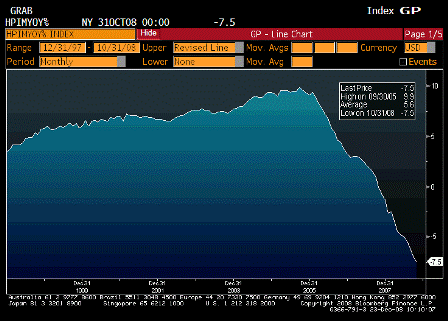
House Price Index YoY (Oct)

Survey n/a
Actual -7.5%
Prior -7.0%
Revised n/a

 
No bottom in sight yet.

[top][end]

House Price Index ALLX (Nov)

[top][end]
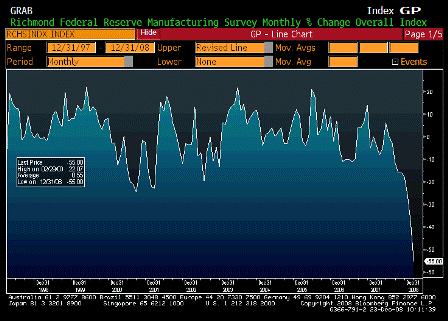
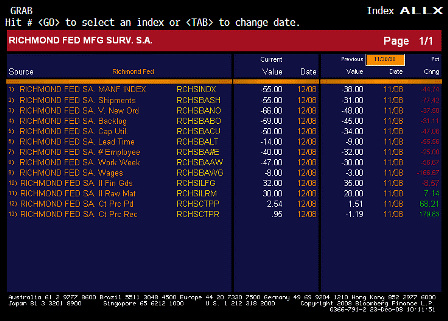
Richmond Fed Manufacturing Index (Dec)

Survey -40
Actual -55
Prior -38
Revised n/a

 
Very weak.

[top][end]

Richmond Fed Manufacturing Index ALLX (Dec)


[top]
2008-11-25 USER


[Skip to the end]


Karim writes:

  • Overlooked with the Fed headlines, but likely to lead to further downward revisions to Q4/Q1 growth outlook.

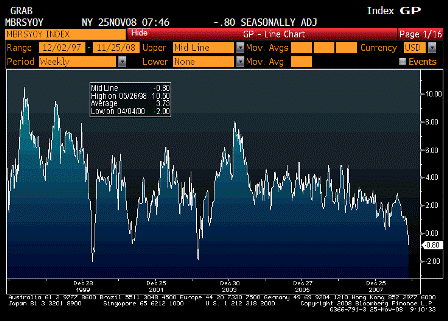
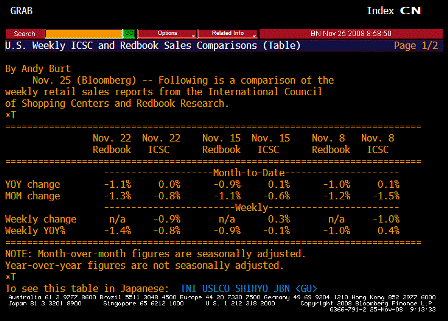
ICSC UBS Store Sales YoY (Nov 25)

Survey n/a
Actual -0.80%
Prior -0.10%
Revised n/a

 
Looking very soft, even with low gasoline prices.

[top][end]

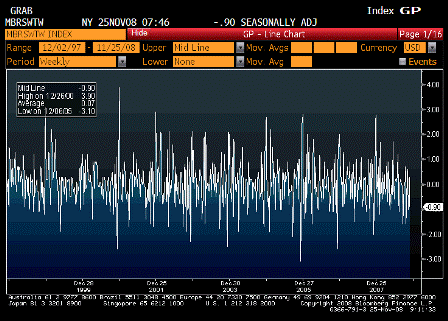
ICSC UBS Store Sales WoW (Nov 25)

Survey n/a
Actual -0.90%
Prior 0.30%
Revised n/a

[top][end]

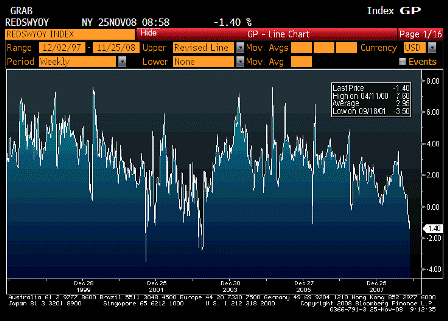
Redbook Store Sales Weekly YoY (Nov 25)

Survey n/a
Actual -1.40%
Prior -0.90%
Revised n/a

 
Same.

[top][end]

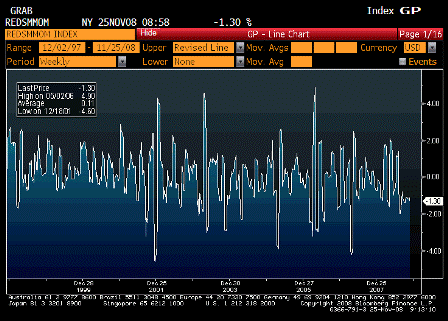
Redbook Store Sales MoM (Nov 25)

Survey n/a
Actual -1.30%
Prior -1.10%
Revised n/a


Karim writes:

  • Johnson Redbook sales down 1.3% m/m thru 3rd week of November.
  • Another negative retail sales month sets up Q4 real GDP for at least -4%

[top][end]

ICSC UBS Redbook Comparison TABLE (Nov 25)

[top][end]


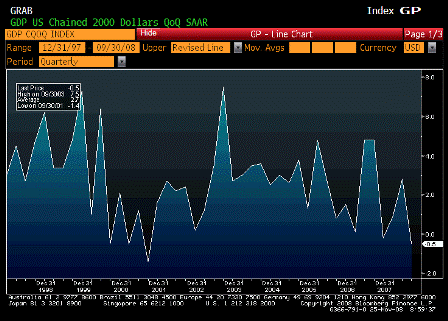
GDP QoQ Annualized (3Q P)

Survey -0.5%
Actual -0.5%
Prior -0.3%
Revised n/a

 
As expected and in line with the longer term down trend in real gdp growth

Good evidence of a continuing and increasing lack of aggregate demand.

[top][end]

GDP YoY Annualized Real (3Q P)

Survey n/a
Actual 0.7%
Prior 2.1%
Revised n/a

 
Mildly positive but the trend is still looking down.

[top][end]

GDP YoY Annualized Nominal (3Q P)

Survey n/a
Actual 3.4%
Prior 4.1%
Revised n/a

 
Barely positive.

[top][end]

GDP Price Index (3Q P)

Survey 4.2%
Actual 4.2%
Prior 4.2%
Revised n/a

 
High but expected to fall with falling commodity prices.

[top][end]

Core PCE QoQ (3Q P)

Survey 2.9%
Actual 2.6%
Prior 2.9%
Revised n/a

 
Looks to be in a long term uptrend, though also expected to fall with commodity prices.

[top][end]

GDP ALLX 1 (3Q P)

[top][end]

GDP ALLX 2 (3Q P)

[top][end]


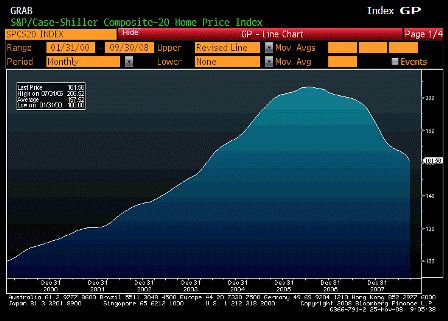
S&P Case Shiller Home Price Index (Sep)

Survey 163.00
Actual 161.56
Prior 164.57
Revised 164.40

 
Took a turn for the worse.

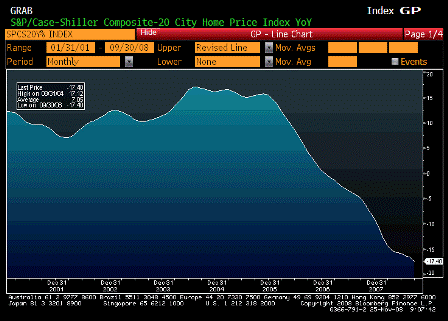
Karim writes:

  • Case Shiller down 1.85% q/q and -17.4% y/y

[top][end]

S&P CS Composite 20 YoY (Sep)

Survey -16.90%
Actual -17.40%
Prior -16.62%
Revised -16.60%

[top][end]

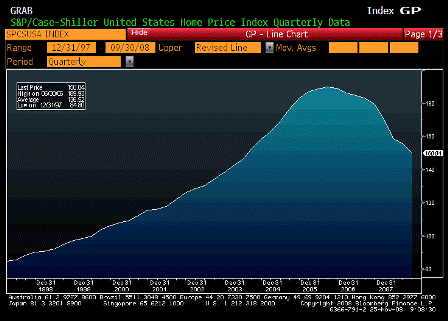
S&P Case Shiller US Home Price Index (3Q)

Survey n/a
Actual 150.04
Prior 155.32
Revised 155.45

[top][end]

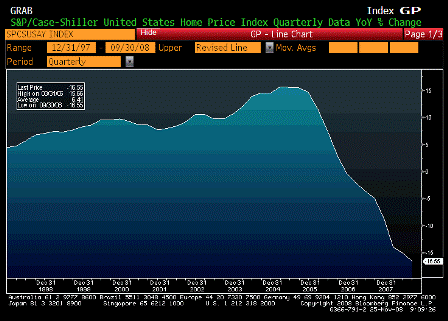
S&P Case Shiller US Home Price Index YoY (3Q)

Survey -17.05%
Actual -16.55%
Prior -15.40%
Revised -15.07%

[top][end]


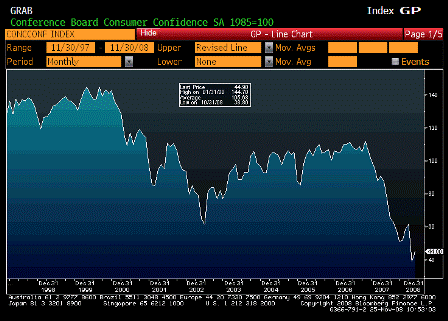
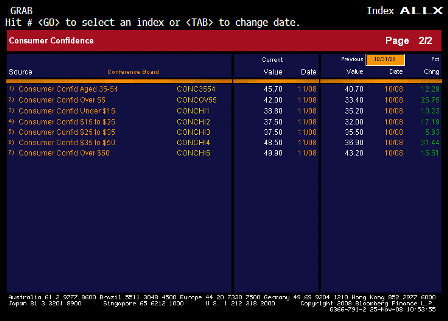
Consumer Confidence (Nov)

Survey 38.0
Actual 44.9
Prior 38.0
Revised 38.8

 
Tiny blip up- well above expectations.

[top][end]

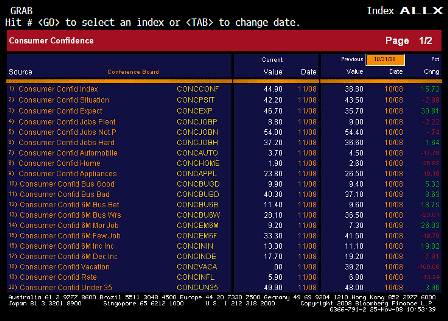
Consumer Confidence ALLX 1 (Nov)

[top][end]

Consumer Confidence ALLX 2 (Nov)

[top][end]


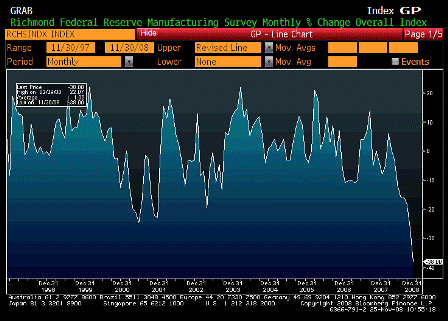
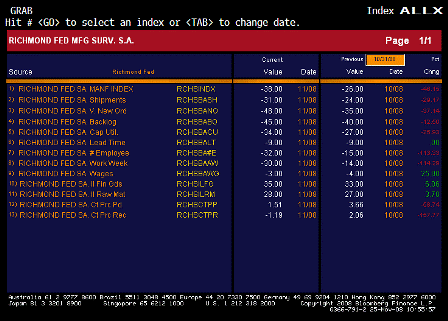
Richmond Fed Manufacturing Index (Nov)

Survey -27
Actual -38
Prior -26
Revised n/a

 
Far worse than expected, more in line with Q4 GDP forecasts of -4%.

[top][end]

Richmond Fed Manufacturing Index ALLX (Nov)

[top][end]


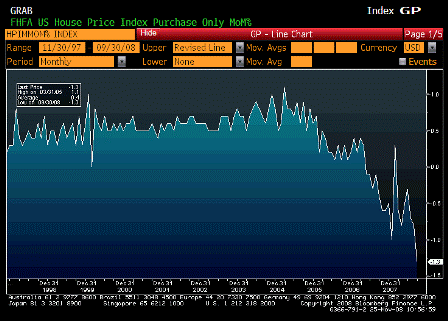
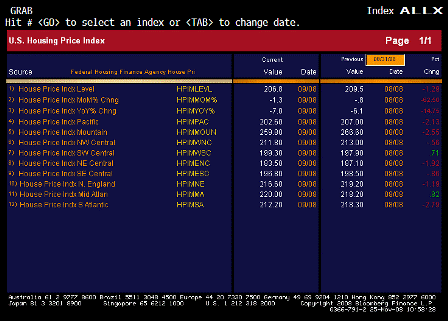
House Price Index MoM (Sep)

Survey -0.7%
Actual -1.3%
Prior -0.6%
Revised -0.8%

 
Also falling like a rock.

[top][end]

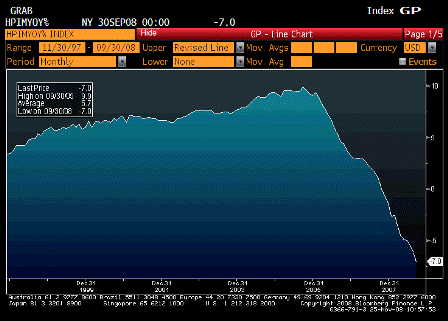
House Price Index YoY (Sep)

Survey n/a
Actual -7.0%
Prior -6.1%
Revised n/a

 
No sign of turning around yet.

[top][end]

House Price Index ALLX (Sep)

[top][end]

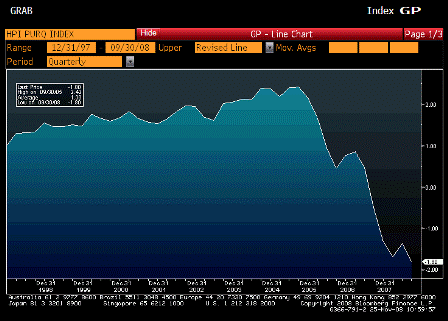
House Price Purchase Index QoQ (3Q)

Survey n/a
Actual -1.8%
Prior -1.4%
Revised n/a

 
The decline has resumed.


[top]

2008-10-23 USER


[Skip to the end]


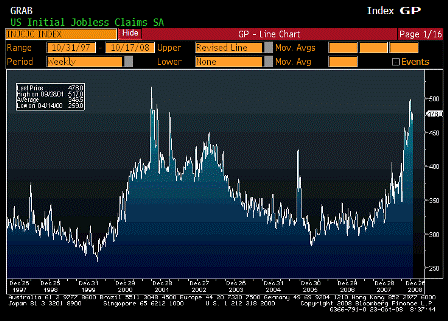
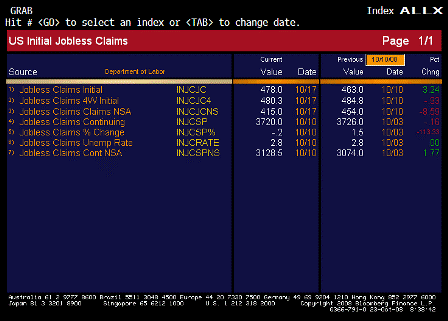
Initial Jobless Claims (Oct 18)

Survey 468K
Actual 478K
Prior 461K
Revised 463K

 
Hurricane added 12,000. Based on other economic stats and surveys this could get a lot worse.

[top][end]

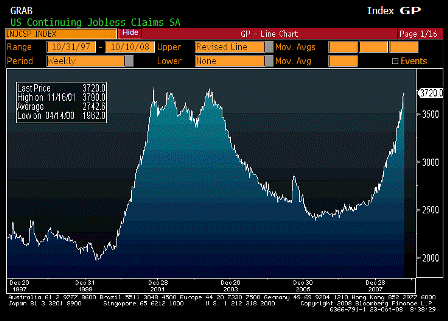
Continuing Claims (Oct 11)

Survey 3715K
Actual 3720K
Prior 3711K
Revised 3726K

 
A slight pullback. This is getting into recession levels.

[top][end]

Jobless Claims ALLX (Oct 18)

[top][end]


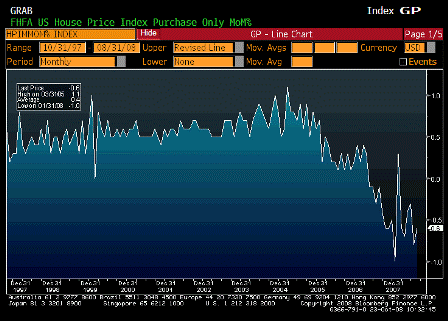
House Price Index MoM (Aug)

Survey -0.5%
Actual -0.6%
Prior -0.6%
Revised -0.8%

 
A little worse than expected and rates of decline may have leveled off.

[top][end]

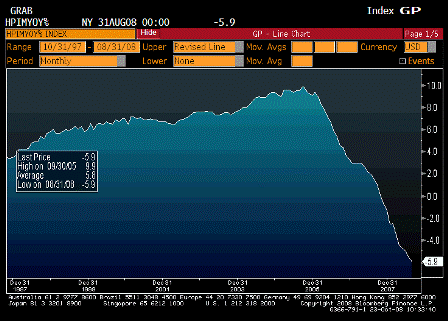
House Price Index YoY (Aug)

Survey n/a
Actual -5.9%
Prior -5.5%
Revised n/a

 
Still falling but at perhaps moderating rates.

[top][end]

House Price Index ALLX (Aug)


[top]

2008-09-23 USER


[Skip to the end]


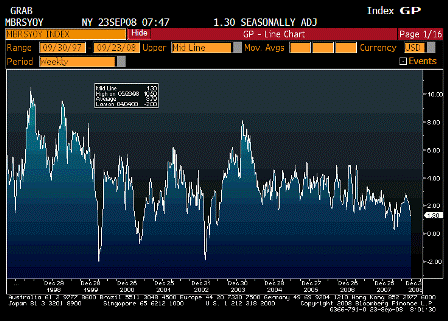
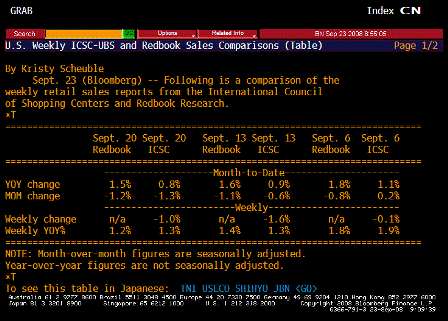
ICSC-UBS Store Sales YoY (Sep. 23)

Survey n/a
Actual 1.3%
Prior 1.3%
Revised n/a

 
Holding steady off the lows.

[top][end]

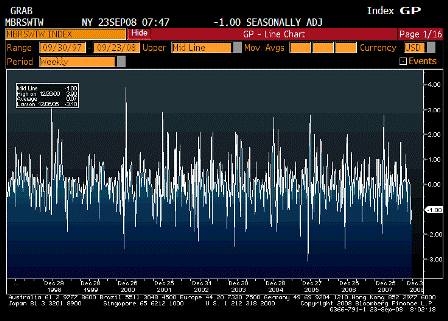
ICSC-UBS Store Sales WoW (Sep 23)

Survey n/a
Actual -1.00%
Prior -1.60%
Revised n/a

[top][end]

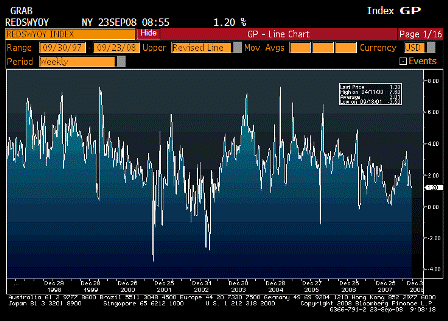
Redbook Store Sales Weekly YoY (Sep 23)

Survey n/a
Actual 1.2%
Prior 1.4%
Revised n/a

 
Steady and off the lows as well.

[top][end]

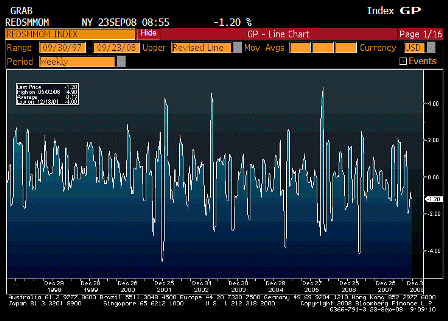
Redbook Store Sales MoM (Sep 23)

Survey n/a
Actual -1.20%
Prior -1.10%
Revised n/a

[top][end]

ICSC-UBS Redbook Comparison TABLE (Sep 23)

[top][end]


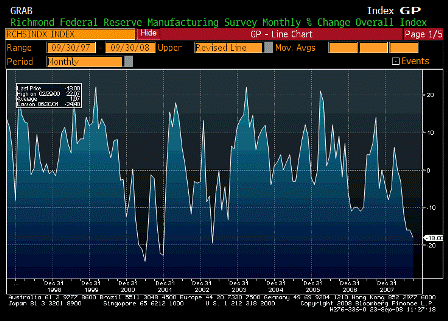
Richmond Fed Manufacturing Index (Sep)

Survey -12
Actual -18
Prior -16
Revised n/a

 
Worse than expected and looking very weak.

[top][end]

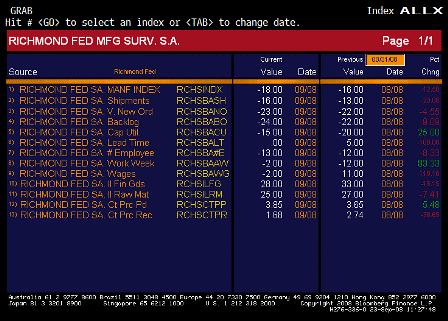
Richmond Fed Manufacturing Index ALLX (Sep)

[top][end]


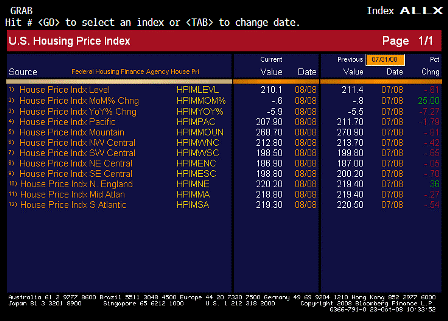
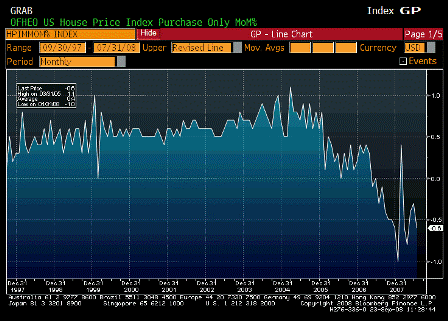
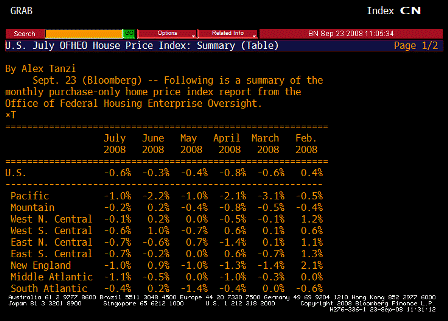
House Price Index MoM (Jul)

Survey -0.2%
Actual -0.6%
Prior 0.0%
Revised -0.3%

 
Weaker than expected but still off the lows and seems to be working it’s way irregularly higher.

[top][end]

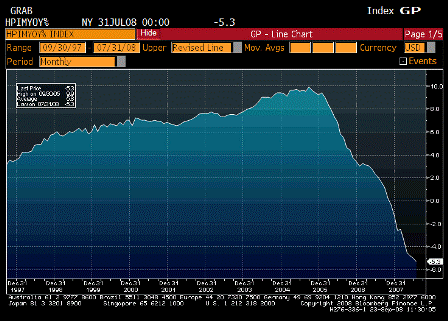
House Price Index YoY (Jul)

Survey n/a
Actual -5.3%
Prior -5.0%
Revised n/a

 
Losing 5.3% year over year is a lot for this index.

[top][end]

House Price Index TABLE (Jul)


[top]
2008-04-22 US Economic Releases

  • Existing Home Sales
  • House Price Index
  • Richmond Fed Manufacturing Index
  • ABC Consumer Confidence

2008-04-22 Existing Home Sales

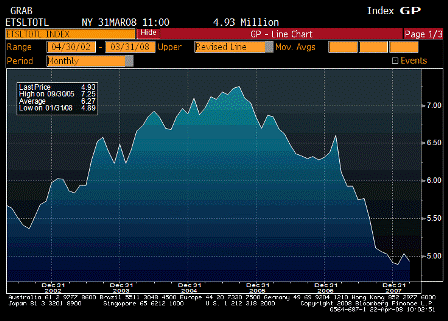
Existing Home Sales (Mar)

Survey 4.92M
Actual 4.93M
Prior 5.03M
Revised n/a

2008-04-22 Existing Home Sales MoM

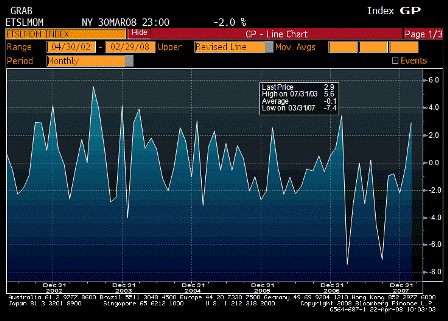
Existing Home Sales MoM (Mar)

Survey -2.3%
Actual -2.0%
Prior 2.9%
Revised n/a

Better than expected.
Might really be a bottom forming.


2008-04-22 House Price Index MoM

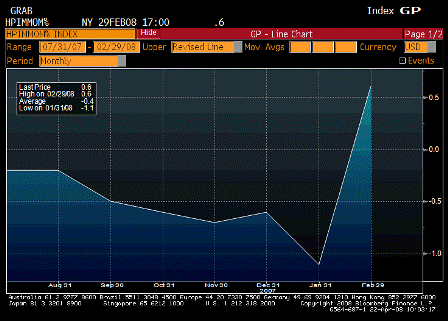
House Price Index MoM (Feb)

Survey -1.5%
Actual 0.6%
Prior -1.1%
Revised -1.0%

Up? Who would have thought?


2008-04-22 Richmond Fed Manufacturing Index

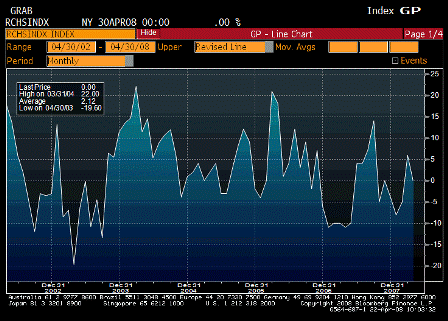
Richmond Fed Manufacturing Index

Survey -1
Actual 0
Prior 6
Revised n/a

2008-04-22 Richmond Fed Manufacturing Index TABLE

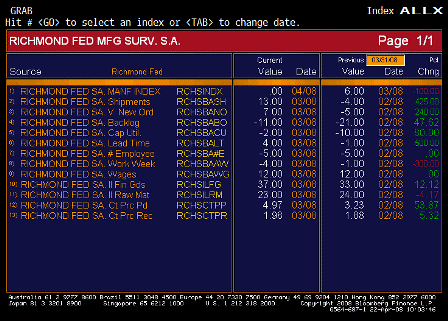
Richmond Fed Manufacturing Index TABLE

Yes, another number better than expected and not looking so bad?

Fiscal package kicking in soon as well.

Prices firm through the slowdown, wonder what they might do if the economy stabilizes?


2008-04-22 ABC Consumer Confidence

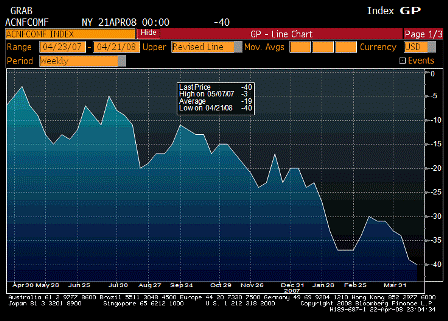
ABC Consumer Confidence (Apr 20)

Survey n/a
Actual -40
Prior -39
Revised n/a

Still constant negative news on TV.

2008-03-25 US Economic Releases

2008-03-25 S&P-CS Home Price Index

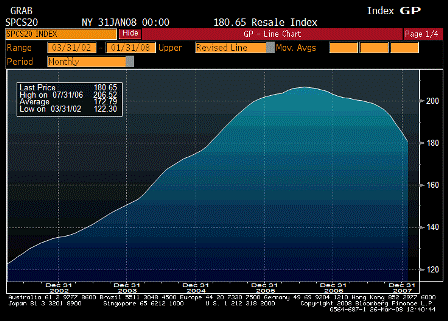
S&P-CS Home Price Index (Jan)

Survey n/a
Actual 180.7
Prior 184.9
Revised 185.0

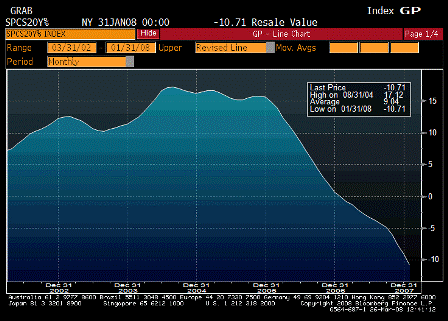
2008-03-25 S&P-CS Composite 20 YoY

S&P-CS Composite-20 YoY (Jan)

Survey -10.5%
Actual -10.7%
Prior -9.1%
Revised -9.0%

Still falling.  January/Winter numbers.  Lagging indicators.

Just kicked in in March.


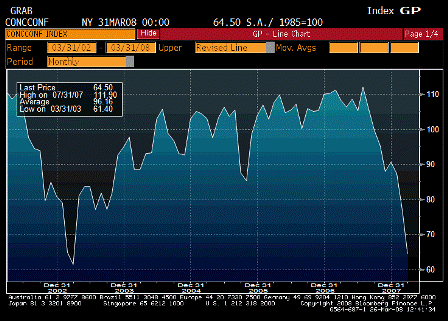
2008-03-25 Consumer Confidence

Consumer Confidence (Mar)

Survey 73.5
Actual 64.5
Prior 75.0
Revised 76.4

Down sharply, a lagging indicator, and subject to sharp reversals.


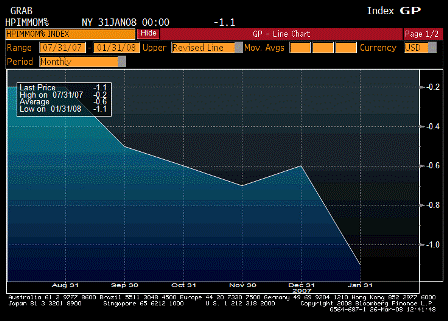
2008-03-25 House Price Index MoM

House Price Index MoM (Jan)

Survey n/a
Actual -1.1%
Prior -0.2%
Revised -0.6%

Was still heading south in January.


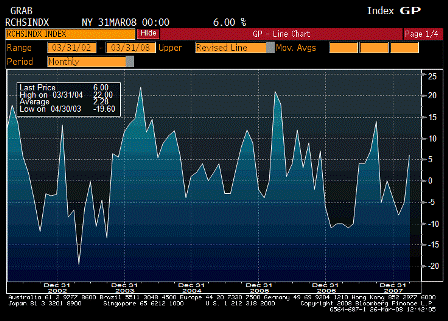
2008-03-25 Richmond Fed Manufacturing Index

Richmond Fed Manufacturing Index (Mar)

Survey -5
Actual 6
Prior -5
Revised n/a

Quite a few March numbers are looking up.


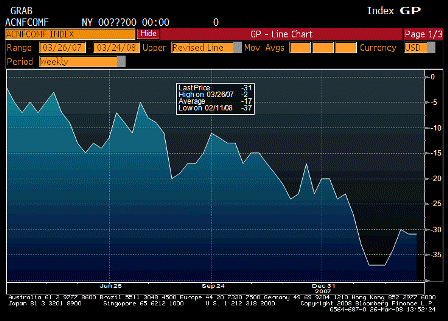
2008-03-25 ABC Consumer Confidence

ABC Consumer Confidence (Mar 23)

Survey n/a
Actual -31
Prior -31
Revised n/a

Another March number that shows some signs of life after a rough winter.