2008-05-29 US Economic Releases


[Skip to the end]


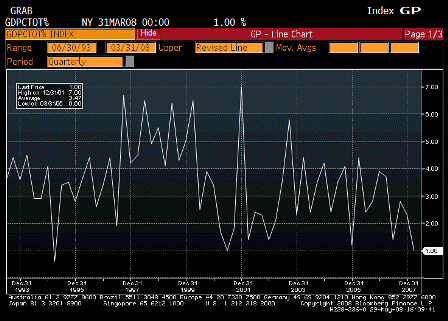
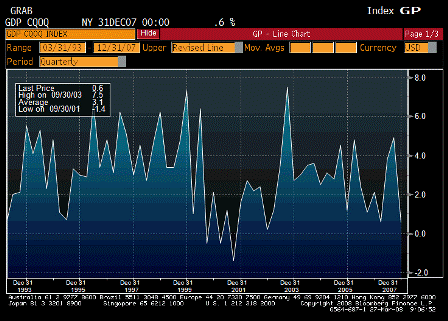
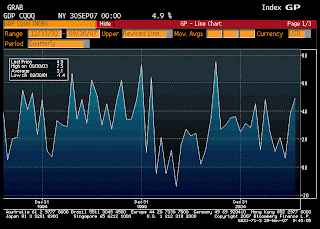
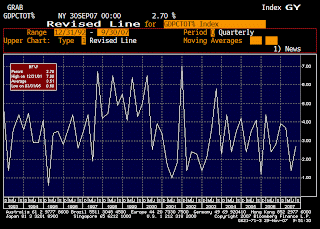
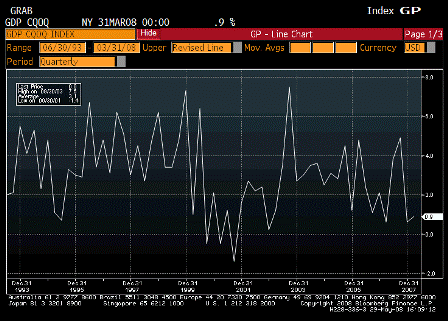
2008-05-29 GDP

GDP QoQ Annualized (1Q P)

Survey 0.9%
Actual 0.9%
Prior 1.5%
Revised 1.7%

Staying clear of recession levels.
Looking like Q4 was the bottom of this move.

[top][end]


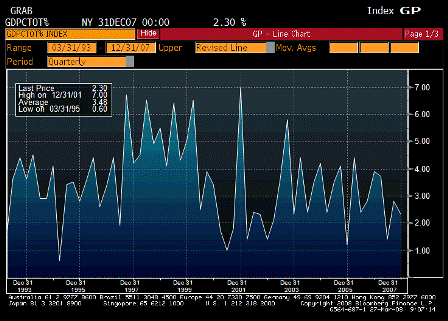
2008-05-29 Personal Consumption

Personal Consumption (1Q P)

Survey 1.0%
Actual 1.0%
Prior 1.0%
Revised n/a

As expected, not collapsing as feared, yet.

[top][end]


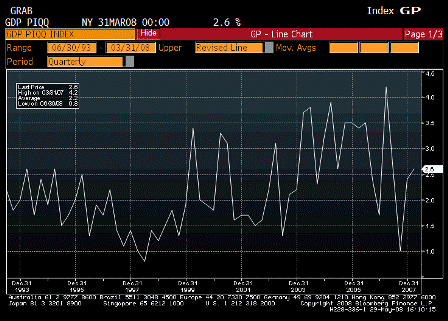
2008-05-29 GDP Price Index

GDP Price Index (1Q P)

Survey 2.6%
Actual 2.6%
Prior 2.6%
Revised n/a

Not good, and pipeline pressures continuing to build.

[top][end]


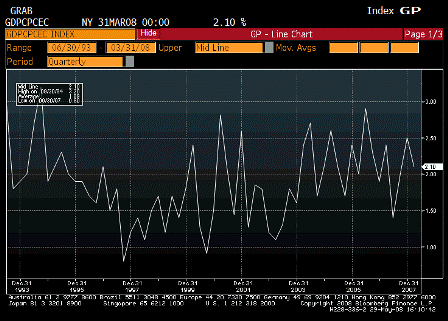
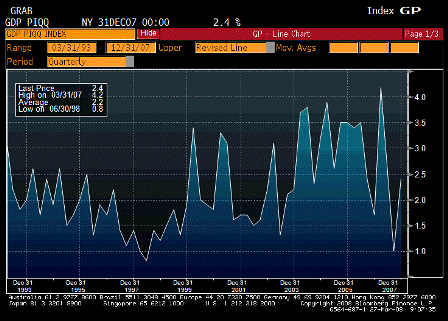
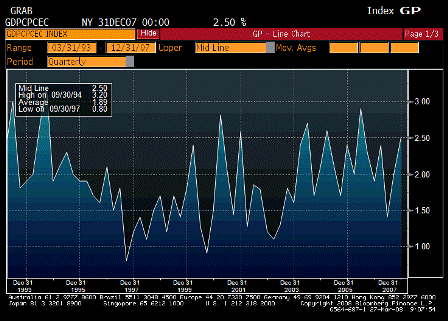
2008-05-29 Core PCE QoQ

Core PCE QoQ (1Q P)

Survey 2.2%
Actual 2.1%
Prior 2.2%
Revised n/a

A little better than expected.

But trend looking up.
[top][end]


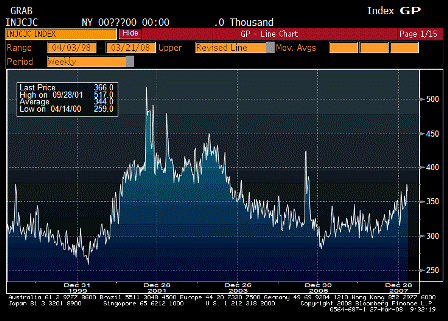
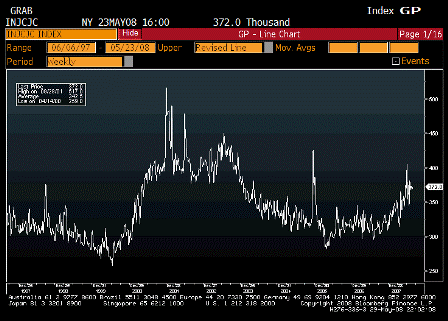
2008-05-29 Initial Jobless Claims

Initial Jobless Claims (May 24)

Survey 370K
Actual 372K
Prior 365K
Revised 368K

Seems to be leveling off.

Fiscal package should help.
[top][end]


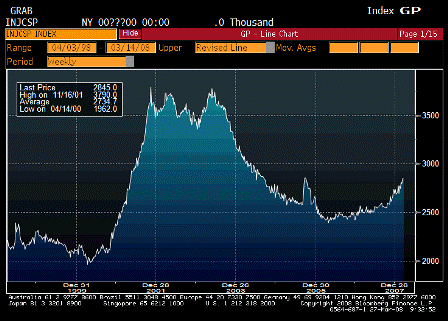
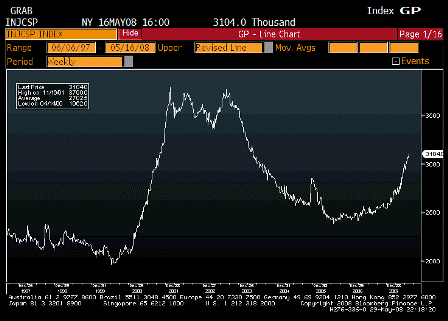
2008-05-29 Continuing Jobless Claims

Continuing Claims (May 17)

Survey 3060K
Actual 3104K
Prior 3073K
Revised 3068K

Lagging indicator, still trending higher, but still far below recession levels.

[top][end]


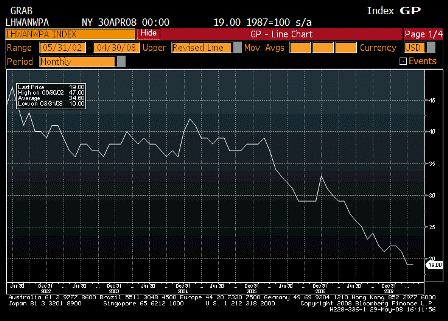
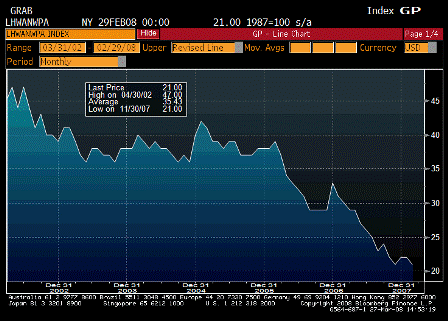
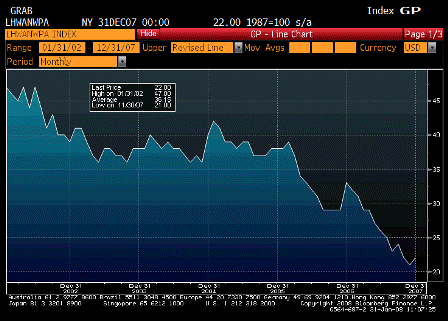
2008-05-29 Help Wanted Index

Help Wanted Index (Apr)

Survey 19
Actual 19
Prior 19
Revised n/a

Indicator of soft jobs markets.


[top]
2008-04-24 US Economic Releases

  • Durable Goods Orders (Released 8:30AM EST)
  • Initial Jobless Claims (Released 8:30AM EST)
  • Continuing Claims (Released 8:30AM EST)
  • Help Wanted Index (Released 10AM EST)
  • New Home Sales (Released 10AM EST)

From Karim:

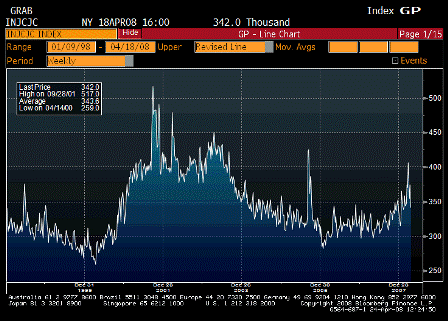
  • Initial claims down from 375k (revised from 372k) to 342k
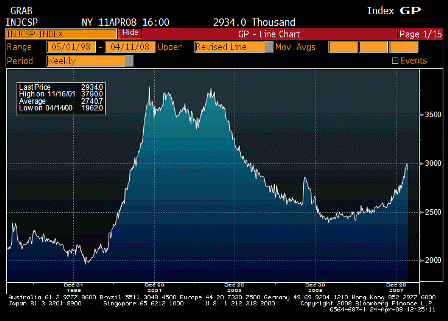
  • Continuing claims down from 2999k (revised from 2984k) to 2934k
  • DGO ex-aircraft and defense unchanged and down -2% and -1% in Jan/Feb
  • Claims have been volatile lately due to seasonals, but if they were to somehow stabilize at these levels, would still be in line with 0 employment growth
  • Q1 business capex component of GDP likely to be negative (has never been a recession where business capex did not also contract)

IFO down from 104.8 to 102.4 and retail component down from -0.9 to -10.0

ECB Member Bonello returns fire to Weber:

On the basis of the data we have at hand and the ECB’s rationale for monetary policy strategy it is very difficult to make an argument for higher interest rates.


2008-04-24 Durable Goods Orders

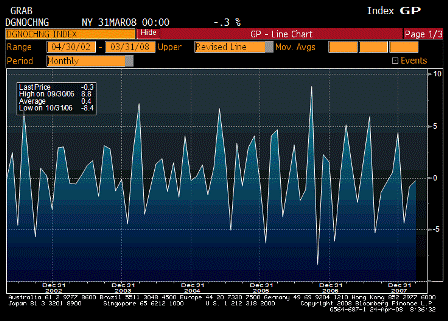
Durable Goods Orders (Mar)

Survey 0.1%
Actual -0.3%
Prior -1.7%
Revised -0.9%

2008-04-24 Durable Goods Orders YoY

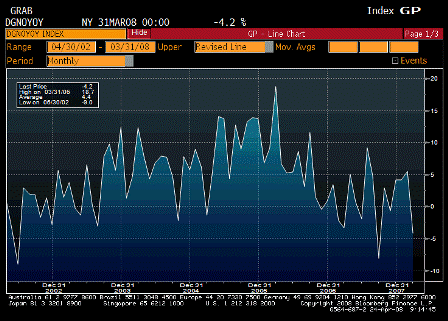
Durable Goods Orders YoY (Mar)

Survey n/a
Actual -4.2%
Prior 5.5%
Revised n/a

2008-04-24 Durables Ex Transportation

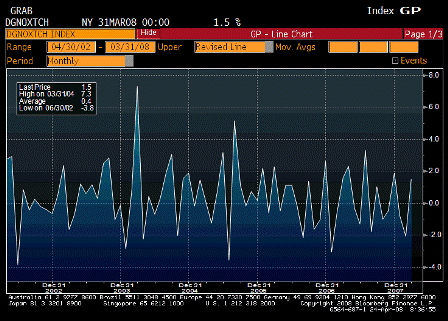
Durables Ex Transportation (Mar)

Survey 0.5%
Actual 1.5%
Prior -2.6%
Revised -2.1%

2008-04-24 Durable Goods TABLE

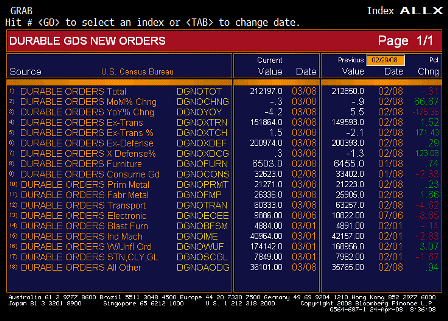
Durable Goods TABLE

Not all that bad. Two month total above expectations as Feb revised to a smaller drop.

Not at recession levels, yet.

And fiscal package kicking in soon.


2008-04-24 Initial Jobless Claims since 1998

Initial Jobless Claims (Apr 19)

Survey 375K
Actual 342K
Prior 372K
Revised 375K

As suspected, from the jobless recovery to the full-employment recession.

Labor numbers soft but not all that bad. No where near recession levels, particularly population adjusted.


2008-04-24 Continuing Claims since 1998

Continuing Claims (Apr 12)

Survey 2990K
Actual 2934K
Prior 2984K
Revised 2999K

A lagging indicator, now following initial claims lower.


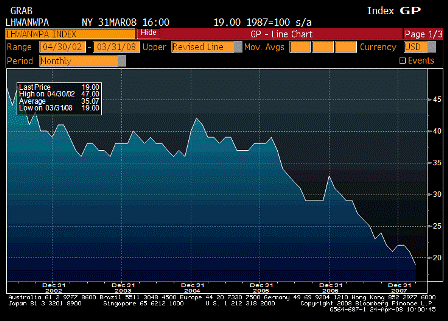
2008-04-24 Help Wanted Index

Help Wanted Index (Mar)

Survey 20
Actual 19
Prior 21
Revised n/a

Still going south, but a lagging indicator.


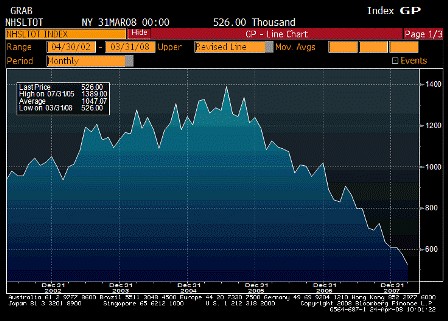
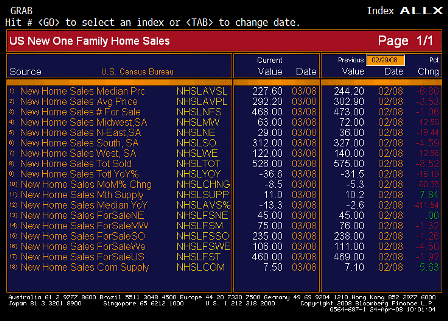
2008-04-24 New Home Sales

New Home Sales (Mar)

Survey 580K
Actual 526K
Prior 590K
Revised 575K

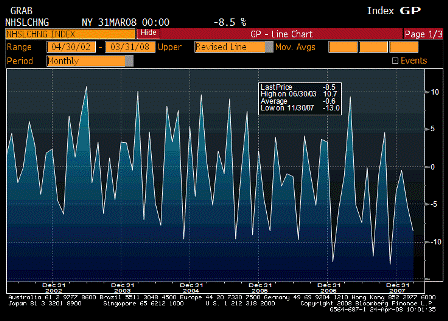
Sales still heading south.
Might be because production and inventories are down, and also subject to revisions next month.

2008-04-24 New Home Sales MoM

New Home Sales MoM (Mar)

Survey -1.7%
Actual -8.5%
Prior -1.8%
Revised -5.3%

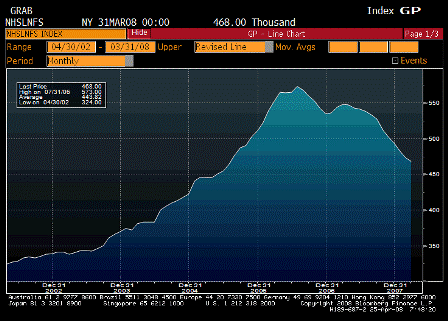
2008-04-24 Number of New Home For Sales

Number of New Homes for Sale (Mar)

Survey n/a
Actual 468K
Prior 473K
Revised n/a

Actual inventories are down substantially, and remaining inventory is probably not highly desirable.

Looking for regional shortages in the spring/summer buying season to drive up prices.

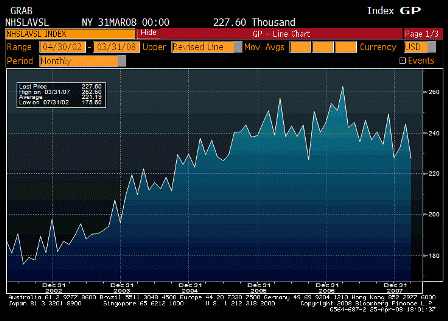
2008-04-24 New Home Sales Median Price

New Home Sales Median Price (Mar)

Survey n/a
Actual $227.6K
Prior $244.2K
Revised n/a

[comments]
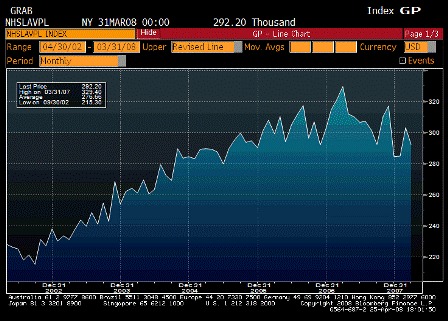
2008-04-24 New Home Sales Average Price

New Home Sales Average Price (Mar)

Survey n/a
Actual $292.2K
Prior $302.9K
Revised n/a

[comments]

2008-04-24 New Home Sales TABLE

New Home Sales TABLE

2008-03-27 US Economic Releases

2008-03-27 GDP Annualized

GDP Annualized (4Q F)

Survey 0.6%
Actual 0.6%
Prior 0.6%
Revised n/a

2008-03-27 Personal Consumption

Personal Consumption (4Q F)

Survey 1.9%
Actual 2.3%
Prior 1.9%
Revised n/a

Revised up to a very respectable number. And income remains positive, and employment is at high levels.


2008-03-27 GDP Price Index

GDP Price Index (4Q F)

Survey 2.7%
Actual 2.4%
Prior 2.7%
Revised n/a

A bit better than previously reported, but prices have subsequently gone much higher.


2008-03-27 Core PCE QoQ

Core PCE QoQ (4Q F)

Survey 2.7%
Actual 2.5%
Prior 2.7%
Revised n/a

The Fed is more concerned about this and the evidence food and energy is getting passed through from headline to core measures.


2008-03-27 Initial Jobless Claims since 1998

Initial Jobless Claims (Mar 22)

Survey 370K
Actual 366K
Prior 378K
Revised 375K

2008-03-27 Continuing Claims since 1998

Continuing Claims (Mar 15)

Survey 2885K
Actual 2845K
Prior 2865K
Revised 2850K

Best guess:

The jobless recovery that morphed into the full employment recession now appears to be over with today’s jobless claims numbers leaning in the same direction as other data released earlier this week.

That does not mean the issues with the financial sector are all behind us – far from it.

It does mean the real economy has figured out how to move on with what’s left of the financial sector.


2008-03-27 Help Wanted Index

Help Wanted Index (Feb)

Survey 20
Actual 21
Prior 21
Revised 22

[comments]

2008-01-31 US Economic Releases

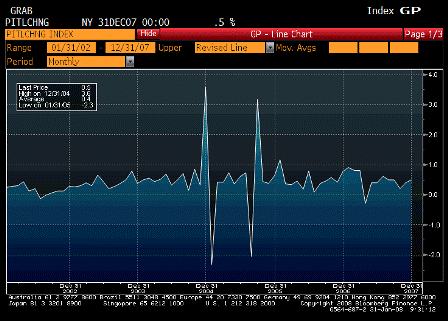
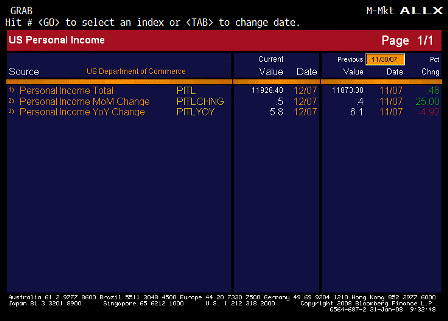
2008-01-31 Personal Income

Personal Income (Dec)

Survey 0.4%
Actual 0.5%
Prior 0.4%
Revised n/a

2008-01-31 Personal Income TABLE

Personal Income TABLE

A bit better than expected, holding up reasonably well, as declining interest rates reduce interest income component.


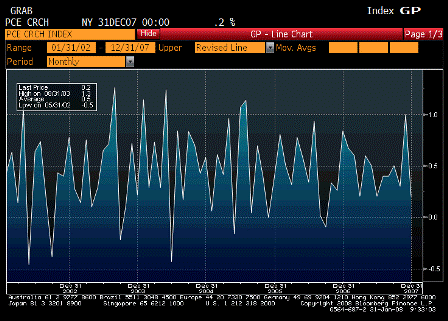
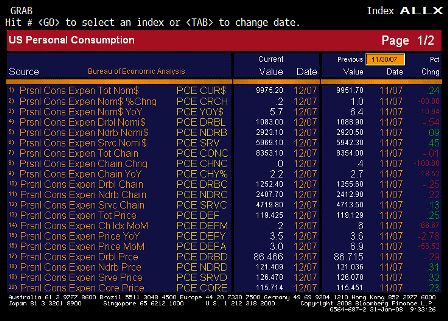
2008-01-31 Personal Spending

Personal Spending (Dec)

Survey 0.1%
Actual 0.2%
Prior 1.1%
Revised 1.0%

2008-01-31 Personal Spending TABLE(1)

2008-01-31 Personal Spending TABLE(2)

Personal Spending TABLE

OK number after last month’s large increase.

Also holding up reasonably well, but trending modestly downward.


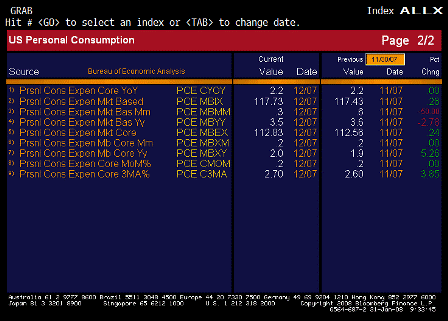
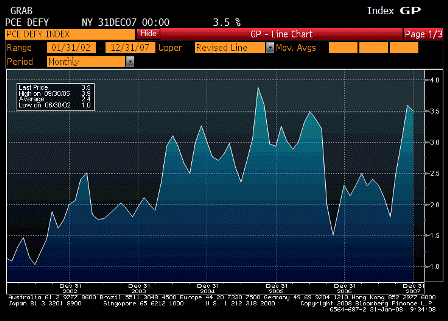
2008-01-31 PCE Deflator YoY

PCE Deflator YoY (Dec)

Survey 3.5%
Actual 3.5%
Prior 3.6%
Revised n/a

Too high for the Fed, but hopefully it will come down to core.


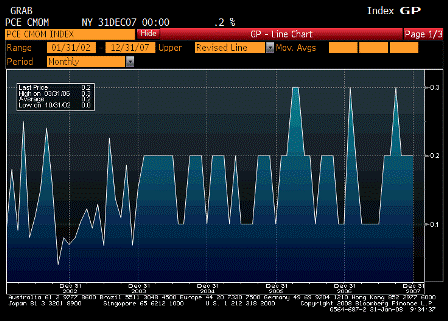
small-2008-01-31-pce-core-mom.gif

PCE Core MoM (Dec)

Survey 0.2%
Actual 0.2%
Prior 0.2%
Revised n/a

Actual was 0.23%


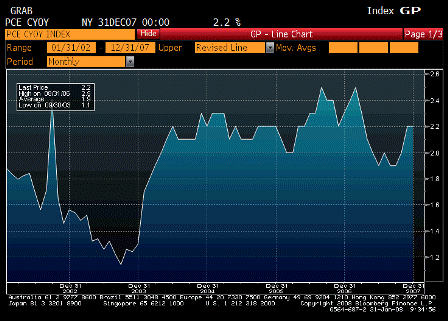
2008-01-31 PCE Core YoY

PCE Core YoY (Dec)

Survey 2.2%
Actual 2.2%
Prior 2.2%
Revised n/a

Fed OK with this number and should be OK next month as January 2007 was up 0.2%. After that, the 2007 numbers are 0.1%’s for a while; so, there’s a better chance of YoY increases after that.


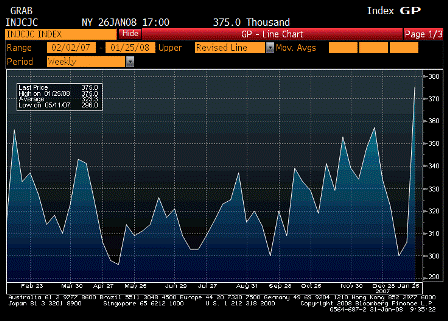
2008-01-31 Initial Jobless Claims

Initial Jobless Claims (Jan 26)

Survey 319K
Actual 375K
Prior 301K
Revised 306K

Big jump up as expected by Karim.

4 week average about 325,000 likely return to pre-January trend of about 350,000 (See Karim’s report).

Not yet the stuff of recession.


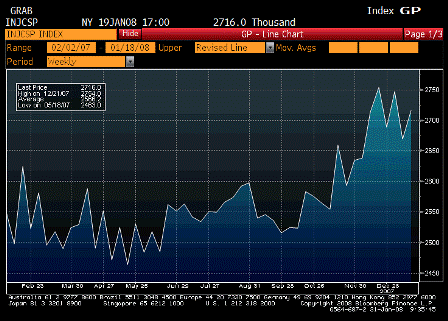
2008-01-31 Continuing Claims

Continuing Claims (Jan 19)

Survey 2685K
Actual 2716K
Prior 2672K
Revised 2669K

Moved back up some.

Also not yet the stuff of recession.


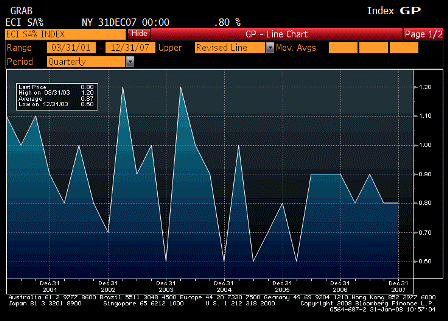
2008-01-31 Employment Cost Index

Employment Cost Index (4Q)

Survey 0.8%
Actual 0.8%
Prior 0.8%
Revised n/a

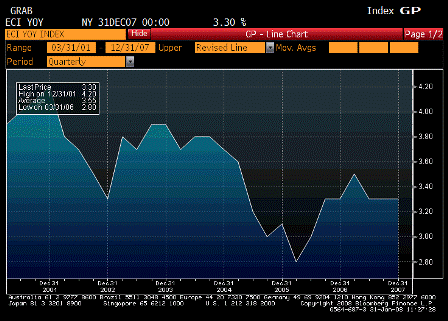
2008-01-31 Employment Cost Index YoY

Employment Cost Index YoY

Survey n/a
Actual 3.3%
Prior 3.3%
Revised n/a

As expected, Fed is OK with this, but may be giving it too much weight, as it may be the last inflation indicator to move in this cycle.


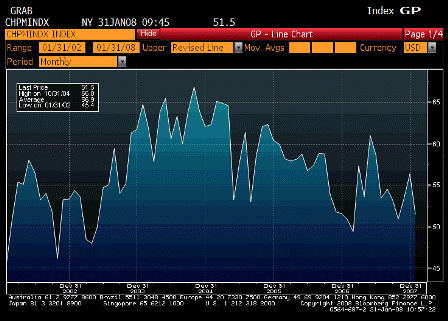
2008-01-31 Chicago Purchasing Manager

Chicago Purchasing Manager (Jan)

Survey 52.0
Actual 51.5
Prior 56.6
Revised 56.4

Still above 50, not the stuff of recession yet.


2008-01-31 Help Wanted Index

Help Wanted Index (Dec)

Survey 20
Actual 22
Prior 21
Revised n/a

Very small uptick from a very low level.


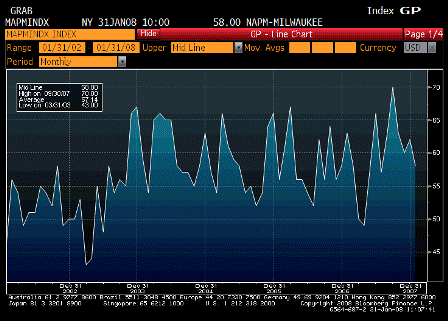
2008-01-31 NAPM-Milwaukee

NAPM-Milwaukee (Jan)

Survey n/a
Actual 58.0
Prior 62.0
Revised n/a

No recession here, yet.


♥

2007-12-28 US Economic Releases

2007-12-28 Chicago Purchasing Manager

Chicago Purchasing Manager (Dec)

Survey 51.7
Actual 56.6
Prior 52.9
Revised n/a

Graph Looks Ok.


2007-12-28 New Home Sales

New Home Sales (Nov)

Survey 717K
Actual 647K
Prior 728K
Revised 711K

2007-12-28 New Home Sales MoM

New Home Sales MoM (Nov)

Survey -1.6%
Actual -9.0%
Prior 1.7%
Revised 1.7%

Still heading south, but less impact on GDP.

Also, fewer homes are being built.

Existing home sales Monday will mean more.

And during the winter months, seasonally, fewer months are built and sold; so, small absolute changes get magnified.


2007-12-28 Help Wanted Index

Help Wanted Index (Nov)

Survey 23
Actual 21
Prior 23
Revised 22

Working its way lower in line with a still strong, but softening labor market.

Most recent plunge seems to be related to CNBC gloom and doom talk that started in August.


♥

2007-11-29 US Economic Releases

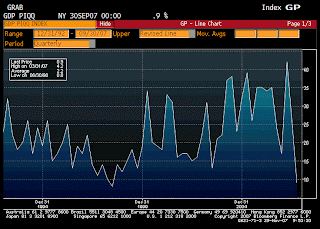
GCP Annualized (3QP)

Survey 4.8%
Actual 4.9%
Prior 3.9%
Revised n/a

Keeps coming in above expectations.


Personal Consumption (3QP)

Survey 2.9%
Actual 2.7%
Prior 3.0%
Revised n/a

A touch higher bust still seems very low.


GDP Price Index (3QP)

Survey 0.8%
Actual 0.9%
Prior 0.8%
Revised n/a

A touch higher bust still seems very low.


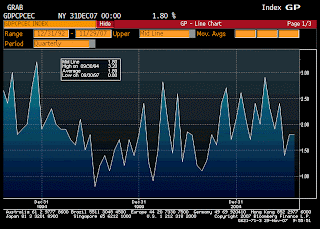
Core PCE QoQ (3QP)

Survey 1.8%
Actual 1.8%
Prior 1.8%
Revised n/a

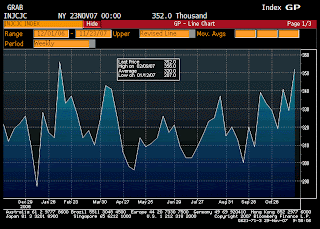
Initial Jobless Claims (Nov 24)

Survey 330K
Actual 352K
Prior 330K
Revised 329K

Thanksgiving week. Next week’s number is more informative.


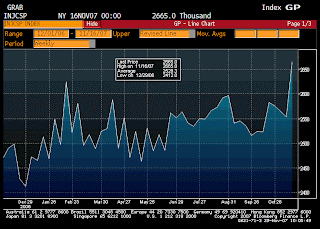
Continuing Claims (Nov 17)

Survey 2575K
Actual 2665K
Prior 2566K
Revised 2553K

Thanksgiving week. Next week’s number is more informative.


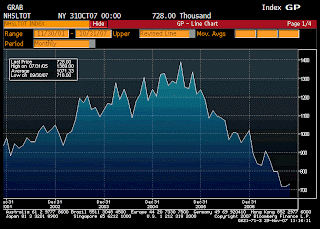
New Home Sales (Oct)

Survey 750K
Actual 728K
Prior 770K
Revised 716K

Up a touch from revised lower number, but still very low.


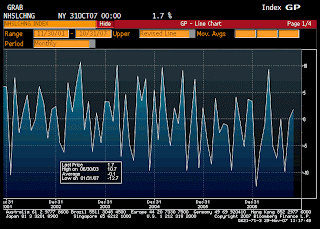
New Home Sales MoM (Oct)

Survey -2.6%
Actual 1.7%
Prior 4.8%
Revised -0.1%

Up a touch from revised lower number, but still very low.


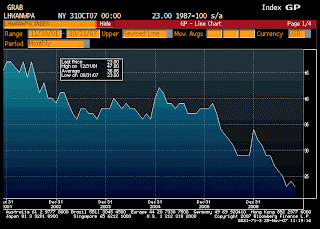
Help Wanted Index (Oct)

Survey 23
Actual 23
Prior 24
Revised n/a

Thanksgiving week. Next week’s number is more informative.


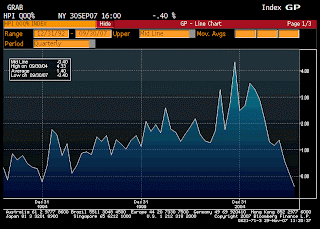
House Price Index QoQ (3Q)

Survey -0.5%
Actual -0.4%
Prior 0.1%
Revised n/a

Moving lower.
Do you think any of this is below fed expectations as of October 31st?


♥