Prospects for the U.S. Economy in 2008
(intro remarks snipped)
Today I’d like to talk about developments in the economy and in monetary policy, two items that have definitely been making the news lately. On January 22, the Federal Open Market Committee cut its main policy rateâ€â€Âthe federal funds rateâ€â€Âby three-quarters of a percentage point. Then, on January 30, at the scheduled meeting, the Committee voted to cut the policy rate again, this time by half a percentage point to 3 percent. Taking these actions together with those that began last September, the Committee has cut that rate by a total of 2¼ percentage points.
The purpose of these actions is to stimulate demand in the face of the combined impact of the severe contraction in housing and the related financial market disruptions.
The purpose has gone from restoring market functioning to stimulating demand.
While housing construction has been weak for more than two years, its effects did not spill over to most other sectors until fairly recently. That’s why we used to talk about a “dual economy,” with housing notably weak, but other sectors doing well. However, financial markets became disrupted in the middle of last year, which has not only intensified the housing slump, but also has tightened credit conditions for some households and businesses. The combined impact has led to slowing more broadly through the economy. It is this broader slowdown that has elicited Federal Reserve actions in recent months.
Now attention is turned to increasing demand to a fight a slowdown.
(SNIP)
Financial markets
I’d like to begin with a discussion of the disruptions in U.S. and global financial markets, because they influence not only the economy’s most likely course but also the risks that could alter that course. In my view, these disruptions are likely to continue for some time. In other words, I think they have laid bare some fundamental issues with the structure of the financial system that will require significant adjustments.
The financial disruptions are centered in the markets for asset-backed securities.
(SNIP DESCRIPTION OF ABS, RATINGS AGENCIES HISTORY, RISKS)
The bottom line is that, in recent years, the financial system has gone through a significant restructuring that made evaluating and pricing risk difficult. The reverberations of the resulting financial disruption are still with us. I’d like to describe some of them now.
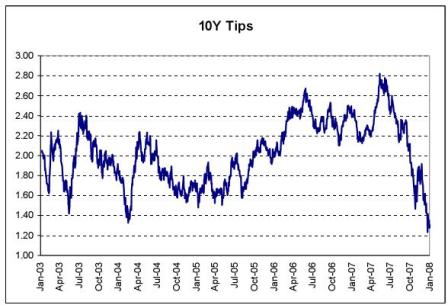
However, the potential stimulatory effects of this drop in risk-free Treasury rates have been offset in many cases by another key feature of the financial turmoil, namely, a sharp rise in interest rate risk spreads, as riskier borrowers have had to pay higher premiums to compensate lenders for a perceived increase in the probability of default or losses in that event. On the corporate side, prime borrowers have actually experienced some net decline in interest rates since the shock first hitâ€â€Âthat is, even though risk spreads are higher, they have been more than offset by lower Treasury rates. However, issuers of low-grade corporate bonds with greater credit risk, in contrast, face notably higher interest rates.
Risk has been repriced, and low grade borrowers are still paying more, even after Fed cuts.
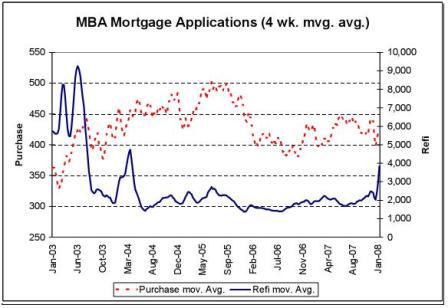
The mortgage market has been the epicenter of the shock, and, not surprisingly, greater aversion to risk has been particularly apparent there, with spreads above Treasuries increasing for mortgages of all types. Although borrowing rates for low-risk conforming mortgages are now lower than they were before the financial shock hit, fixed rates on jumbo mortgages are higher on net. Subprime mortgages remain difficult to get at any rate. Moreover, many markets for securitized assets, especially non-agency mortgage-backed securities, continue to experience severe illiquidity; in other words, the markets are not functioning efficiently, or may not be functioning much at all.
She does not think markets are functioning efficiently.
The turmoil is reverberating in depository institutions as well.1 One problem is an unanticipated buildup of mortgages as well as LBO-related loans on their balance sheets.
(SNIP LBO DESCRIPTION)
Furthermore, as investors have pulled back from the markets for asset-backed securities, the value of these securities and CDOs has fallen dramatically, so banks and other financial institutions have had to write down their values, which has shrunk their capital and driven their stock prices down.
Another problem for bank balance sheets is that credit losses have been edging up.
The latest reverberation involves monoline financial guarantors.
(SNIP DESCRIPTION)
Fortunately, the banking system entered this difficult period in a strong position. Most institutions were extremely well capitalized. However, the combination of unanticipated growth in assets and in write-downs has put increased pressure on banks’ capital positions. Given their concerns about capital adequacy and their increased caution in managing liquidity, it is not surprising that they are tightening credit terms and restricting availability. At first, the focus was mostly on mortgages, but now it has spread to other kinds of loans, including home equity lines of credit, credit cards, and other consumer credit, as well as business loans. The tightening of credit is also a response to a now noticeable deterioration in credit quality, particularly for subprime mortgages; the losses in other parts of the consumer loan portfolio remain at relatively low levels from an historical perspective, but they, too, have edged up.
Worries here about the supply side of credit.
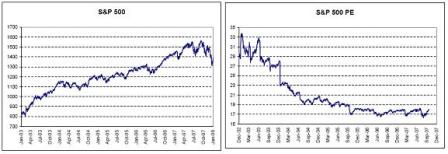
Finally, equity markets have hardly been immune to recent financial turbulence. Broad U.S. equity indices have been very volatile, and, on the whole, have declined since August, representing a restraint on spending. More recently, some of these declines have occurred as profits have come in below market expectations for some financial firms due to write-downs of the value of mortgage-backed securities.
My overall assessment is that the turbulence in financial markets is due to some fundamental problems that are not likely to be resolved quickly. The effects of these problems have now made credit conditions tighter throughout most of the economy’s private sector, and this will restrain spending going forward.
That is the actual risk – will spending be credit constrained going forward, and, if so, whether exports and/or government (deficit) spending will pick up the slack and support growth and employment.
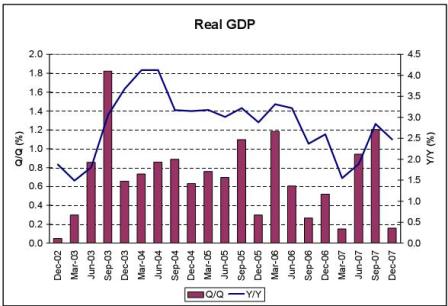
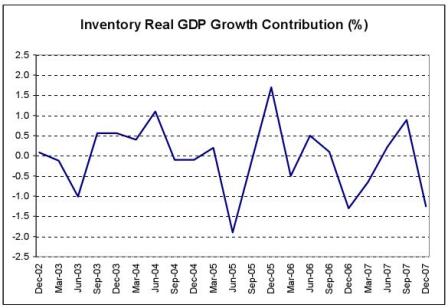
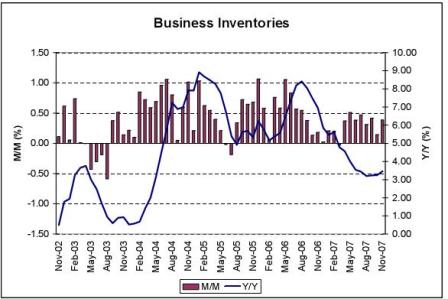
The impact hit economic activity mainly in the fourth quarter, and so far, it has been starkly negative. After robust performance in the second and third quarters of last year, growth slowed significantly in the fourth quarterâ€â€Âto a pace of only ½ percent.
Subject to revision. They said much the same about Q3 until it was revised up sharply. And Q4 reported inventory draw-downs of 1.4%; so, demand wasn’t that bad. And it is not unusual for GDP to puring a relatively low number after a very strong quarter like Q3 of 4.9%
This brings me to the outlook for the economy.
Economic outlook
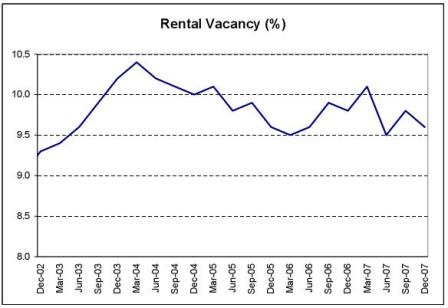
Current indicators point to continued anemic growth for at least the first half of this year as well as significant downside risks even to those weak expectations. As I mentioned at the outset, though the prolonged slump in housing construction did not spill over significantly to the rest of the economy during 2006 and much of 2007, when combined with the recent financial market turmoil, it has been central to the emergence of today’s slow-growth environment. And the course of its resolution will be a key factor in the economic outlook.
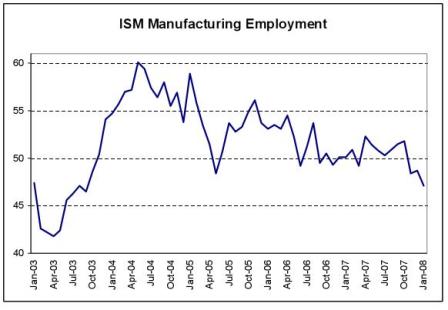
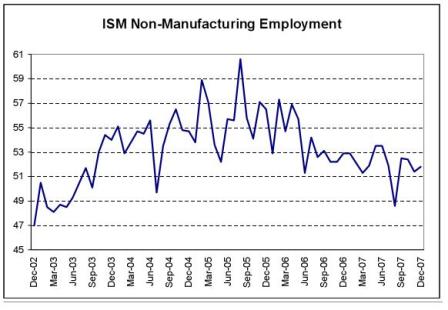
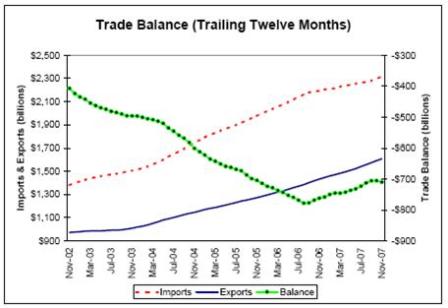
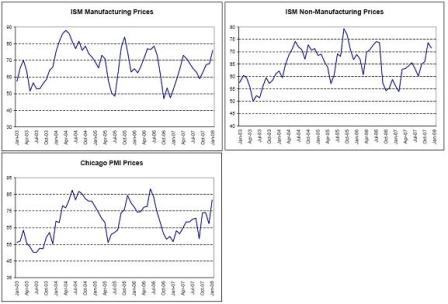
The main indicators are the payroll number and the ISM, which are both subject to revision/reversal in a few weeks, and the December trade numbers out later this week that may alter Q4 GDP forecasts.
Not to mention that the current environment has sufficient demand to generate inflation numbers above her comfort zone.
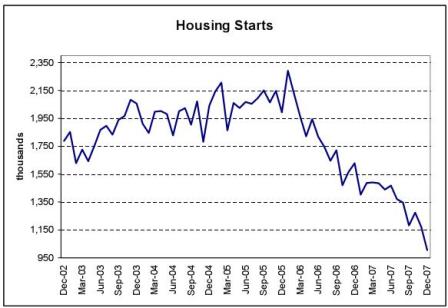
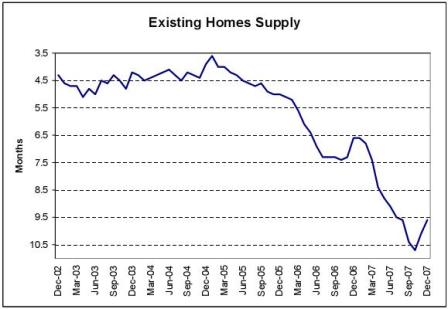
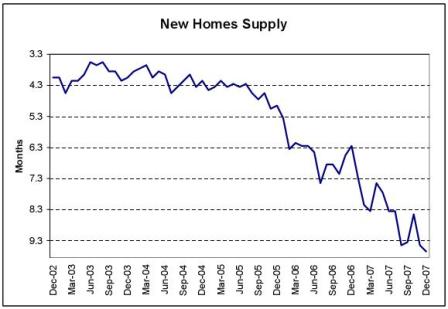
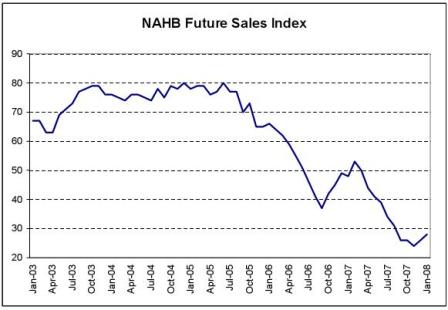
Forward-looking indicators of housing activity strongly suggest that the downward cycle may be with us a while longer.
Agreed, but may have bottomed and not be subtracting materially from GDP going forward.
Despite the subprime and jumbo mortgage challenges, home prices were largely stable in the Bay Area during the first three quarters of 2007. It remains to be seen, of course, how they will do as further market adjustments occur.
On the national level, housing construction probably will continue to contract through the end of this year.
That’s doubtful, but possible.
It is true that the residential construction sector is a fairly small piece of the overall economy and is unlikely to cause significant overall weakness in and of itself.
Right.
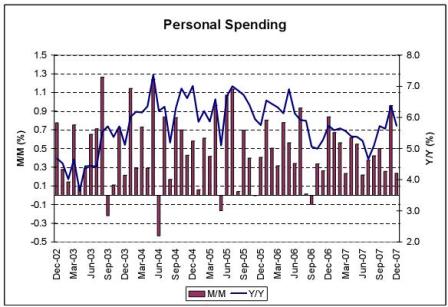
But the fallout from the housing cycle has many dimensions, and in the fourth quarter there were signs of spillovers to other sectors of the economy, most worrisomely, to consumer spending. This sector is a huge part of the economyâ€â€Âabout 70 percentâ€â€Âand its growth slowed to a rate that is somewhat below its long-run trend in the face of spillovers from the housing market and rising energy and food prices.
A minor slowdown for one quarter, maybe, so far. And the question remains whether exports and government deficit spending will pick up the slack.
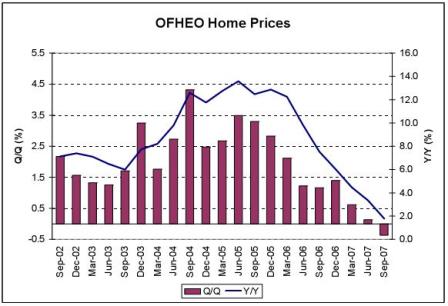
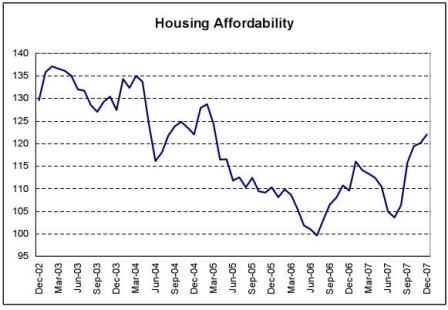
Looking ahead, developments related to housing are likely to continue to put a strain on consumers. For example, house prices have fallen noticeably and the declines have intensified. Moreover, futures markets for house prices indicate furtherâ€â€Âand even largerâ€â€Âdeclines in a number of metropolitan areas this year.
Future prices? Pretty think market to direct policy.
With house prices falling, homeowners’ total wealth is declining, and that could lead to a pullback in spending.
Maybe, but the Fed economists have no evidence of that.
At the same time, the fall in house prices may constrain consumer spending by lowering the value of mortgage equity; less equity reduces the quantity of funds available for credit-constrained consumers to borrow through home equity loans or to withdraw through refinancing.
Same, no evidence of that yet.
Indeed, it would not be surprising to see even more moderation over the next year or so, as consumers face additional constraints due to the declines in the stock market, the tightening of lending terms at depository institutions, and the lagged effects of previous increases in energy prices.
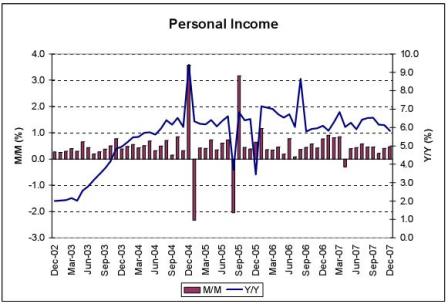
Spending is predominately a function of income, which has held up so far.
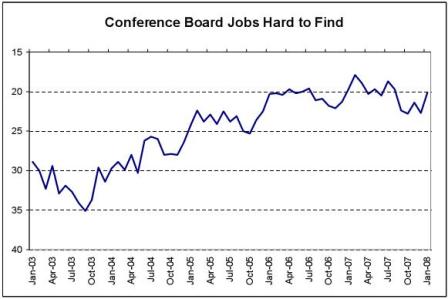
National surveys show that consumer confidence has plummeted. And I have been hearing comments and stories from my business contacts in the retail industry that are also downbeat. The rise in delinquency rates across the spectrum of consumer loans is strongly indicative of the growing strains on households.
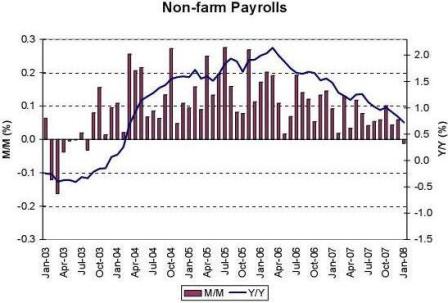
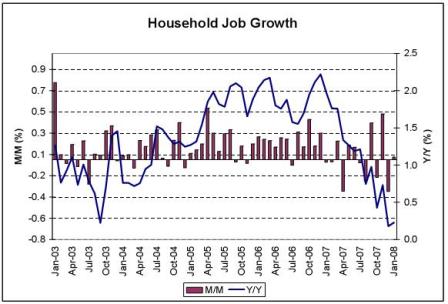
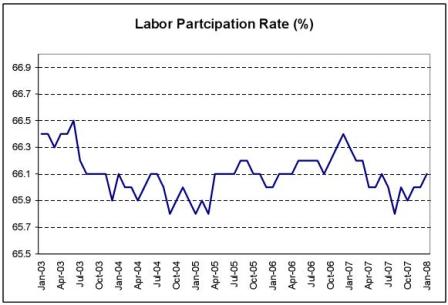
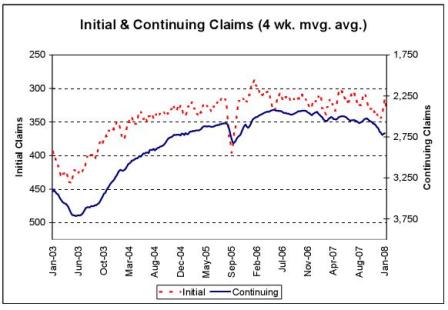
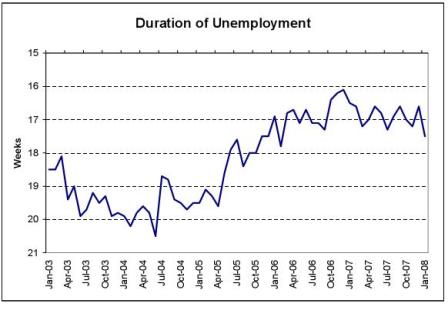
Finally, another negative factor for consumption is that labor markets have softened. In recent months, growth in employment from a survey of business establishments slowed sharply, actually falling in January, and many other indicators point in the same direction. Slower job growth will have a negative impact on the disposable income available to households and therefore will provide an additional restraint on consumer spending.
If January is revised up, does the Fed change its tune? They said the same about December employment when it was reported as being low, and then a month later when it was revised to a decent positive number there was no comment. Same when August reported negative then revised to a respectable number a month later.
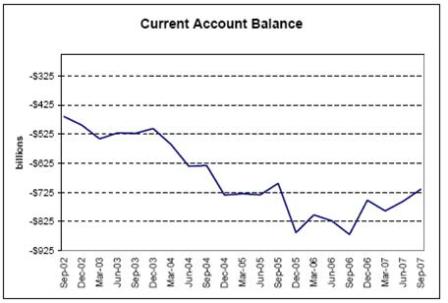
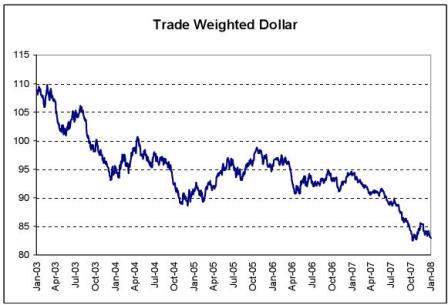
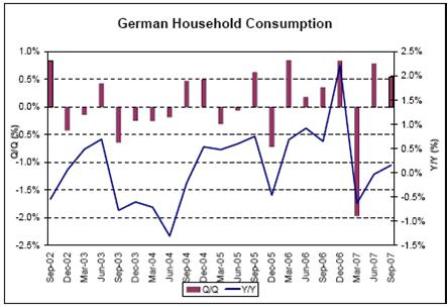
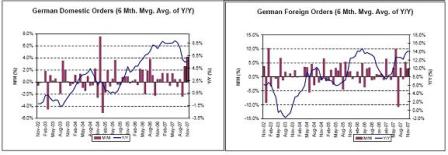
With the domestic consumer likely to be pretty hobbled, it is tempting to look at consumers beyond our own borders to be a source of strength for economic activity. Foreign real GDP has advanced robustly over the past three years. With the dollar falling well below its level of a year ago, U.S. exports have done very well; partly for this reason, U.S. net exportsâ€â€Âexports minus importsâ€â€Âwhich consistently held growth down from 2000 to 2005, actually gave it a lift over the past couple of years. I expect net exports to remain a source of strength. But some countriesâ€â€Âespecially in Europeâ€â€Âare experiencing direct negative impacts from the ongoing turmoil in financial markets. Others are likely to suffer indirect impacts from any slowdown in the U.S. A slowdown here could well produce ripple effects lowering growth there through trade linkages, and recently this factor has been reinforced by a worldwide drop in stock prices.
Yes, exports could fall. But they are being driven by an attempt to exit $US financial assets and that means spending them here rather than accumulating them there.
The US has taken strong measures to keep foreigners from accumulating $US financial assets – calling CB’s currency manipulators if they add to their $US reserves, the Fed’s actions making it clear it doesn’t care about inflation, and geopolitical policy driving unfriendly oil producers from accumulating their savings in $US.
This could easily increase US exports and asset sales by $500 billion per year from current levels.
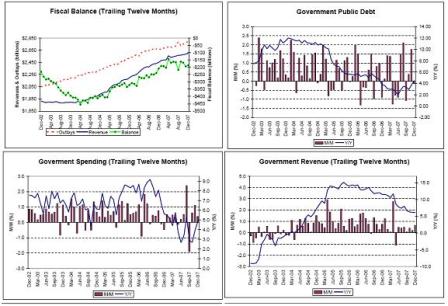
Economic policies are another important factor in gauging the economic outlook. As I have noted, the FOMC has eased the stance of monetary policy substantially in the past five months. Moreover, Congress has now passed a fiscal stimulus package to help the economy and it could provide notable stimulus in the latter half of this year.
Yes, good sized demand add there.
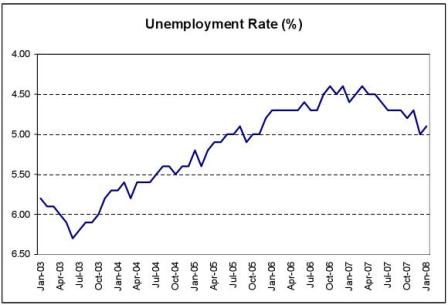
Even with such policy stimulus, the overall economy is still likely to turn in a very sluggish performance this year, expanding by a rate well below potential and creating more slack in labor markets. At 4.9 percent, the unemployment rate is already slightly above my estimate of its sustainable level.
Slightly? That confirms that even the most dovish Fed president thinks about 4.75% is the minimum non-inflationary unemployment rate.
Slow growth this year would most likely push unemployment even higher.
How high does it have to go to keep inflation from rising? To then bring it down to her comfort zone? She would have to say a lot, based on the apparent insensitivity of inflation to unemployment in recent years.
To sum it up, for the next few quarters, I see economic activity as weighed down by the housing slump and the negative factors now impacting consumer spending. It remains particularly vulnerable to the continuing turmoil in financial markets. My comments haven’t even touched on possible slowdowns in business investment in equipment and software and buildings. I see the growth risks as skewed to the downside for the near term.
Right, and agreed, demand has been weakening since Q2 2006 when the budget deficit became too small to support a strong enough credit expansion for full-employment. But exports picked up the slack when the subprime home buyers were the first to fall by the wayside.
In circumstances like these, we can’t rule out the possibility of getting into an adverse feedback loopâ€â€Âthat is, the slowing economy weakens financial markets, which induces greater caution by lenders, households, and firms, and which feeds back to even more weakness in economic activity and more caution. Indeed, an important objective of Fed policy is to mitigate the possibility that such a negative feedback loop could develop and take hold.
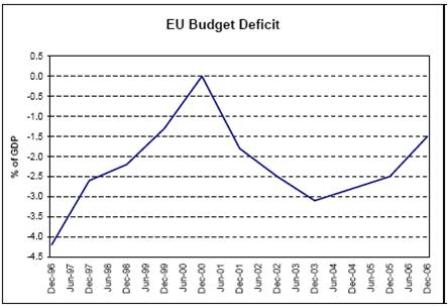
The countercyclical tax structure limits this. Just like th early 1990s when the slowdown drove the budget deficit to 5% of GDP (equal to about a $750 billion deficit today) and added that much net financial equity to trigger and support the boom of the second half of the 1990s.
With a gold standard, this does not happen. The government run that kind of deficit without losing reserves and defaulting. Like the US did in 1934 when it went off the gold standard.
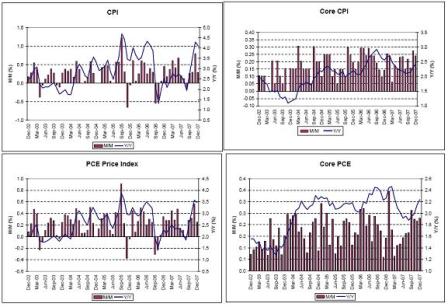
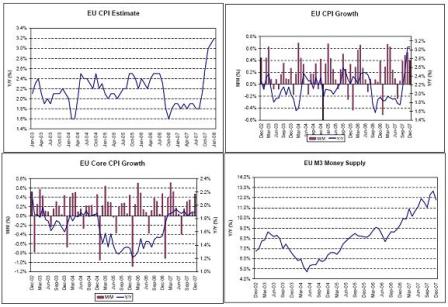
Now let me turn to inflation. The recent news has been disappointing. Over the past three months, the personal consumption expenditures price index excluding food and energy, or the core PCE price indexâ€â€Âone of the key measures included in the FOMC’s quarterly forecastsâ€â€Âhas increased by 2.7 percent, bringing the increase over the past twelve months to 2.2 percent. This rate is somewhat above what I consider to be price stability.
Yes, even as demand is slowing.
I expect core inflation to moderate over the next few years, edging down to around 1¾ percent under appropriate monetary policy.
What does that mean? She said the Fed has been cutting rates to add to demand. How does adding to demand bring down inflation?
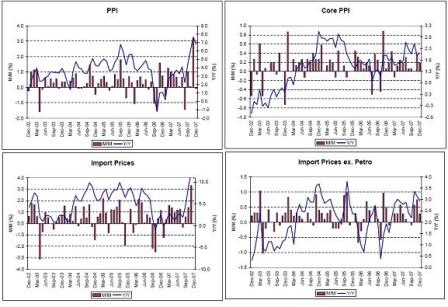
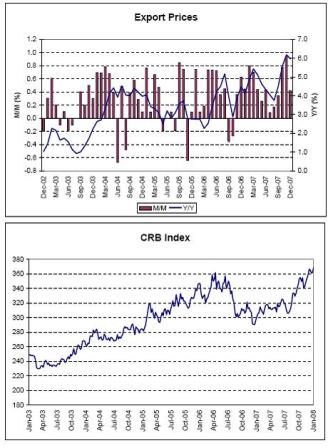
Such an outcome is broadly consistent with my interpretation of the Fed’s price stability mandate. Moreover, I believe the risks on the upside and downside are roughly balanced. First, it appears that core inflation has been pushed up somewhat by the pass-through of higher energy and food prices and by the drop in the dollar. However, recently, energy prices have turned down in response to concerns that a slowdown in the U.S. will weaken economic growth around the world, and thereby lower the demand for energy.
Hardly! Oil is still trending higher, as it bounced off of $86 got through $94 yesterday. And January 2008 gasoline consumption was 1.4% over January 2007 – during the ‘slowdown’ emphasized above. Not to mention grain prices and the CRB in general. And anecdotal earnings reports showing trending cost push inflation taking hold both internationally and domestically.
Another factor that could restrain inflationary pressures is the slowdown in the U.S. economy.
Hasn’t yet. In fact, seems to be getting worse if anything.
This can be expected to create more slack in labor and goods markets, a development that typically has been associated with reduced inflation in the past.
Not in the 1970s. Not with ‘imported’ cost push inflation, and now with biofuels liking food to fuel and with a couple of billion up-and-coming consumers in India and China competing for resources.
And not to mention our own pension funds increasing their allocations to passive commodity strategies – pure, inflationary hoarding.
A key factor for inflation going forward is inflation expectations. These appear to have become well-anchored over the past decade or so as the Fed’s inflation resolve has gained credibility. Very recently, far-dated inflation compensationâ€â€Âa measure derived from various Treasury yieldsâ€â€Âhas risen, but it’s not clear whether this rise is due to higher inflation expectations or to changes in the liquidity of those Treasury instruments or inflation risk. Going forward, we will need to monitor inflation expectations carefully to ensure that they do indeed remain well anchored.
Right, as if monitoring will keep them anchored.
Actions now speak louder than words. The Fed’s actions are telling us loud and clear that at least so far they have been willing to step hard on what the believe is the inflation pedal to soften a slowdown, with unemployment still very near what they consider full-employment.
The question is: how sever does inflation have to get for the Fed to address it with action rather than ‘monitoring’?
Monetary policy
Now let me turn to monetary policy. The federal funds rate has been cut by 2¼ percentage points since September and now stands at 3 percent. With near-term expected inflation of just above 2 percent, the realâ€â€Âinflation adjustedâ€â€Âfunds rate is around 1 percent or slightly lower, which represents an accommodative posture.
OK, they do consider the current FF rate accommodative.
And as core creeps up, the Fed sees it as more accommodative.
I believe that accommodation is appropriate because the financial shock and the housing cycle have significantly restrained economic growth.
But not inflation, at least not yet.
While growth seems likely to be sluggish this year, the Fed’s policy actions should help to promote a pickup in growth over time. I consider it most probable that the U.S. economy will experience slow growth, and not outright recession, in coming quarters. At the same time, core consumer inflation seems likely to decline gradually to somewhat below 2 percent over the next couple of years, a level that is consistent with price stability.
Why is it likely to decline? Don’t see any support for what that position apart from it used to decline when unemployment went up. But even then, it took a lot more unemployment to decline the way they are expecting it to.
However, economic prospects are unusually uncertain. And downside risks to economic growth remain.
And that means a downside risk to inflation as they must be assuming inflation is a function of growth? If so, why not say it?
This implies that, going forward, the Committee must carefully monitor and assess the effects of ongoing financial and economic developments on the outlook and be prepared to act in a timely manner to address developments that alter the forecast or the risks to it.
My guess is the Fed’s forecast has not been revised down since the last meeting, but the inflation forecast may be revised up and appropriate monetary policy might be implying higher rates down the road.
I expect she would vote for a rate cut at the next meeting if conditions remain the same, if she was still a voting member.
Now, I’d be glad to take your questions.
Endnotes
In recent months, and particularly toward year-end, strains were evident in the term interbank funding markets; in these markets, banks borrow from and lend to each other, with loans maturing in a number of weeks, months, or even a year. The problem has been that banks that would normally lend their excess funds to other banks that need them became reluctant to do so. This may reflect banks’ recognition of the need to preserve liquidity to meet unexpected credit demands, greater uncertainty about the creditworthiness of counterparties and concerns relating to capital positions, on top of typical, year-end balance sheet considerations. A heightened focus on liquidity is logical when the markets for securitized assets held by banks have become highly illiquid and when the potential exists for some customersâ€â€Âsuch as struggling mortgage companies and othersâ€â€Âto draw on unsecured credit lines. These markets have improved since the end of last year, perhaps in part because of the Fed’s introduction of the Term Auction Facility, which gives banks another route besides the discount window to tap into the Fed’s lending function. (Banks had not used the discount window very much despite their need for liquidity because they were concerned that doing so might erroneously signal to other financial institutions that they were in bad straits. The plan for the TFA, which the Fed created in cooperation with the European Central Bank and the National Bank of Switzerland, was announced on December 12.)
♥