US Energy Consumption as % of GDP

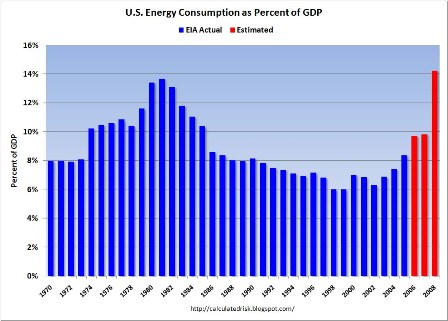
US Energy Consumption as Percent of GDP

Interesting how the price hikes get us back to the 1970s ratio. One of the arguments that it was different this time around was that crude is a lower percentage of GDP than it was then.

The pass-throughs to the rest of the price structure are just getting started, and I expect them to persist well past the peak in crude prices.

The Independent: UK Bank deputy chief warning

Bank deputy chief warns of market trouble to come

by Ben Russell, Political Correspondent and Sean O’Grady

Britain is facing the risk of renewed turmoil in the financial markets, the new deputy governor of the Bank of England warned yesterday.

Professor Charlie Bean, the deputy governor for monetary policy and a former chief economist at the Bank, raised the prospect of a slowing global economy triggering a new round of problems with corporate loans and said that the impact of the credit squeeze could be greater than Bank projections.

Yes, but unlike the Eurozone, the BoE is permitted to ‘write the check’ as in the treasury.

National solvency is not an issue in the UK as it is in the Eurozone when weakness is addressed.

He told members of the Commons Treasury Select Committee that Britain faced “major conflicting risks” threatening the Government’s inflation target from the problems of a slowing economy and rising commodity prices.

Yes, the twin themes of weakness and inflation.

In a memorandum to the committee, Professor Bean warned that the “dislocation” in the financial markets “probably has further to run, especially if a slowing economy here and abroad generates a second round of write-downs, this time associated with corporate loans. Moreover, the impact of the tightening in the terms of availability of credit could prove greater than is embodied in the central case in our most recent set of projections”.

Agreed. And while ‘writing the check’ can readily address these issues with no risk to government solvency, it will also support the higher prices he next discusses:

He said that increasing oil and other commodity price rises would lead to higher inflation becoming “embedded in the economy”, warning that people might seek to offset price increases by making higher wage demands. He said: “There is no doubt that the UK economy presently faces the most challenging set of circumstances since at least the early 1990s and probably earlier.”

Professor Bean said oil prices could continue to rise for another two years and cautioned that Britain faced the danger of a pay-price spiral if workers tried to compensate by pushing up wages. He said: “It certainly poses a significant challenge. There is no doubt about that at all. It may be a relatively unlikely event but it could be particularly unfortunate if it happened, if households and businesses start losing faith in the idea that inflation will stay low, round about the target, they start building it into their pay and prices and inflation becomes much more embedded into the system… Provided pay growth remains subdued, the current pick-up in inflation will be temporary.”

Living standards, the deputy governor stressed, will inevitably be lower because of the global inflation in commodity prices.

Agreed. It’s all about real terms of trade, which have also been declining rapidly in the US as evidenced by the drop in growth of GDP and the drop in non-oil trade deficit.

My guess is the most likely political response in the US and the UK is proactive deficit spending from the treasury to address the weakness and higher interest rates to address the inflation.

Unfortunately the deficit spending that supports domestic demand will also support crude consumption (as well as housing) and ‘monetize’ the ever higher crude prices being set by the Saudis, thereby supporting ‘inflation’ in general.

And this will trigger ever higher interest rates from the Central Bank as inflation trends even higher.

2008-06-26 Daily US Economic Releases


[Skip to the end]


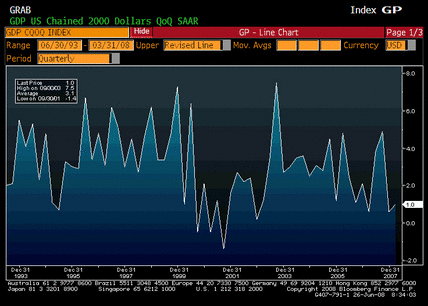
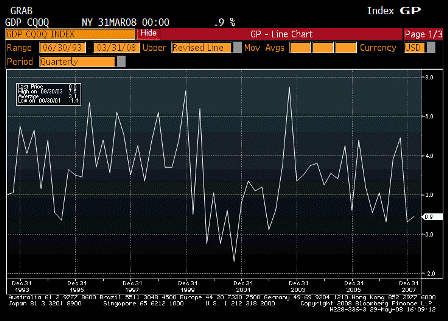
GDP QoQ Annualized (1Q F)

Survey 1.0%
Actual 1.0%
Prior 0.9%
Revised n/a

As expected.  Weak but no recession.

[top][end]


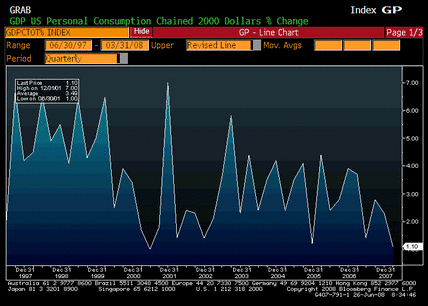
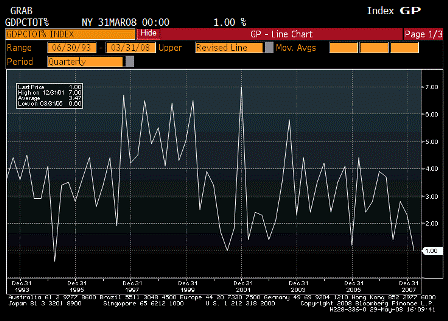
Personal Consumption (1Q F)

Survey 1.0%
Actual 1.1%
Prior 1.0%
Revised n/a

A touch better than expected with further improvement in Q2 still expected.

[top][end]


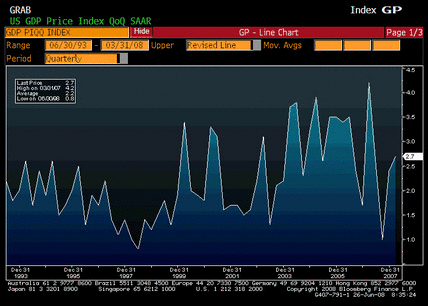
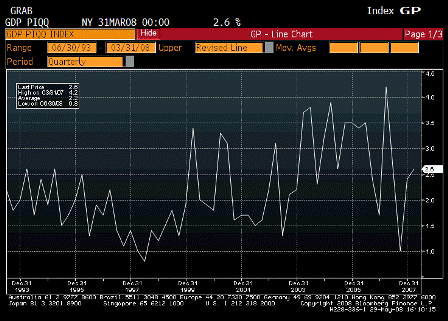
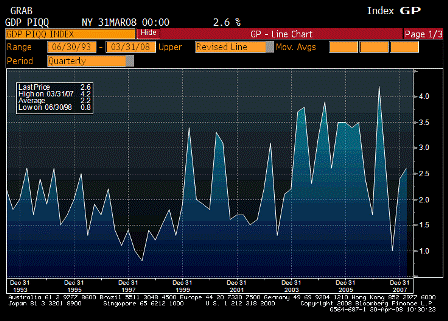
GDP Price Index (1Q F)

Survey 2.6%
Actual 2.7%
Prior 2.6%
Revised n/a

A bit worse than expected.

[top][end]


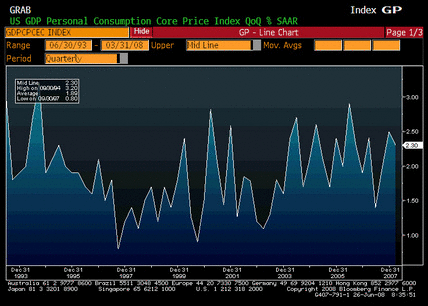
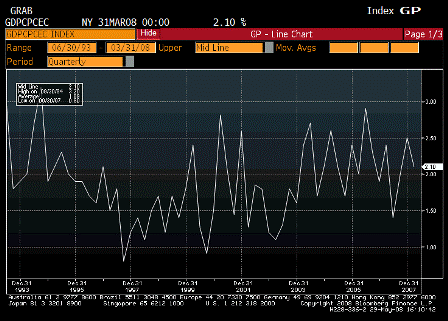
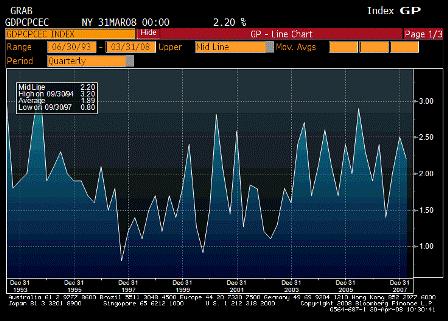
Core PCE QoQ (1Q F)

Survey 2.1%
Actual 2.3%
Prior 2.1%
Revised n/a

More than a bit worse than expected.
 
GDP better than expected, and inflation worse than expected was reflected in the Fed statement, but not in Fed action.

[top][end]


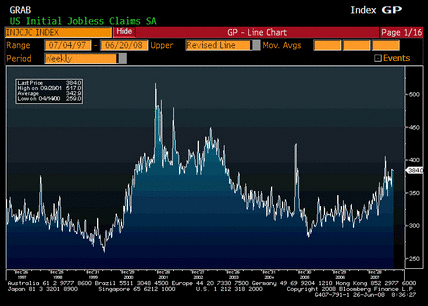
Initial Jobless Claims (Jun 21)

Survey 375K
Actual 384K
Prior 381K
Revised 384K

Unchanged from the previous week’s report that was revised up some.  Still in the new range.

[top][end]


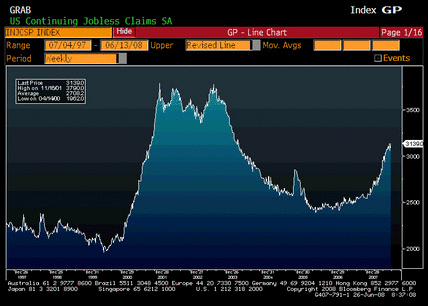
Continiuing Jobless Claims (Jun 14)

Survey 3105K
Actual 3139K
Prior 3060K
Revised 3057K

A little worse than expected, prior week revised down marginally.

Weak, but no recession yet.

[top][end]


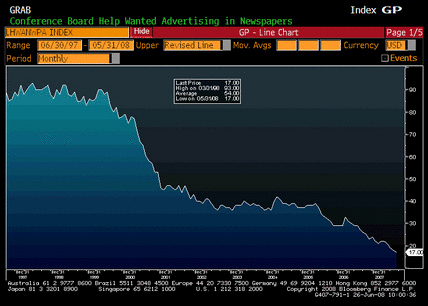
Help Wanted Index (May)

Survey 19
Actual 17
Prior 19
Revised 18

All evidence shows labor markets still soft.

[top][end]


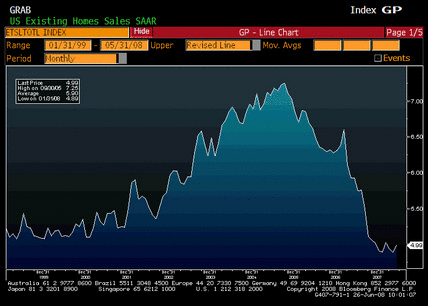
Existing Home Sales (May)

Survey 4.95M
Actual 4.99M
Prior 4.89M
Revised n/a

Continuing signs of a bottom.
 
Levels are too low given demographics and should recover substantially even with a weak market.

[top][end]


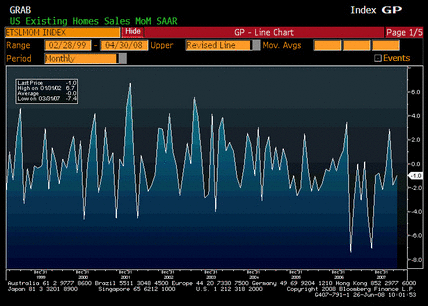
Existing Home Sales MoM (May)

Survey 1.2%
Actual 2.0%
Prior -1.0%
Revised n/a

Better than expected.

[top][end]


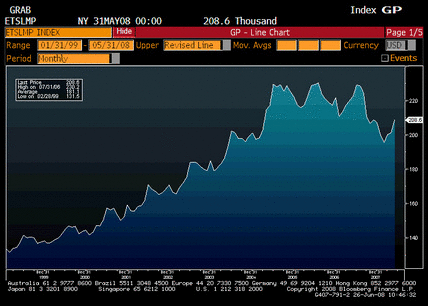
Existing Home Sales Median Price (May)

Survey n/a
Actual 208.6
Prior 201.2
Revised n/a

The upturn in prices wasn’t even reported by the mainstream press while the downturns were sensationalized.

[top][end]


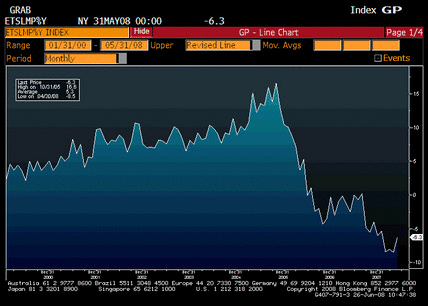
Existing Home Sales Median Price YoY (May)

Survey n/a
Actual -6.3%
Prior -8.5%
Revised n/a

Year over year price declines are far less than the case-shiller index which reports only on the largest metro areas.  OFHEO prices declined even less year over year.  Again, the mainstream media doesn’t report this and continues to repeat case-shiller numbers.

[top][end]


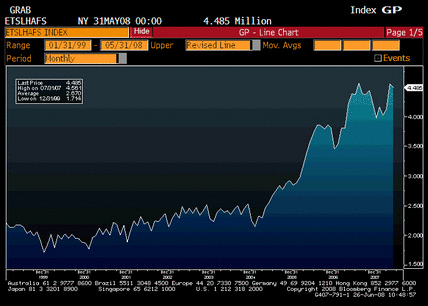
Existing Home Sales Inventories (May)

Survey n/a
Actual 4.485
Prior 4.549
Revised n/a

I thought the last spike up was suspect- might have had something to do with foreclosures hitting the list- and may now be turning down as well, following the actual numbers of new homes for sale which has been falling rapidly.

[top]

2008-06-23 EU Daily News Highlights


[Skip to the end]

Weakness, inflation, and rising debt to GDP levels caused by both weakness and higher interest rates.

Get your sovereign eurozone credit default insurance before it’s too late!

Highlights

Europe’s Manufacturing, Services Industries Shrink


German business confidence falls in June, Ifo survey says


Ifo’s Nerb Says Business Climate Burdened by High Energy Prices


ECB Has to Be `Tough’ on Rates Beyond July, Liebscher Tells MNI


ECB should look seriously at rate level: Stark


EU Summits Reveal Economic-Strategy Rifts


Threat of rate rise rattles EU businesses


France’s 2008 Budget Deficit May Near 3% of GDP, Tribune Says


European Government Bonds Advance as German Confidence Fades


[top]

Re: Roach-Stagflation


[Skip to the end]

(an email exchange)

A few of things:

First, the rising wages in the 70’s led to bracket creep that put the budget in surplus in 1979 and resulted in a severe recession soon after.

This time around it is unlikely the inflation takes much of a dent out of the deficit so it’s more likely demand will be sustained to support prices. And, at least so far, Congress has acted to sustain demand and support prices with the latest fiscal package and more seemingly on the way.

Second, last time around the oil producers for the most part didn’t spend all that much of their new found revenues and thereby drained demand from the US economy. This time around they seem to be spending on infrastructure at a rate sufficient to drive our exports and keep gdp muddling through.

Third, I recall it was maybe the deregulation of nat gas that freed up a cheap substitute for electric utilities and unleashed a massive supply response as nat gas was substituted for crude at the elect power producers. After 1980 opec cut production by something like 15 million bpd to hold prices above 30 until they could cut no more without capping all their wells and the price tumbled to about 10 where it stood for a long time. This time around that kind of excess supply is nowhere in sight.

>
>   On Thu, Jun 12, 2008 at 11:59 PM, Russell wrote:
>
>   Stephan Roach is chairman of Morgan Stanley Asia, and pens
>   this missive for the FT, in which he contextualizes why the
>   Fed’s options are limited:
>
>   ”Fears of 1970s-style stagflation are back in the air. Global
>   bond markets are growing ever more nervous over this possibility,
>   and US and European central bankers are talking increasingly
>   tough about the perils of mounting inflation.
>
>   Yet today’s stagflation risks are very different from those that
>   wreaked such havoc 35 years ago. Unlike in that earlier period,
>   wages in the developed economies have been delinked from prices.
>   That all but eliminates the automatic indexation features of the
>   once dreaded wage-price spiral – perhaps the most insidious
>   feature of the “great inflation” of the 1970s. Moreover, as the
>   stunning surge of the US unemployment rate in May suggests,
>   slowing economic growth in the industrial economies is likely to
>   open up further slack in labour markets, thereby putting downward
>   cyclical pressure on wages over the next couple of years.
>
>   But there is a new threat to global inflation that was not present
>   in the 1970s. It is arising from the developing world, especially in
>   Asia, where price pressures are lurching out of control. For
>   developing Asia as a whole, consumer price index inflation hit 7.5
>   per cent in April 2008, close to a 9½-year high and more than double
>   the 3.6 per cent pace of a year ago. Sure, a good portion of the recent
>   acceleration in pricing is a result of food and energy – critically
>   important components of household budgets in poorer countries and
>   yet items that many analysts mistakenly remove to get a cleaner read
>   on underlying inflation. But even the residual, or “core”, inflation rate
>   in developing Asia surged to 3.8 per cent in April, more than double
>   the 1.8 per cent pace of a year ago…”
>
>

[top]

2008-05-29 US Economic Releases


[Skip to the end]


2008-05-29 GDP

GDP QoQ Annualized (1Q P)

Survey 0.9%
Actual 0.9%
Prior 1.5%
Revised 1.7%

Staying clear of recession levels.
Looking like Q4 was the bottom of this move.

[top][end]


2008-05-29 Personal Consumption

Personal Consumption (1Q P)

Survey 1.0%
Actual 1.0%
Prior 1.0%
Revised n/a

As expected, not collapsing as feared, yet.

[top][end]


2008-05-29 GDP Price Index

GDP Price Index (1Q P)

Survey 2.6%
Actual 2.6%
Prior 2.6%
Revised n/a

Not good, and pipeline pressures continuing to build.

[top][end]


2008-05-29 Core PCE QoQ

Core PCE QoQ (1Q P)

Survey 2.2%
Actual 2.1%
Prior 2.2%
Revised n/a

A little better than expected.

But trend looking up.

[top][end]


2008-05-29 Initial Jobless Claims

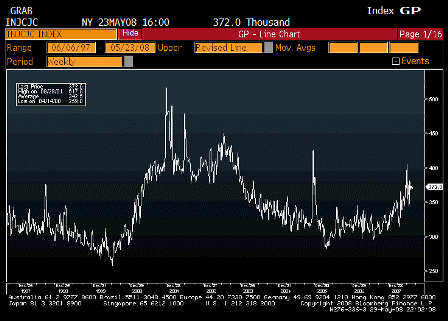
Initial Jobless Claims (May 24)

Survey 370K
Actual 372K
Prior 365K
Revised 368K

Seems to be leveling off.

Fiscal package should help.

[top][end]


2008-05-29 Continuing Jobless Claims

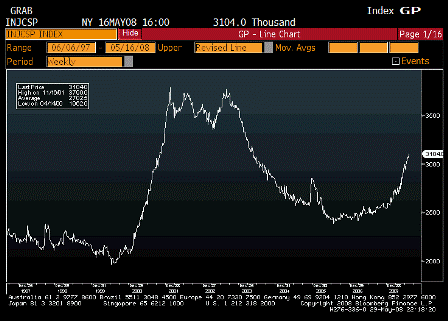
Continuing Claims (May 17)

Survey 3060K
Actual 3104K
Prior 3073K
Revised 3068K

Lagging indicator, still trending higher, but still far below recession levels.

[top][end]


2008-05-29 Help Wanted Index

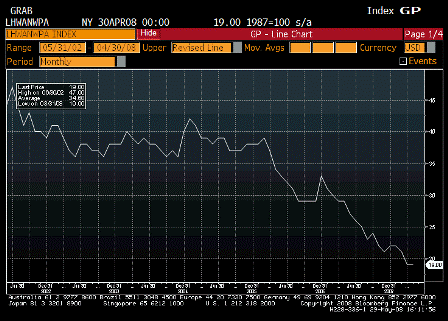
Help Wanted Index (Apr)

Survey 19
Actual 19
Prior 19
Revised n/a

Indicator of soft jobs markets.


[top]

US – State Tax Reveues Stuggling


[Skip to the end]

Preliminary data for Jan – Mar quarter shows sales tax at -0.1% YY, first decline since 2002 Q1. 21 states out of 36 reporting so far saw declines. Inflation adjusted sales tax declined in at least 27 states. Income tax was +4.7% YY thus no notable deterioration yet.

Here are the sales tax data from largest states:

Califonia -0.9
Texas +6.7
NY +4.2
Florida -6.0
Illinois +0.1
Penn -1.0
Ohio +0.5
Michigan -0.7
Georgia -3.0
North Carolina -7.6

Separately, Tennessee says sales tax dropped 5.5% in April.

The key to aggregate demand is net state spending.

If taxes fall but spending is sustained, that’s a demand add, for example.

Gross spending/taxing also has a multiplier greater than 1.

This includes states ‘borrowing to spend’ for ‘investment’ accounts.

GDP tables showed that states have cut back, reducing the size of their add to aggregate demand.

But Federal government has more than made up for it.


[top]

Bloomberg: US First Quarter Advance GDP: Statistical Summary


[Skip to the end]

U.S. First Quarter Advance GDP: Statistical Summary (Table)

by Kristy Scheuble

(Bloomberg) Following is a summary of Gross Domestic Product from the Commerce Department.


  1Q 4Q 3Q 2Q 1Q 4Q 3Q
  2008 2007 2007 2007 2007 2006 2006

Annualized Quarterly Change

Real GDP 0.6% 0.6% 4.9% 3.8% 0.6% 2.1% 1.1%
YOY percent 2.5% 2.5% 2.8% 1.9% 1.5% 2.6% 2.4%

Year over year looks fine.

Personal consumption 1.0% 2.3% 2.8% 1.4% 3.7% 3.9% 2.8%

Down, but holding positive as income continues to grow.

Durable goods -6.1% 2.0% 4.5% 1.7% 8.8% 3.9% 5.6%
Nondurable goods -1.3% 1.2% 2.2% -0.5% 3.0% 4.3% 3.2%
Services 3.4% 2.8% 2.8% 2.3% 3.1% 3.7% 2.0%

Services picking up the slack from goods.

Gross private investment -4.7% -14.6% 5.0% 4.6% -8.2% -14.1% -4.1%
Fixed investment -9.7% -4.0% -0.7% 3.2% -4.4% -7.1% -4.7%
Nonresidential -2.5% 6.0% 9.3% 11.0% 2.1% -1.4% 5.1%
Structures -6.2% 12.4% 16.4% 26.2% 6.4% 7.4% 10.8%
Equipment & software -0.7% 3.1% 6.2% 4.7% 0.3% -4.9% 2.9%
Residential -26.7% -25.2% -20.5% -11.8% -16.3% -17.2% -20.4%

Housing still subtracting quite a bit, has to taper off as it bottoms albeit at very low levels.

  1Q 4Q 3Q 2Q 1Q 4Q 3Q
  2008 2007 2007 2007 2007 2006 2006
Exports 5.5% 6.5% 19.1% 7.5% 1.1% 14.3% 5.7%
Goods 5.2% 3.9% 26.2% 6.6% 0.9% 9.6% 7.4%
Services 6.1% 13.2% 4.0% 9.6% 1.6% 26.0% 2.0%

March trade report could revise exports much higher…

Imports 2.5% -1.4% 4.4% -2.7% 3.9% 1.6% 5.4%
Goods 2.4% -2.6% 4.8% -2.9% 4.2% -0.6% 6.2%
Services 3.5% 5.5% 1.7% -1.7% 2.3% 14.2% 1.3%

and imports lower.

Government consumption 2.0% 2.0% 3.8% 4.1% -0.5% 3.5% 0.8%
Federal 4.6% 0.5% 7.1% 6.0% -6.3% 7.3% 0.9%
National defense 6.0% -0.5% 10.1% 8.5% -10.8% 16.9% -1.5%
Nondefense 1.8% 2.8% 1.1% 0.9% 3.8% -10.0% 6.0%

Federal government spending deferred from 2007 kicking in, especially defense..

State and local 0.5% 2.8% 1.9% 3.0% 3.0% 1.3% 0.7%

As state and local growth slows.

Other Measures

Change in inventories $B $1.8 -$18.3 $30.6 $5.8 $0.1 $17.4 $53.9
Net exports $B -$496 -$503 -$533 -$574 -$612 -$597 -$634
Real final sales -0.2% 2.4% 4.0% 3.6% 1.3% 3.5% 1.0%
Gross domestic purchases 0.4% -0.4% 3.3% 2.4% 1.1% 0.8% 1.3%
Final sales to dom purch -0.4% 1.3% 2.5% 2.1% 1.7% 2.1% 1.2%

Contribution to Change in GDP

Real GDP 0.6% 0.6% 4.9% 3.8% 0.6% 2.1% 1.1%

If revised up with March trade numbers, Q4 would have been the bottom.

Personal consumption 0.68% 1.58% 2.01% 1.00% 2.56% 2.68% 1.88%
Durables -0.48% 0.15% 0.35% 0.14% 0.67% 0.30% 0.43%
Motor Vehicle -0.37% 0.09% -0.17% -0.10% 0.35% 0.00% 0.16%
Nondurables -0.27% 0.25% 0.46% -0.10% 0.61% 0.86% 0.64%
Services 1.43% 1.18% 1.20% 0.96% 1.28% 1.52% 0.81%
Housing 0.23% 0.34% 0.27% 0.29% 0.26% 0.20% 0.18%

Again, services picking up the slack.

Gross pvt dom invest -0.70% -2.40% 0.77% 0.71% -1.36% -2.50% -0.70%
Fixed investment -1.50% -0.62% -0.11% 0.49% -0.70% -1.19% -0.80%
Nonresidential -0.28% 0.63% 0.96% 1.12% 0.22% -0.15% 0.53%
Structures -0.23% 0.41% 0.52% 0.78% 0.20% 0.23% 0.31%
Equipment & software -0.05% 0.22% 0.44% 0.34% 0.02% -0.38% 0.21%
Info processing 0.23% 0.51% 0.24% 0.36% 0.56% -0.06% 0.24%
Computers 0.12% 0.20% 0.08% 0.08% 0.25% 0.03% 0.09%
Software 0.13% 0.18% 0.07% 0.16% 0.14% 0.04% 0.05%
Residential -1.23% -1.25% -1.08% -0.62% -0.93% -1.04% -1.33%

Soft quarter for investment at least partially due to the widespread recession psychology.

  1Q 4Q 3Q 2Q 1Q 4Q 3Q
  2008 2007 2007 2007 2007 2006 2006
Change in inventories 0.81% -1.79% 0.89% 0.22% -0.65% -1.31% 0.10%
Nonfarm 0.93% -1.69% 0.87% 0.27% -0.69% -1.56% 0.01%
Net exports 0.22% 1.02% 1.38% 1.32% -0.51% 1.25% -0.25%
Exports 0.67% 0.77% 2.10% 0.85% 0.13% 1.51% 0.62%
Goods 0.45% 0.33% 1.96% 0.53% 0.07% 0.73% 0.56%
Services 0.22% 0.45% 0.14% 0.33% 0.05% 0.78% 0.07%
Imports -0.44% 0.24% -0.72% 0.47% -0.63% -0.26% -0.88%
Goods -0.35% 0.39% -0.67% 0.42% -0.57% 0.09% -0.84%
Services -0.09% -0.15% -0.05% 0.05% -0.06% -0.35% -0.03%
Govt. consumption 0.39% 0.38% 0.74% 0.79% -0.09% 0.66% 0.14%
Federal 0.32% 0.04% 0.50% 0.41% -0.46% 0.50% 0.06%
National defense 0.28% -0.03% 0.47% 0.39% -0.54% 0.74% -0.07%
Nondefense 0.04% 0.06% 0.03% 0.02% 0.08% -0.24% 0.14%
State and local 0.07% 0.34% 0.24% 0.37% 0.36% 0.16% 0.08%

Implicit Price Deflators

GDP 2.6% 2.4% 1.0% 2.6% 4.2% 1.7% 2.4%

And higher numbers are in the pipeline as per the PPI and CPI reports.

Gross domestic purchases 3.5% 3.7% 1.7% 3.8% 3.8% 0.1% 2.5%

Not bad.

  1Q 4Q 3Q 2Q 1Q 4Q 3Q
  2008 2007 2007 2007 2007 2006 2006

Price Indexes

GDP 2.6% 2.4% 1.0% 2.6% 4.2% 1.7% 2.4%
YOY percent 2.2% 2.6% 2.4% 2.7% 2.9% 2.7% 3.2%
Personal consumption 3.5% 3.9% 1.8% 4.3% 3.5% -0.9% 2.6%
YOY percent 3.4% 3.4% 2.1% 2.3% 2.3% 1.9% 2.9%

Moving up.

ex food and energy 2.2% 2.5% 2.0% 1.4% 2.4% 1.9% 2.3%
Real final sales 2.7% 2.4% 1.0% 2.7% 4.2% 1.7% 2.3%

Moving up.

Gross domestic purchases 3.5% 3.7% 1.8% 3.8% 3.8% 0.1% 2.5%

Unannualized Quarterly Change

Current GDP 0.8% 0.7% 1.5% 1.6% 1.2% 0.9% 0.9%
Real GDP 0.1% 0.1% 1.2% 0.9% 0.2% 0.5% 0.3%

Seen a lot worse..

Weakness but no recession and even some improvement on the horizon as government and exports pick up the slack from housing and the financial sector.

Employment softer but still reasonably firm by mainstream standards with unemployment at 5%.

Prices continue firm as Saudis continue to hike crude prices, even as other commodities settle down some.

Hence, I see a narrowing output gap and higher prices on the horizon, and Fed rate hikes at least as aggressive as currently priced by the FF futures market.


[top]
2008-04-30 US Economic Releases


[skip to the end]


2008-04-30 MBAVPRCH Index

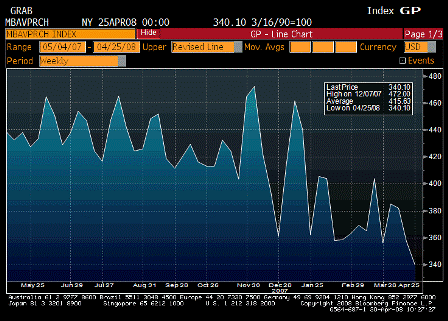
MBAVPRCH Index (Apr 25)

Survey n/a
Actual 340.1
Prior 357.3
Revised n/a

Definately looking weak. Winter is over, and tax rebates are in the mail.


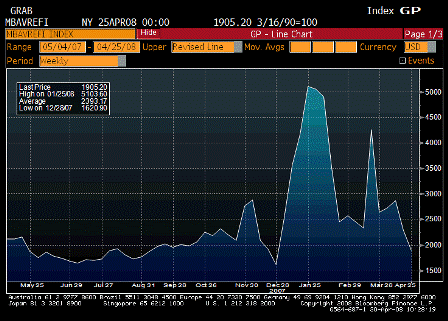
2008-04-30 MBAVREFI Index

MBAVREFI Index (Apr)

Survey n/a
Actual 1905.2
Prior 2286.3
Revised n/a

Settling down as well.


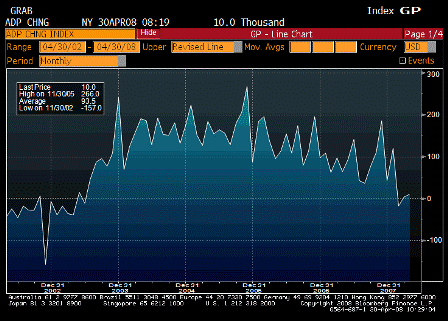
2008-04-30 ADP Employment Change

ADP Employment Change (Apr)

Survey -60K
Actual 10K
Prior 8K
Revised 3K

Employment growth continues to slow over time but not yet signaling recession.

Non-farm payrolls muddling through as well.


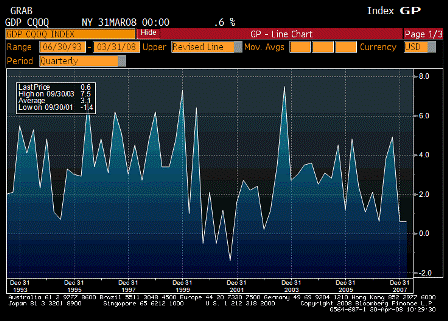
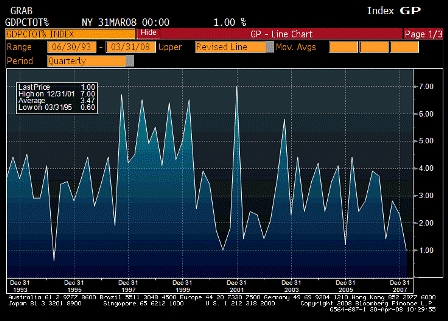
2008-04-30 GDP QoQ Annualized

GDP QoQ Annualized (1Q A)

Survey 0.5%
Actual 0.6%
Prior 0.6%
Revised n/a

Still in the black, and my guess is it’s likely to be revised up with the March trade numbers that are due in in a couple of weeks.


2008-04-30 Personal Consumption

Personal Consumption (1Q A)

Survey 0.7%
Actual 1.0%
Prior 2.3%
Revised n/a

Also holding up better than expected, and rebates are on the way.


2008-04-30 GDP Price Index

GDP Price Index (1Q A)

Survey 3.0%
Actual 2.6%
Prior 2.4%
Revised n/a

Better than expected, still high, and with crude continuing to move up it’s going up as well.


2008-04-30 Core PCE QoQ

Core PCE QoQ (1Q A)

Survey 2.2%
Actual 2.2%
Prior 2.5%
Revised n/a

The trend is up, and the Fed is monitoring it closely…


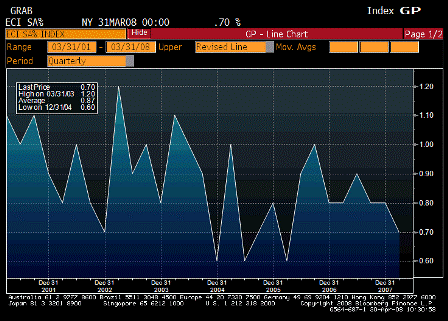
2008-04-30 Employment Cost Index

Employment Cost Index (1Q)

Survey 0.8%
Actual 0.7%
Prior 0.8%
Revised n/a

Looks under control, but not a brake on inflation.


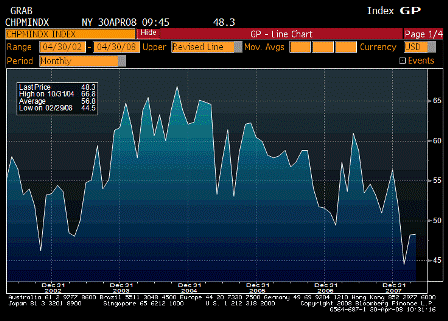
2008-04-30 Chicago Purchasing Manager

Chicago Purchasing Manager (Apr)

Survey 47.5%
Actual 48.3%
Prior 48.2%
Revised n/a

A touch better than expected, but still trending lower.


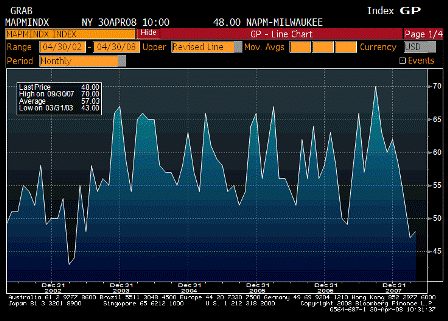
2008-04-30 NAPM-Milwaukee

NAPM-Milwaukee (Apr)

Survey n/a
Actual 48.0
Prior 47.0
Revised n/a

Also not down to recession levels yet.


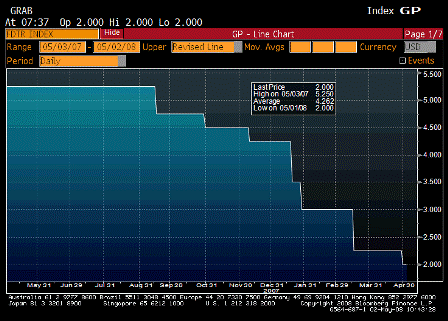
2008-04-30 FOMC Rate Decision

FOMC Rate Decision (Apr 30)

Survey 2.00%
Actual 2.0%
Prior 2.25%
Revised n/a

[comments]


[top]
Exports – looks good, feels bad

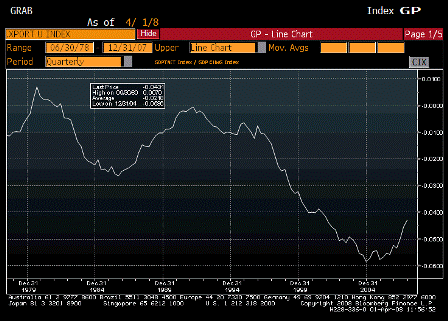
2008-04-01 Net Exports as a % of GDP

Net Exports as a % of GDP

(Keep in mind: exports are real costs; imports real benefits.)

Since January 2005 net exports (while still negative) have gone up by about 1.55% of GDP through 2007 year end, and so far have continued higher in Q1 2008.

In Q1 2005 the general environment was that of a 3% GDP growth rate while today it is at best about 1%.

That means for the economy as a whole, we ‘feel’ a total loss of ‘average domestic consumption/investment’ of over 3.5% of GDP.

That’s why to many economists it ‘feels’ like a recession even though real GDP remains somewhat positive.

We are experiencing a rapid deterioration of what’s called our ‘real terms of trade’.

That means even though we might work just as hard and produce just as much, we get to consume less while we export more.

How far can this go?

It is all a function of how many USD financial assets the rest of the world desires to accumulate.

If that number is zero (meaning they don’t want to add to their multiple trillions of USD financial assets they already have), US net exports will go to zero.

And we will feel worse by another 4% of GDP, all else equal.

And our policy makers think this is a good thing.

In the last round of Congressional hearings Bernanke testified that he’d like to see less domestic consumption and more exports and investment.

Looks good, feels bad.