2008-07-24 US Economic Releases


[Skip to the end]


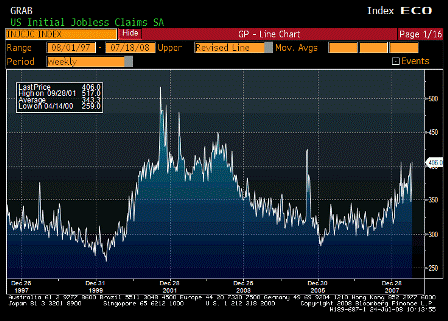
Initial Jobless Claims (Jul 19)

Survey 380K
Actual 406K
Prior 366K
Revised 372K

4 week moving average up a few thousand and drifting higher.
[top][end]

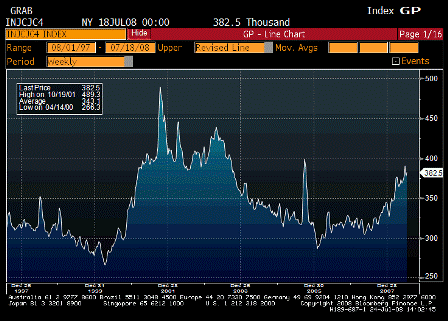
Initial Jobless Claims – 4 Week Moving Average (Jul 18)

Survey n/a
Actual 382.5
Prior 378.0
Revised n/a

[top][end]

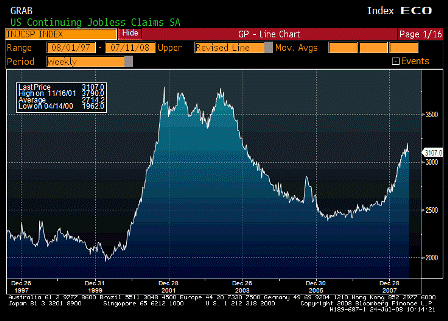
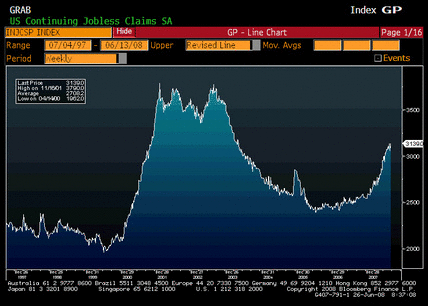
Continuing Jobless Claims (Jul 12)

Survey 3160K
Actual 3107K
Prior 3122K
Revised 3116K

But these are now coming down some.

[top][end]


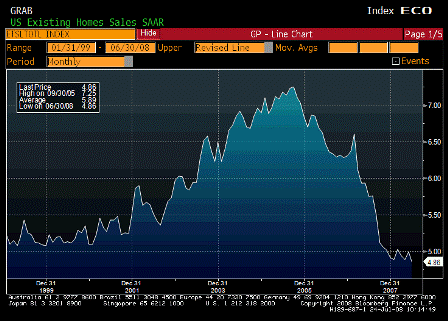
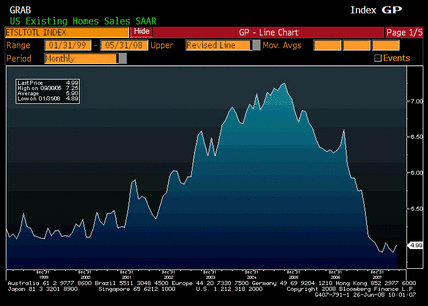
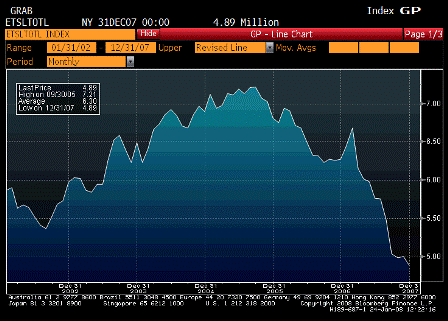
Existing Home Sales (Jun)

Survey 4.94M
Actual 4.86M
Prior 4.99M
Revised n/a

Less than expected, and bumping along the bottom as foreclosures dominate.
[top][end]

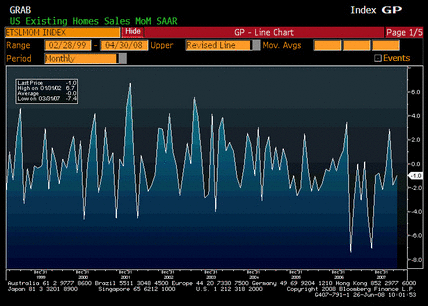
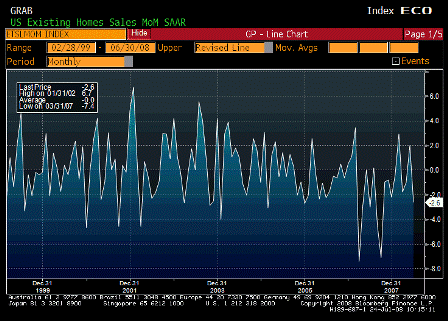
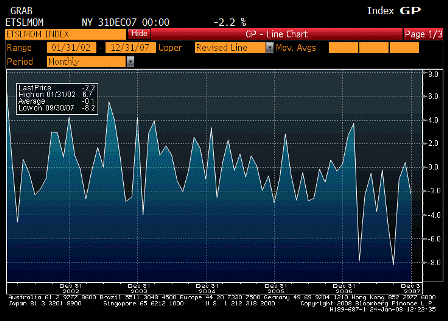
Existing Home Sales MoM (Jun)

Survey -1.0%
Actual -2.6%
Prior 2.0%
Revised n/a

[top][end]

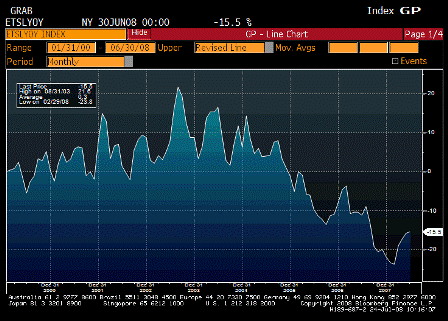
Existing Home Sales YoY (Jun)

Survey n/a
Actual -15.9%
Prior -17.5%
Revised n/a

Still falling but not quite as fast.

[top][end]

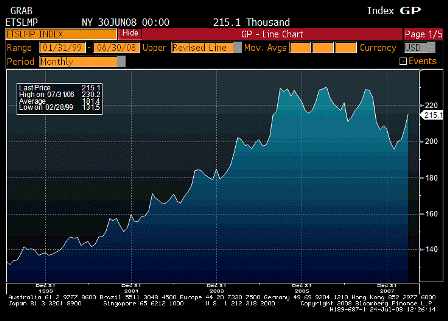
Existing Home Sales – Median Price (Jun)

Survey n/a
Actual 215.1
Prior 207.9
Revised n/a

[top][end]

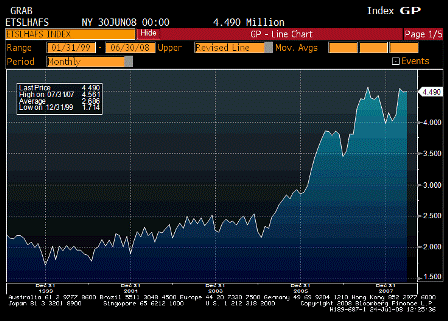
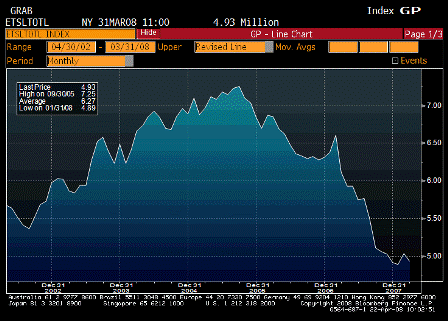
Existing Home Sales – Inventory (Jun)

Survey n/a
Actual 4.490
Prior 4.482
Revised n/a

Foreclosers addind to inventories.

[top][end]

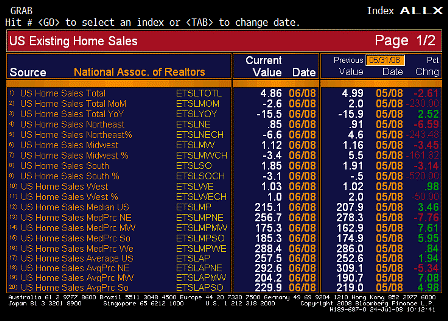
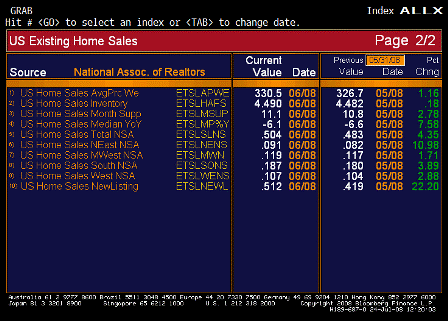
Existing Home Sales ALLX (Jun)

Median prices up in all regions.
[top][end]

Existing Home Sales ALLX cont (Jun)


[top]

2008-06-26 Daily US Economic Releases


[Skip to the end]


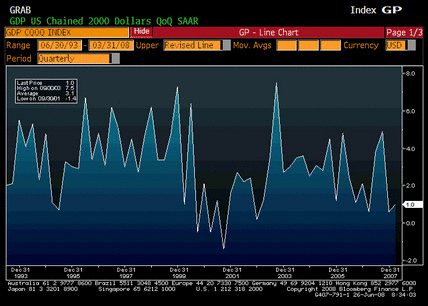
GDP QoQ Annualized (1Q F)

Survey 1.0%
Actual 1.0%
Prior 0.9%
Revised n/a

As expected.  Weak but no recession.

[top][end]


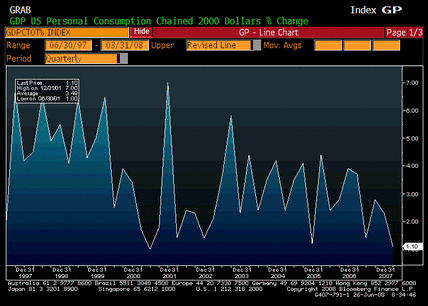
Personal Consumption (1Q F)

Survey 1.0%
Actual 1.1%
Prior 1.0%
Revised n/a

A touch better than expected with further improvement in Q2 still expected.

[top][end]


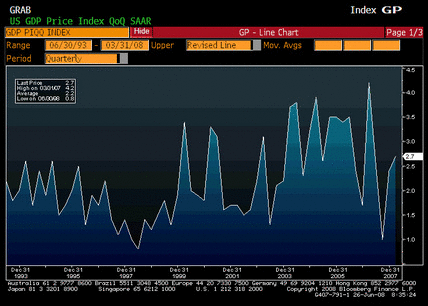
GDP Price Index (1Q F)

Survey 2.6%
Actual 2.7%
Prior 2.6%
Revised n/a

A bit worse than expected.

[top][end]


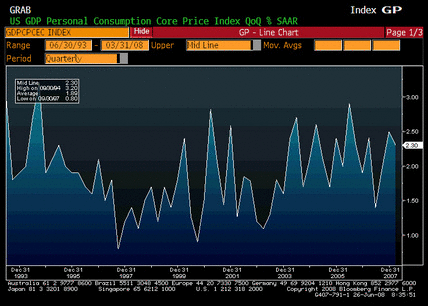
Core PCE QoQ (1Q F)

Survey 2.1%
Actual 2.3%
Prior 2.1%
Revised n/a

More than a bit worse than expected.
 
GDP better than expected, and inflation worse than expected was reflected in the Fed statement, but not in Fed action.

[top][end]


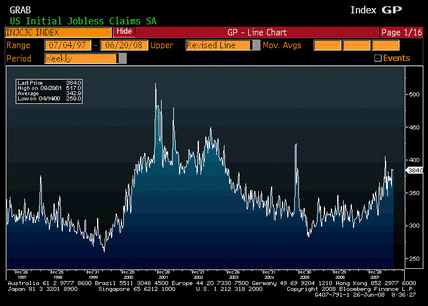
Initial Jobless Claims (Jun 21)

Survey 375K
Actual 384K
Prior 381K
Revised 384K

Unchanged from the previous week’s report that was revised up some.  Still in the new range.

[top][end]


Continiuing Jobless Claims (Jun 14)

Survey 3105K
Actual 3139K
Prior 3060K
Revised 3057K

A little worse than expected, prior week revised down marginally.

Weak, but no recession yet.

[top][end]


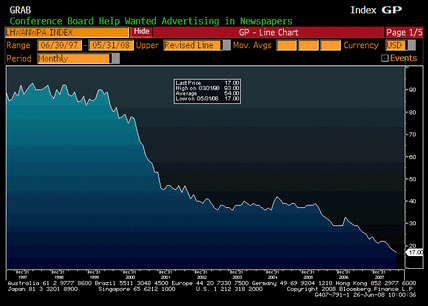
Help Wanted Index (May)

Survey 19
Actual 17
Prior 19
Revised 18

All evidence shows labor markets still soft.

[top][end]


Existing Home Sales (May)

Survey 4.95M
Actual 4.99M
Prior 4.89M
Revised n/a

Continuing signs of a bottom.
 
Levels are too low given demographics and should recover substantially even with a weak market.

[top][end]


Existing Home Sales MoM (May)

Survey 1.2%
Actual 2.0%
Prior -1.0%
Revised n/a

Better than expected.

[top][end]


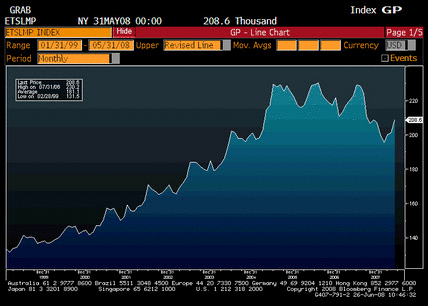
Existing Home Sales Median Price (May)

Survey n/a
Actual 208.6
Prior 201.2
Revised n/a

The upturn in prices wasn’t even reported by the mainstream press while the downturns were sensationalized.

[top][end]


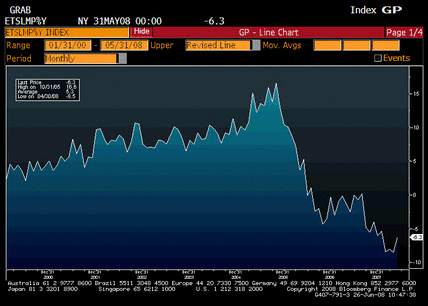
Existing Home Sales Median Price YoY (May)

Survey n/a
Actual -6.3%
Prior -8.5%
Revised n/a

Year over year price declines are far less than the case-shiller index which reports only on the largest metro areas.  OFHEO prices declined even less year over year.  Again, the mainstream media doesn’t report this and continues to repeat case-shiller numbers.

[top][end]


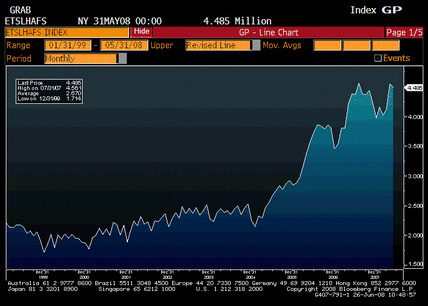
Existing Home Sales Inventories (May)

Survey n/a
Actual 4.485
Prior 4.549
Revised n/a

I thought the last spike up was suspect- might have had something to do with foreclosures hitting the list- and may now be turning down as well, following the actual numbers of new homes for sale which has been falling rapidly.

[top]
2008-05-23 US Economic Releases


[Skip to the end]


2008-05-23 Existing Home Sales

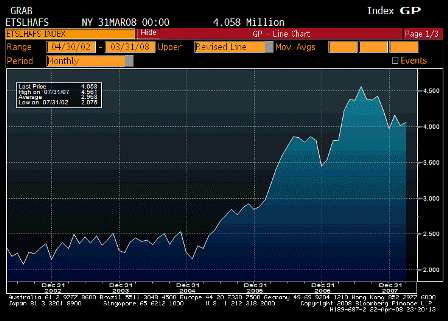
Existing Home Sales (Apr)

Survey 4.85M
Actual 4.89M
Prior 4.93M
Revised 4.94M

Looking more and more like a bottoming action.

[top][end]


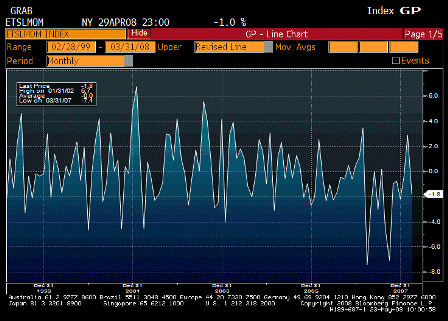
2008-05-23 Existing Home Sales MoM

Existing Home Sales MoM (Apr)

Survey -1.6%
Actual -1.0%
Prior -2.0%
Revised -1.8%

A touch better than expected for both March and April.


[top]
2008-04-22 US Economic Releases

  • Existing Home Sales
  • House Price Index
  • Richmond Fed Manufacturing Index
  • ABC Consumer Confidence

2008-04-22 Existing Home Sales

Existing Home Sales (Mar)

Survey 4.92M
Actual 4.93M
Prior 5.03M
Revised n/a

2008-04-22 Existing Home Sales MoM

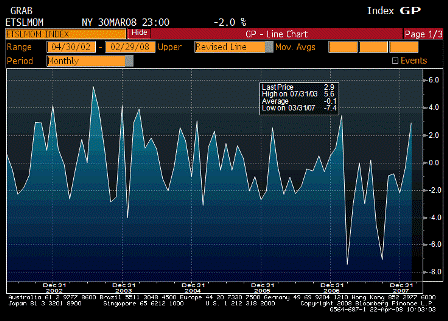
Existing Home Sales MoM (Mar)

Survey -2.3%
Actual -2.0%
Prior 2.9%
Revised n/a

Better than expected.
Might really be a bottom forming.


2008-04-22 House Price Index MoM

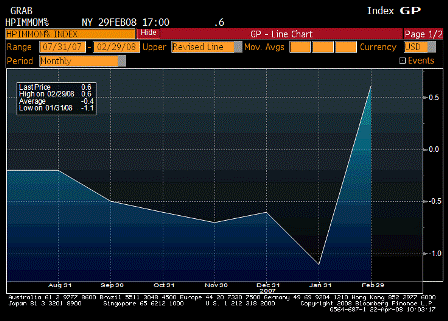
House Price Index MoM (Feb)

Survey -1.5%
Actual 0.6%
Prior -1.1%
Revised -1.0%

Up? Who would have thought?


2008-04-22 Richmond Fed Manufacturing Index

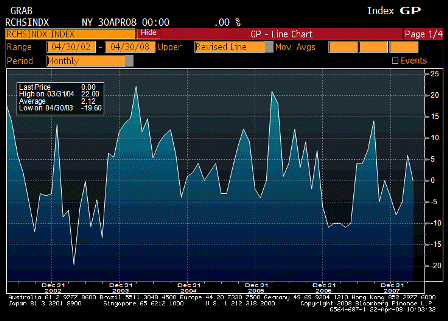
Richmond Fed Manufacturing Index

Survey -1
Actual 0
Prior 6
Revised n/a

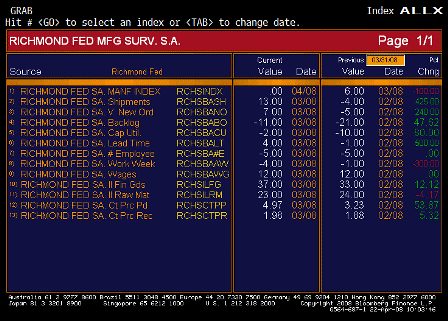
2008-04-22 Richmond Fed Manufacturing Index TABLE

Richmond Fed Manufacturing Index TABLE

Yes, another number better than expected and not looking so bad?

Fiscal package kicking in soon as well.

Prices firm through the slowdown, wonder what they might do if the economy stabilizes?


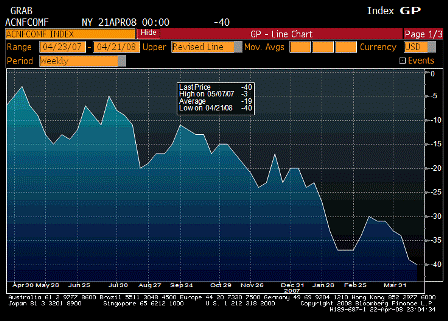
2008-04-22 ABC Consumer Confidence

ABC Consumer Confidence (Apr 20)

Survey n/a
Actual -40
Prior -39
Revised n/a

Still constant negative news on TV.

2008-03-24 US Economic Releases

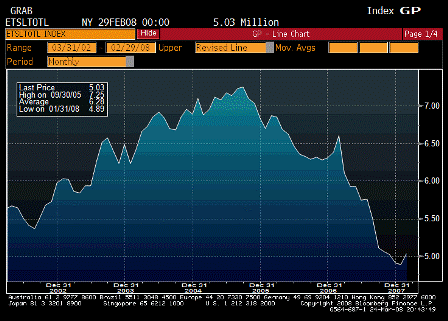
2008-03-24 Existing Home Sales

Existing Home Sales (Feb)

Survey 4.85M
Actual 5.03M
Prior 4.89M
Revised n/a

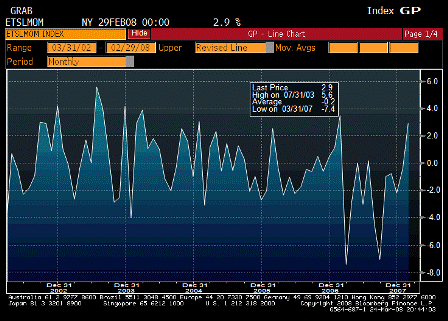
2008-03-24 Exisiting Home Sales MoM

Existing Home Sales MoM (Feb)

Survey -0.8%
Actual 2.9%
Prior -0.4%
Revised n/a

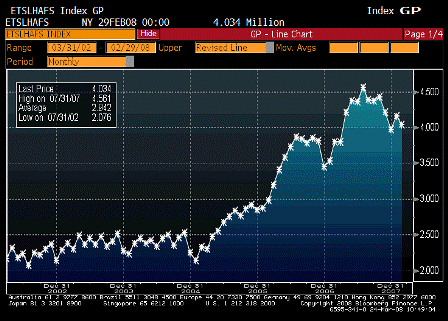
2008-03-24 Existing Home Sales Inventory

Existing Home Sales Inventory (Feb)

Survey n/a
Actual 4.034
Prior 4.160
Revised n/a

Better than expected.

Inventories coming down.

Median price down.

Expanded agency limits for conforming mortgages begin in May, which may be delaying closings for higher priced homes.

An upturn in housing can put the Fed on hold and support higher Q2 GDP growth.

2008-01-24 US Economic Releases

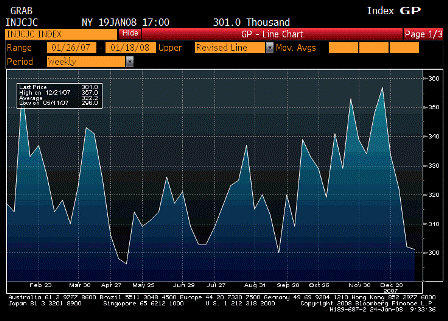
2008-01-24 Initial Jobless Claims

Initial Jobless Claims (Jan 19)

Survey 320K
Actual 301K
Prior 301K
Revised 302K

Back to the lows.

This means Q4 GDP probably won’t be all that weak.

Full employment recessions are extremely rare.

Exporters must have maintained and/or increased output as well, which will show up in the Dec trade numbers not out until Feb, so watch for upward revisions from next week’s initial GDP report.

And look for exports to continue strong as markets adjust to CB’s no longer accumulating $US financial assets at the same pace.


2008-01-24 Continuing Claims

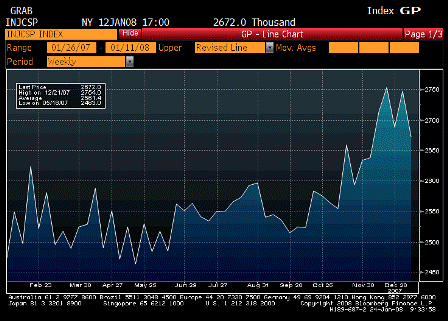
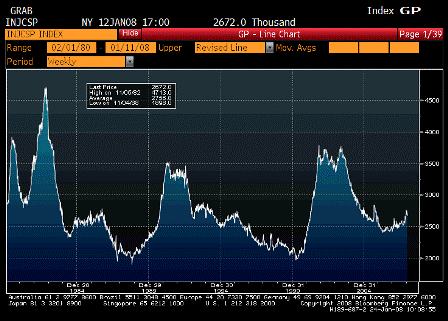
Continuing Claims (Jan 12)

2008-01-24 Continuing Claims since 1980

Continuing Claims since 1980

Survey 2720K
Actual 2672K
Prior 2715K
Revised 2747K

Also moving lower from a small blip up.

It’s all looking more and more like the great repricing of risk and the rearranging of financial assets hasn’t spilled over into the real economy. Yet.

And it also looks like the Fed may have done the ’emergency cut’ in response to Soc Gen evening up positions.

So the score is 175 bp in cuts into a growing economy and a triple negative supply shock that’s so far generated 4%+ year over year inflation and core numbers rising as well.

And demand for Saudi output is up to 9 million bpd, so their position as swing producer and price setter remains secure.

Not to mention the fiscal package that Bernanke has blessed – gives Congress and the President the green light to pump things up for the election.

And don’t forget Federal spending seems to have been moved forward from 2006 to 2007.

Economy should be at full boil by Q2, as we recover from the full employment recession…

And don’t worry about housing anymore. It’s all backwards looking and is a small enough % of GDP to not be a material negative to growth.

But if/when it turns, and I think that is already happening (but we need to wait until after the winter months to get some reliable data) it all starts to overheat again.


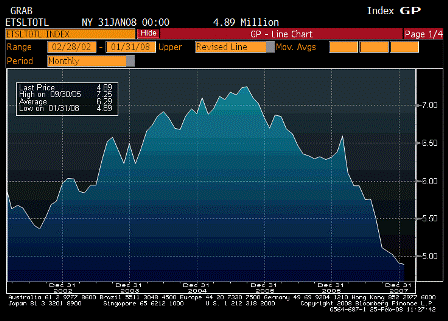
2008-01-24 Existing Home Sales

Existing Home Sales (Dec)

Survey 4.95M
Actual 4.89M
Prior 5.00M
Revised n/a

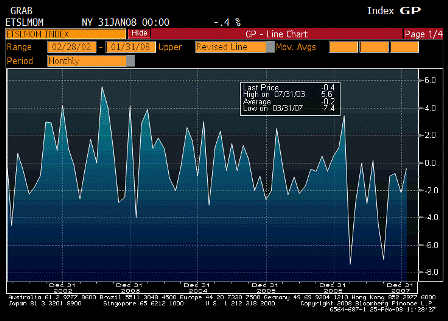
2008-01-24 Existing Home Sales MoM

Existing Home Sales MoM (Dec)

Survey -1.0%
Actual -2.2%
Prior 0.4%
Revised n/a

Both muddling through the winter months.


2008-01-24 Home Sales Average Price

Home Sales Average Price

2008-01-24 Existing Homes Inventory

Existing Homes Inventory

Inventories did drop some, and prices down only modestly year over year.


♥

2007-12-31 US Economic Releases

2007-12-31 Existing Home Sales

Existing Home Sales (Nov)

Survey 4.97M
Actual 5.00M
Prior 4.97M
Revised 4.98K

2007-12-31 Existing Home Sales MoM

Existing Home Sales MoM (Nov)

Survey 0.0%
Actual 0.4%
Prior -1.2%
Revised -1.0%

Could be bottoming. Affordability is up nicely, employment is reasonably strong, income holding up nicely. And on a per capita basis, housing is at forty year lows.


2007-12-31 NAPM-Milwaukee

NAPM-Milwaukee (Dec)

Survey n/a
Actual 62.0
Prior 60.0
Revised n/a

2007-12-31 NAPM-Milwaukee TABLE

NAPM-Milwaukee TABLE

Table looks solid, and prices are still up quite a bit.


♥