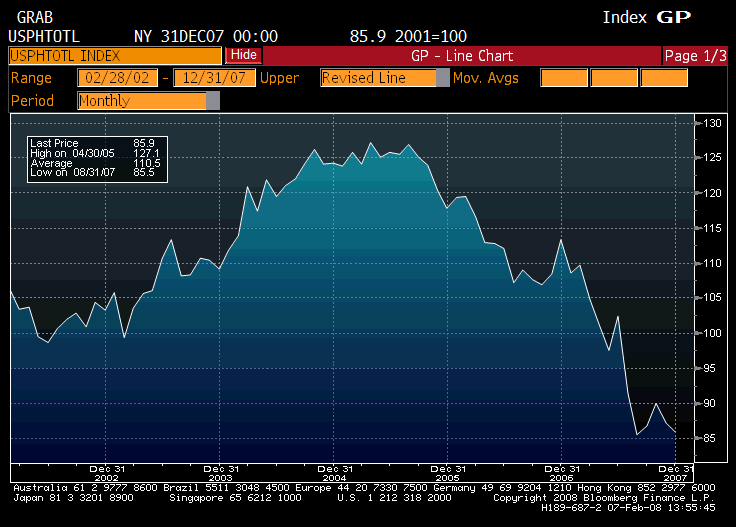
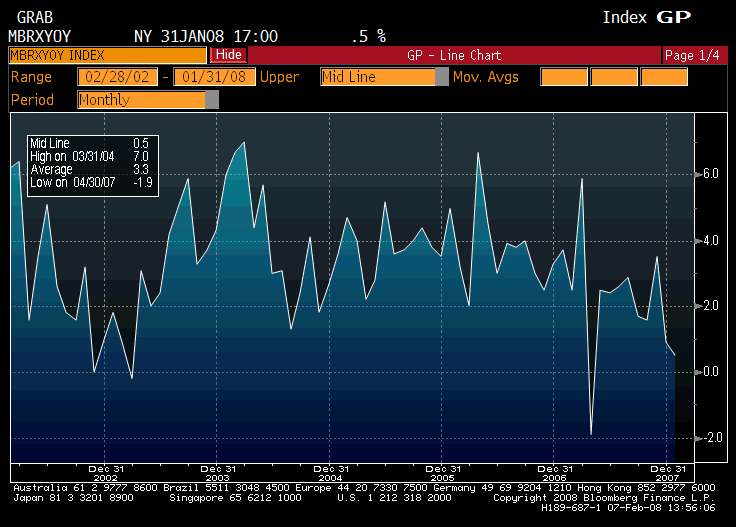
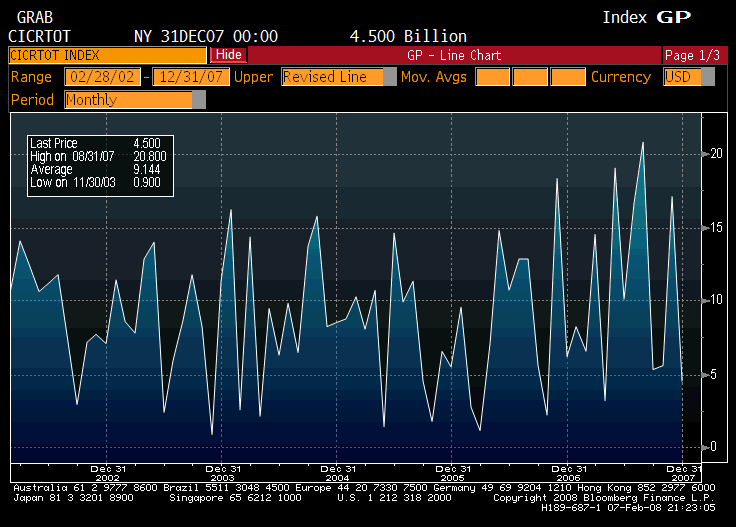
Please excuse the mix of Bloomberg and Valance graphs.
Comments welcome.
Went blurry eyed trying to organize it all.
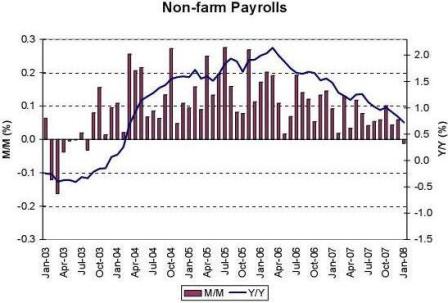
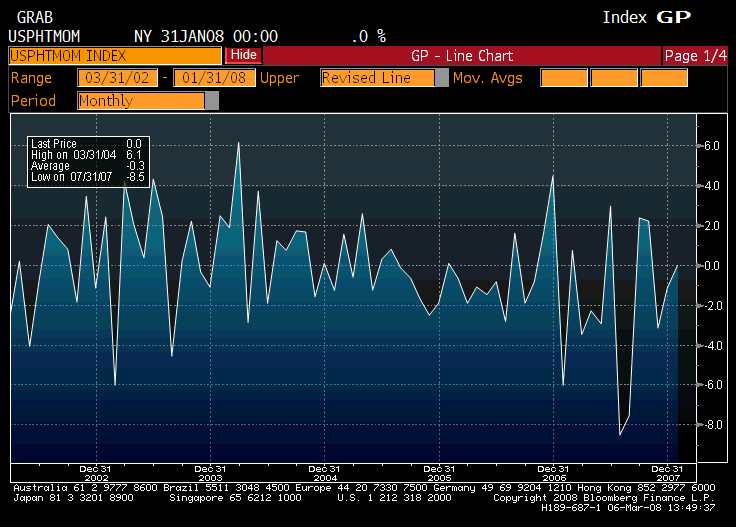
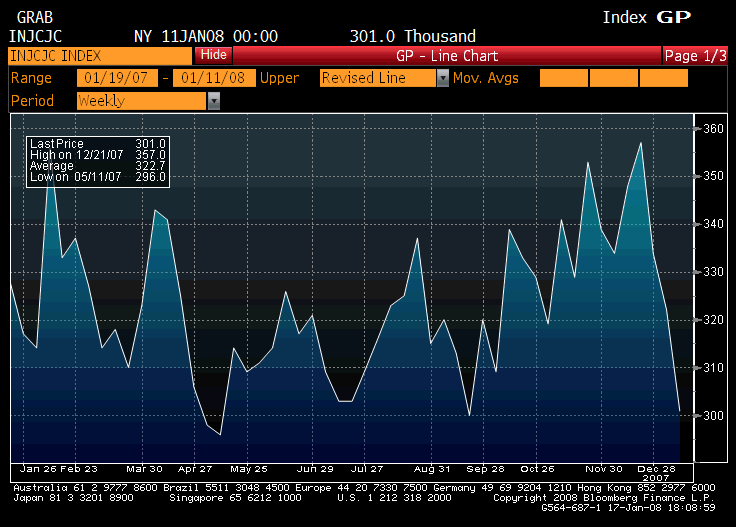
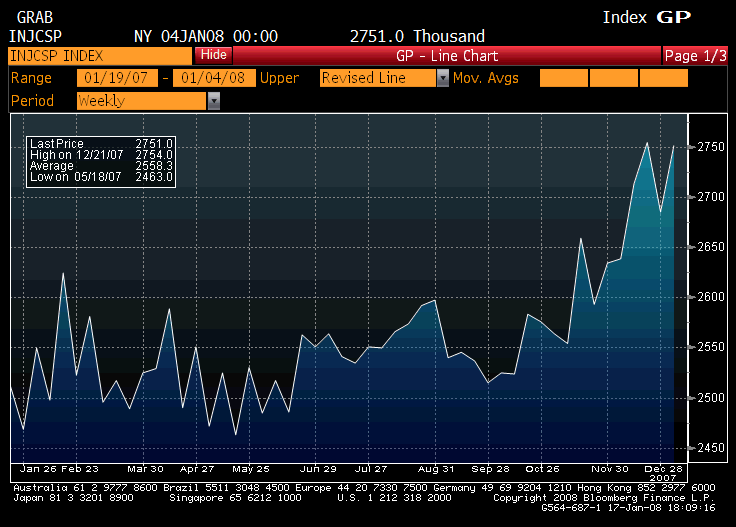
Markets reacted strongly to Friday’s -17,000 non-farm payroll number. Several sources called it the first negative payroll number in 4 years.
How quickly they forget the first negative number was the initial August number of
-4,000 that contributed heavily to the FOMC’s first rate cut. That number was revised upward the next month by close to 100,000 jobs and, if initially reported ‘correctly,’ might have changed the size of that rate cut. And, like the recent January number, the initial August number had a negative number for government workers that was subsequently revised upward and accounted for the majority of the revision.
Likewise, December’s initial report was weak, and the Fed reacted and markets traded accordingly, only to have it revised up to reasonably respectable 80,000 new jobs.
Clearly the initial numbers are far from reliable, and the initial revision is a far better indicator of the labor market conditions, with an eye out for second, third, and benchmark revisions that have also been meaningful.
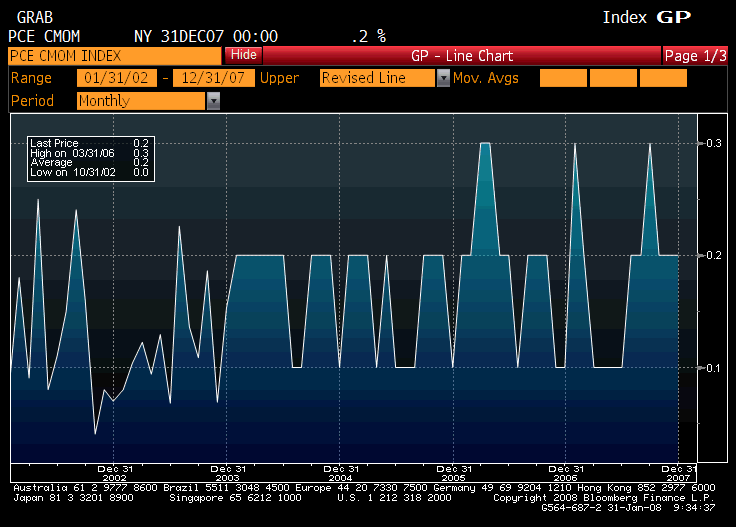
So if the January number is completely disregarded and only the numbers revised at least once are considered, non-farm payrolls have been moderating but are far from levels that would indicate recession. In fact, non-farm payrolls have been reasonably steady for the second half of 07 where GDP averaged over 3% annualized, with upward revisions very possible as well, but that’s another story.
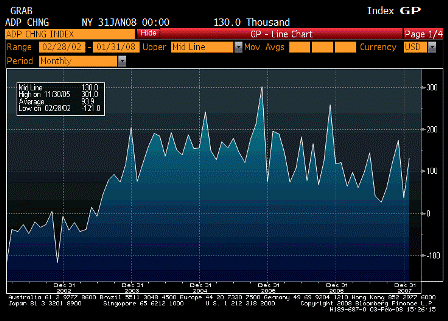
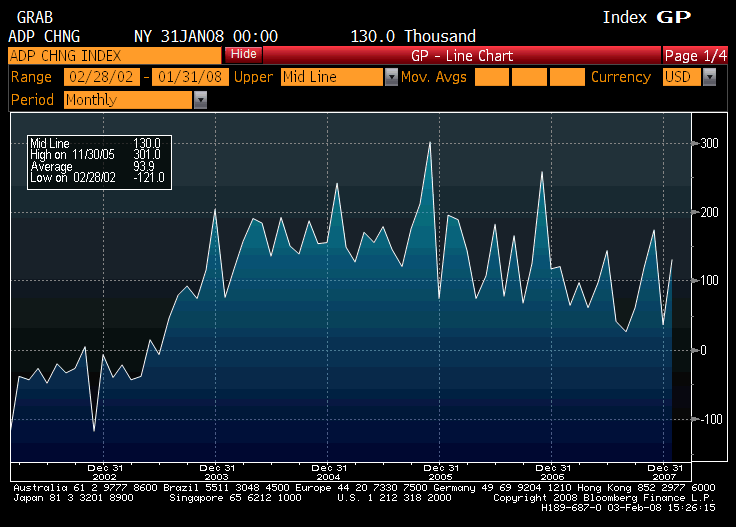
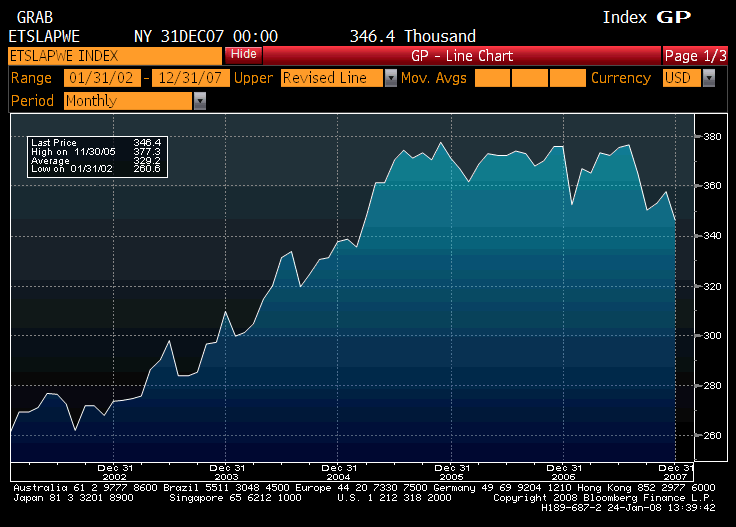
ADP
The ADP report of its near 400,000 payrolls has been a better indicator of the revised payroll numbers than of the initial payroll report. It’s also been showing the same gradual decline over the last few years as the (revised) payroll numbers due to the economy ‘using up slack’ and nearing full employment. But is has not dipped into negative territory or signaled a recession yet, further supporting the possibility of the Jan payroll number being revised up next month.
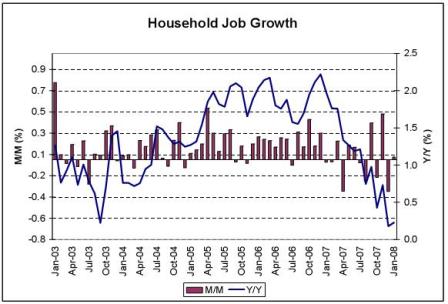
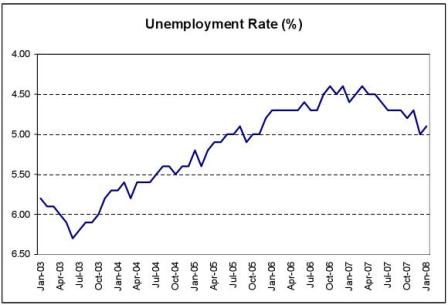
The unemployment numbers and household job growth numbers come from the household surveys, and the December jump in unemployment to 5% from 4.7% perhaps contributed even more heavily to the Fed’s latest decision to cut the fed funds rate a total of 1.25%. These are monthly survey numbers, so they are not subject to revision. The recent large fluctuations to both the upside and downside for the last 8 months are, however, on average, consistent with the above payroll reports of numbers revised at least once.
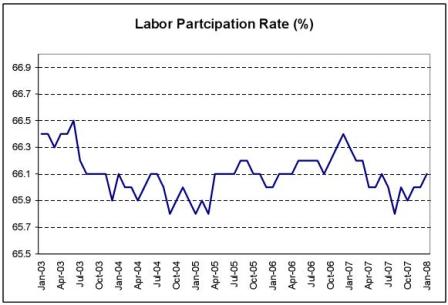
The labor force participation rate may also be an indicator of a reasonably firm labor market. At any point in time there are substantial numbers of people not actively seeking work and therefore technically not part of the labor force, but when firms make it know that they need more help some of these people are drawn back into the labor market and actively seek work. After what looks like a modest drop in the first half of 07 it seems to have recovered.
Additionally, the Fed anticipates this series to decline over time due to US demographics. That assumption would mean that over time lower payroll growth would be needed to sustain full employment, which is also consistent with what we saw for 07. In fact, Fed members (unofficially) consider a 4.75% unemployment rate to be ‘full employment.’ And anything below that risks elevating inflation expectations.
In fact, through August, the Fed’s policy was to allow unemployment to drift up to 5% to keep sufficient slack in the labor markets to keep the various inflation measures within its comfort zones.
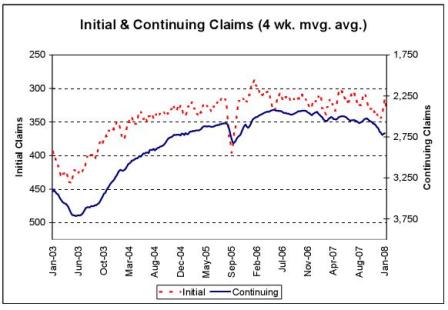
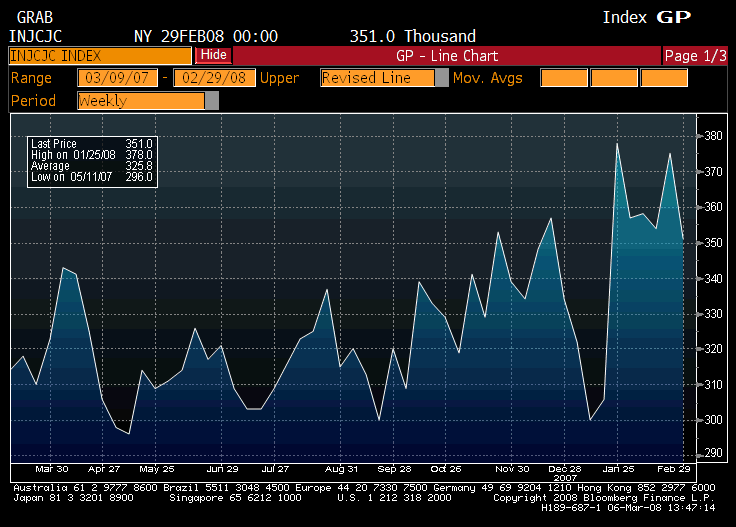
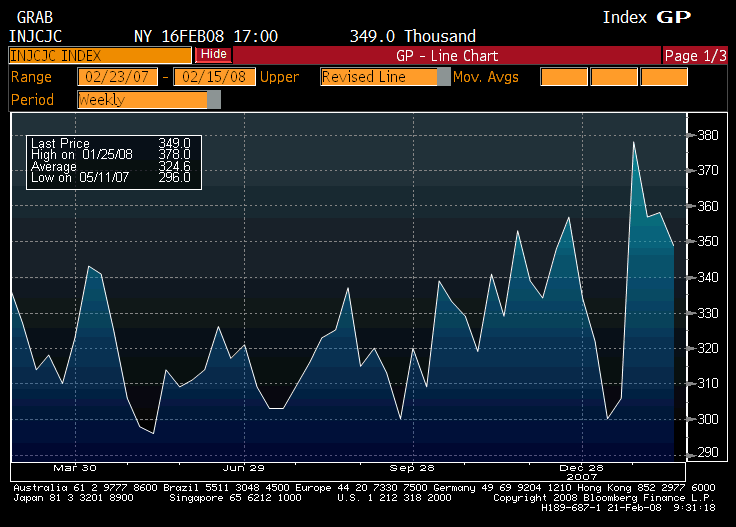
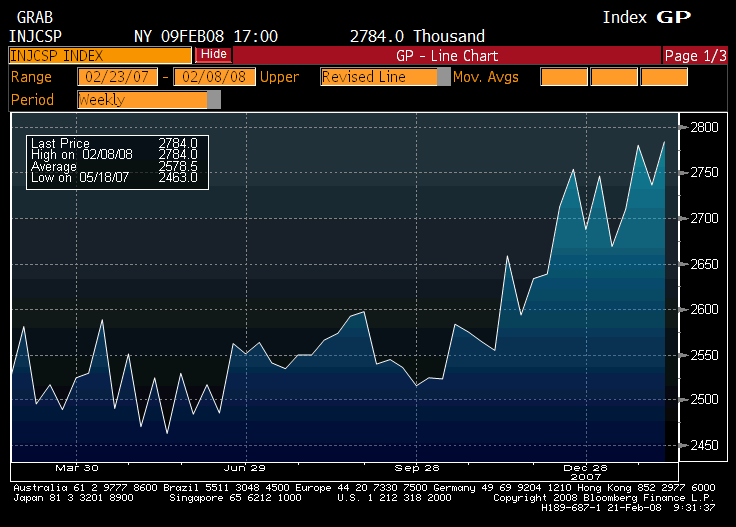
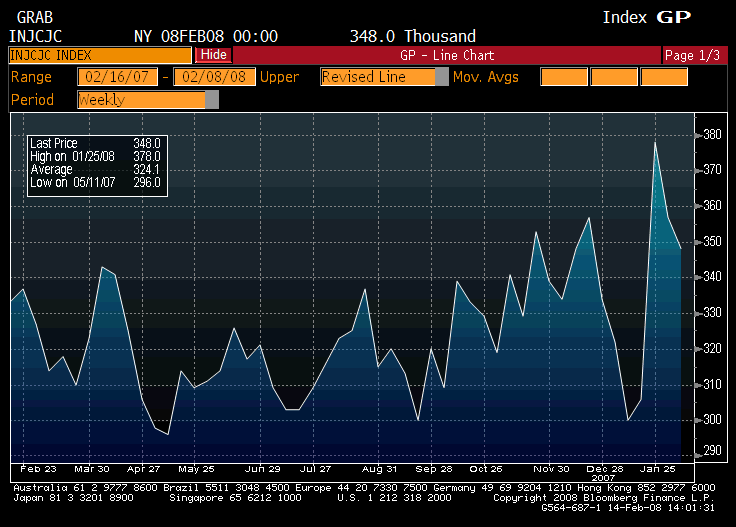
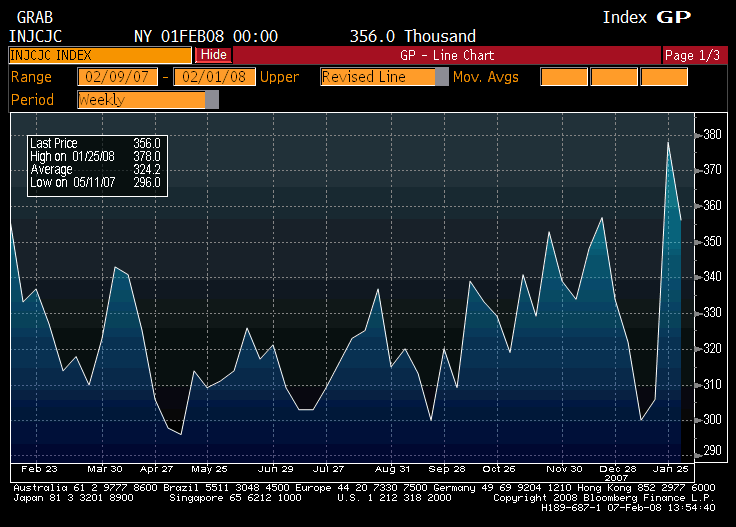
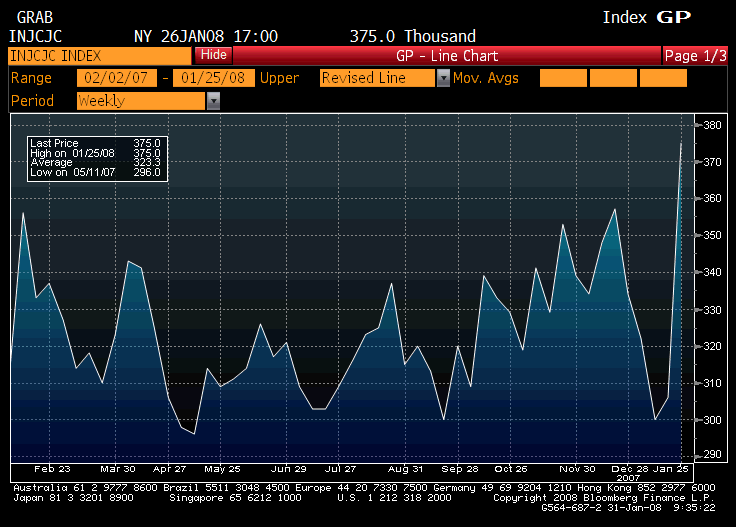
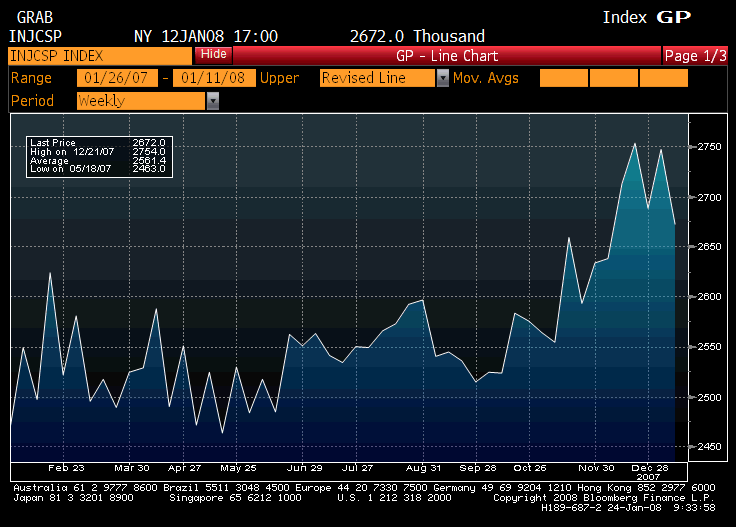
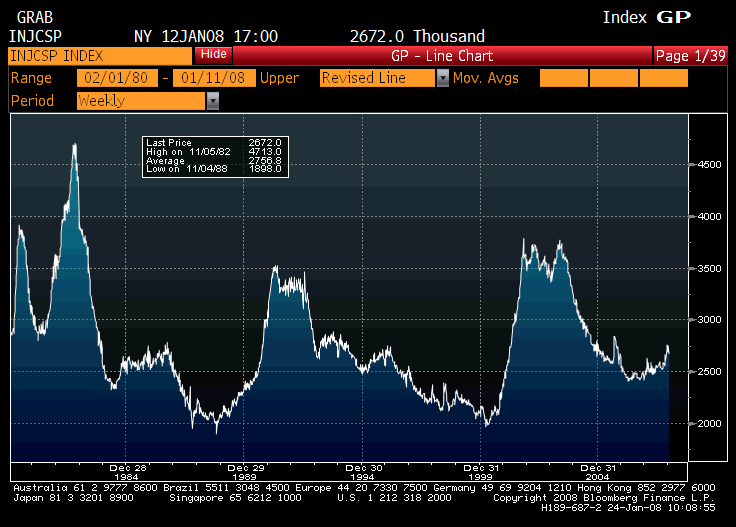
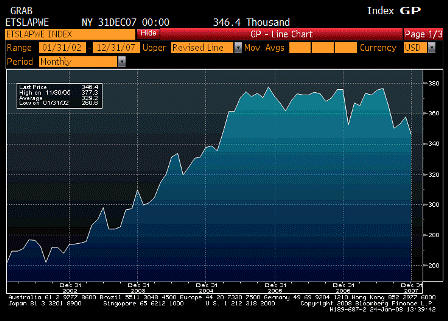
Initial unemployment claims are also not yet indicating recession, but instead staying in a range expected with a mature economy that has reached full employment and has leveled off at what the Fed considers full employment levels.
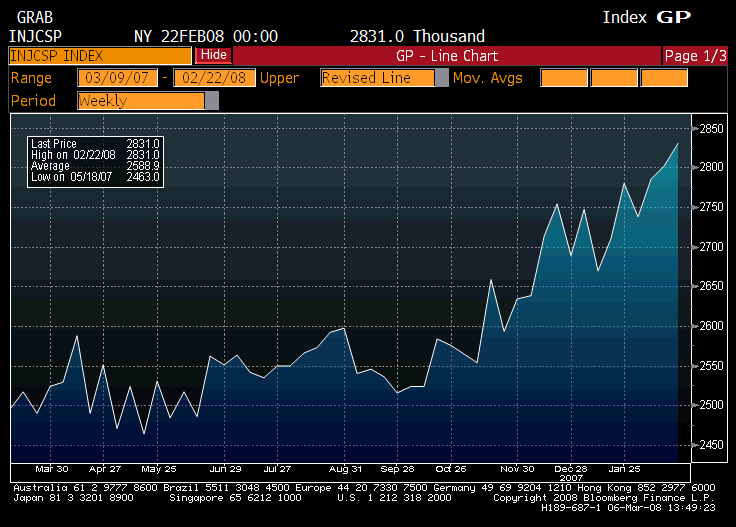
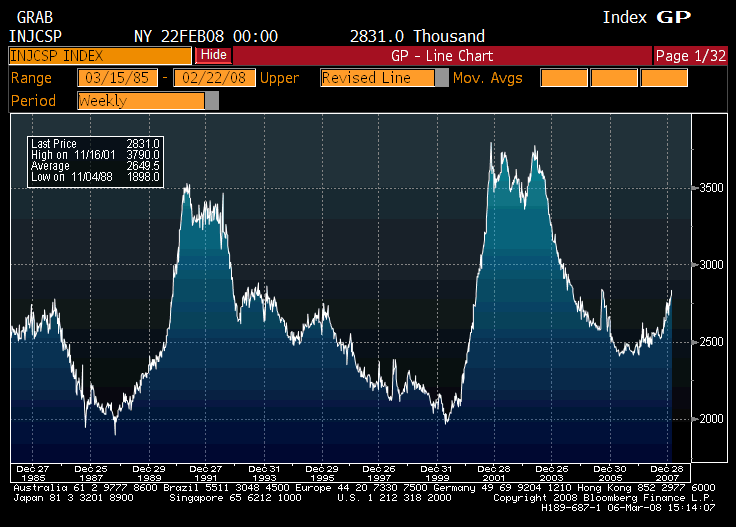
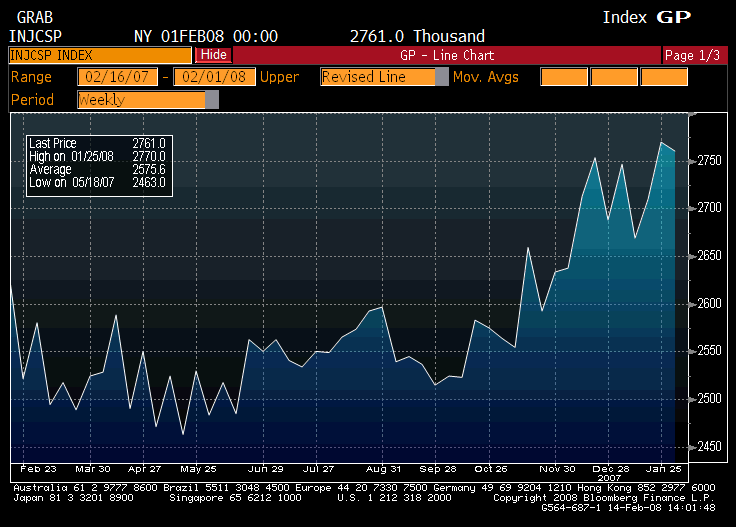
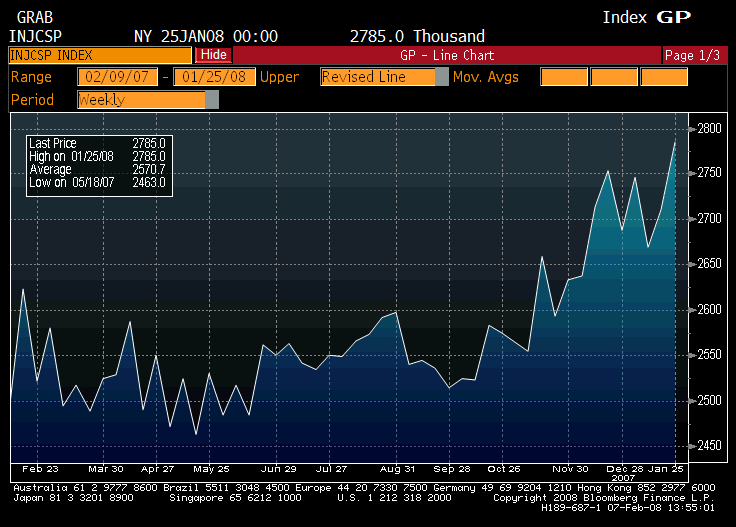
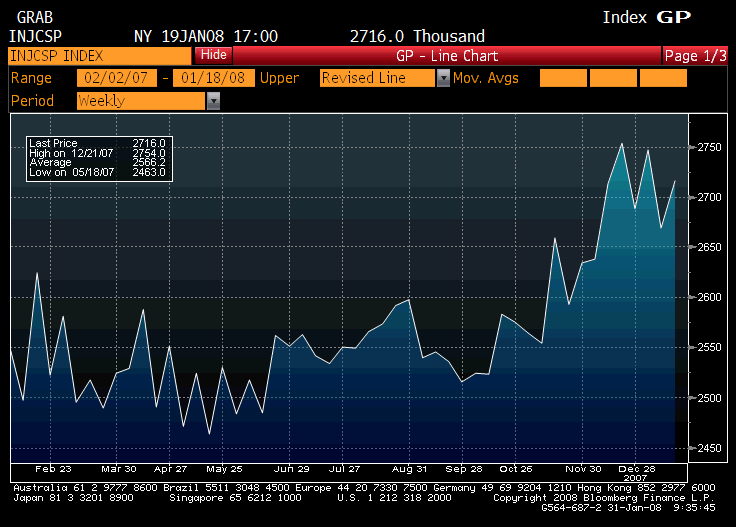
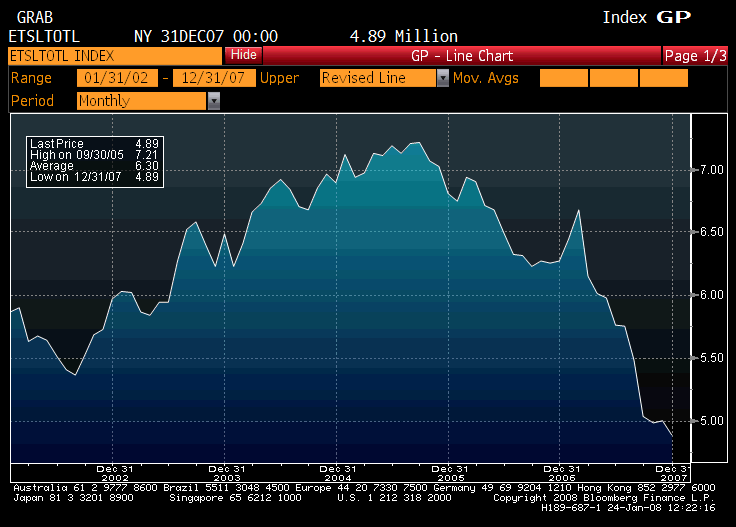
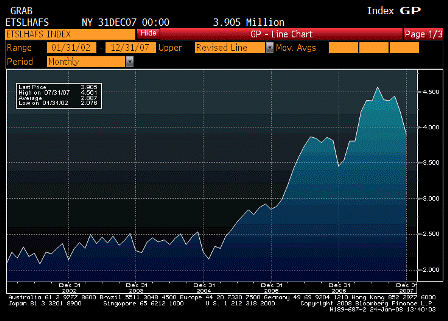
Continuing claims have moved up some, but not to anything near recession levels, and are now hovering around a level approximately consistent with the Fed’s perceived full employment level of about a 4.75% rate of unemployment.
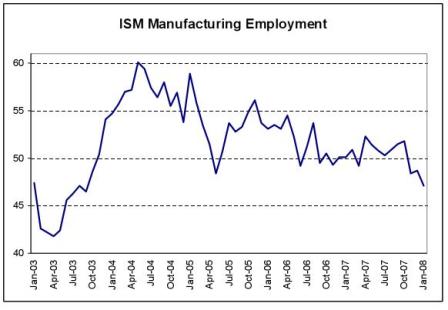
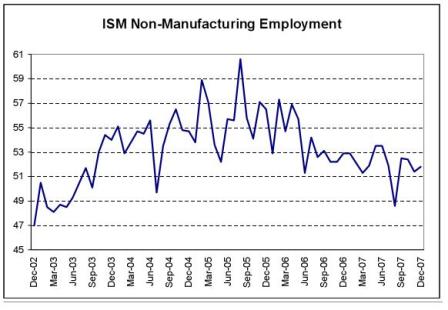
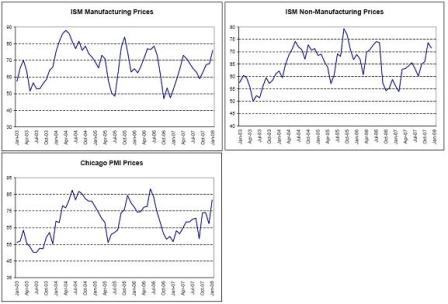
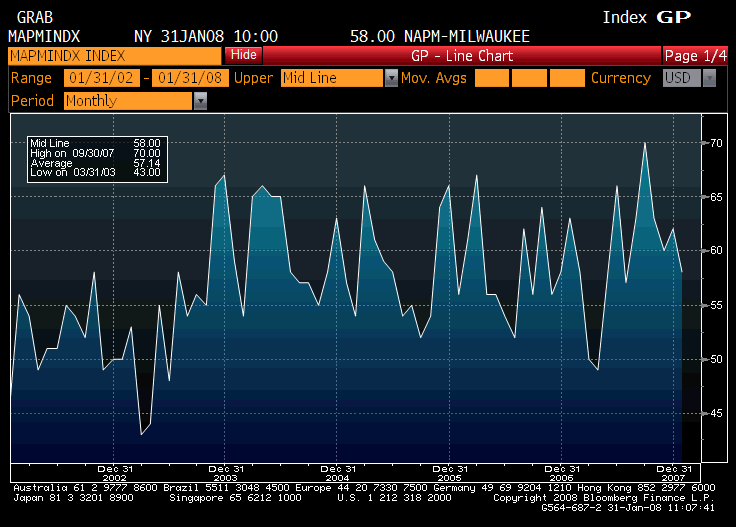
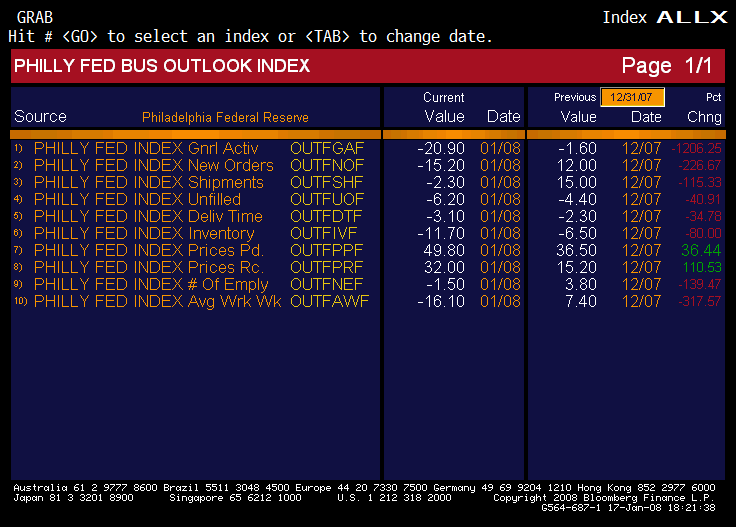
While moderating from previous levels of growth, taken together, the ISM numbers are hovering around 50. This too is consistent with an unemployment level just above the Fed’s 4.75% full employment estimate.
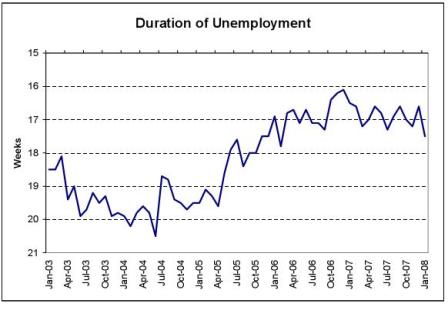
Duration of unemployment also continues to trade within a range consistent with current levels of unemployment.
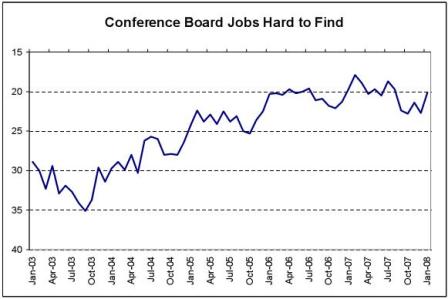
This survey as well as the ‘jobs plentiful’ survey both continue to move within a narrow range over the last 18 months.
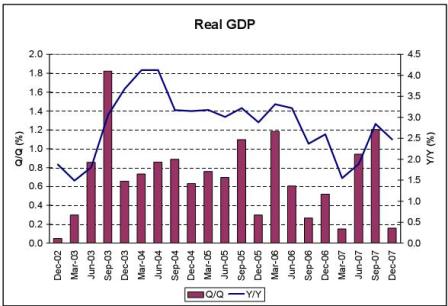
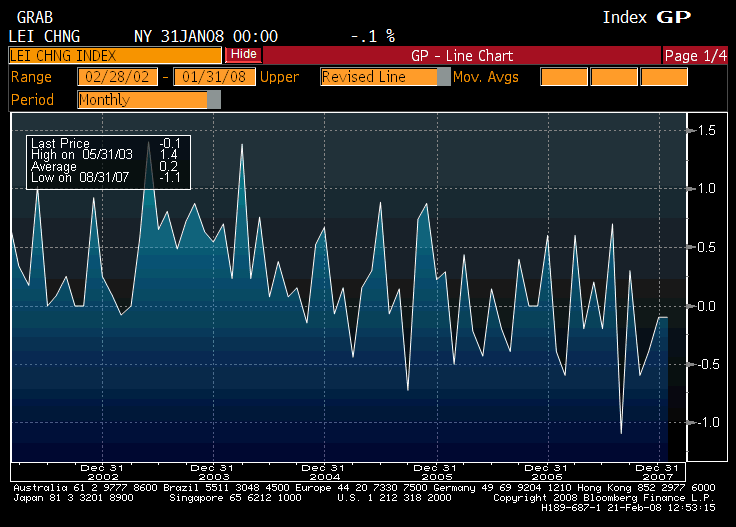
Real GDP also looks very firm. Since weak q4’s have been followed by stronger q1’s.
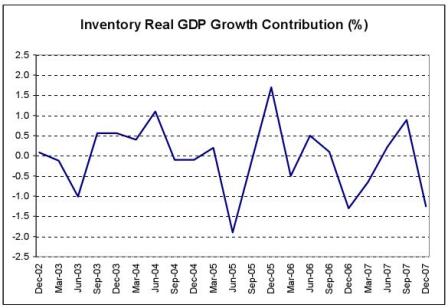
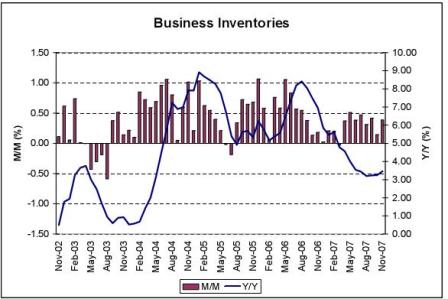
This year inventories were depleted by 1.4% in q4 and replenishing inventories from current very low levels should lend support to q1 growth. Low inventories are not indicative of a recession about to happen.
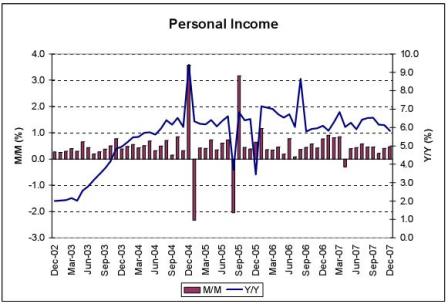
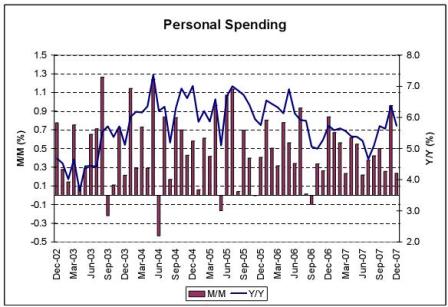
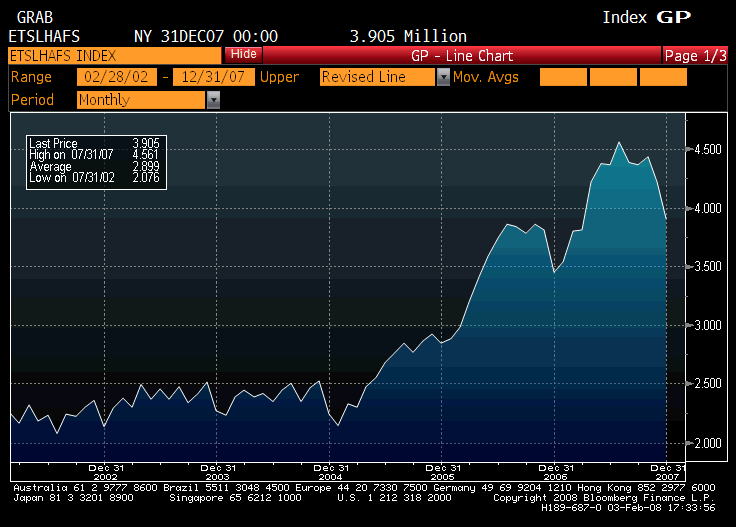
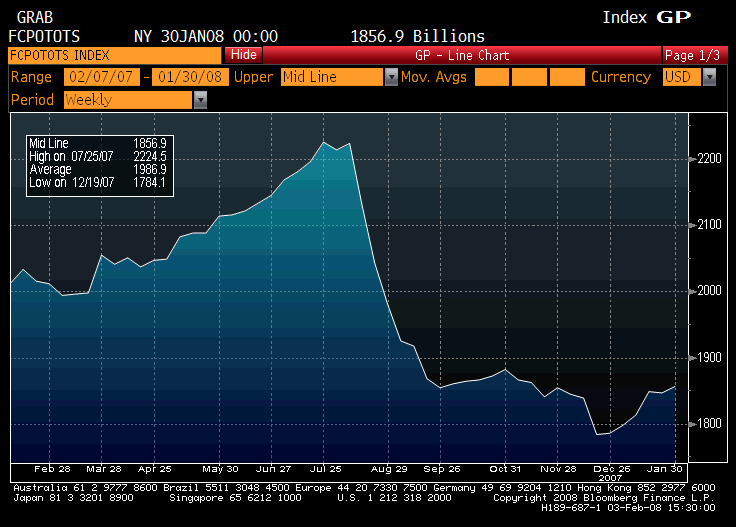
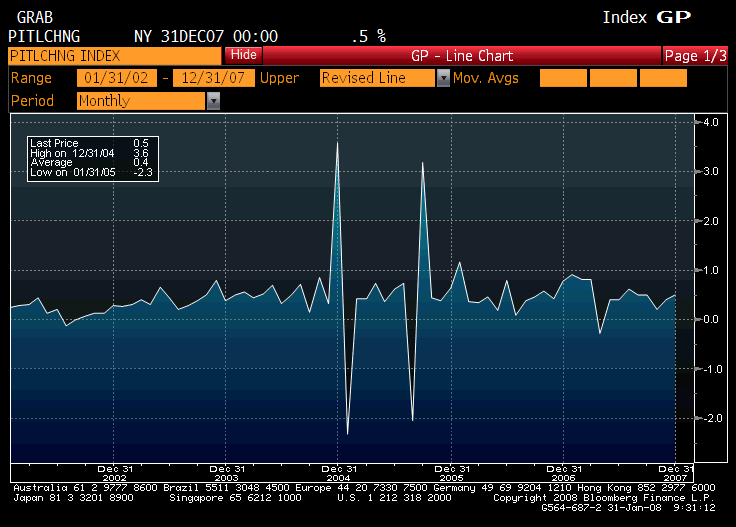
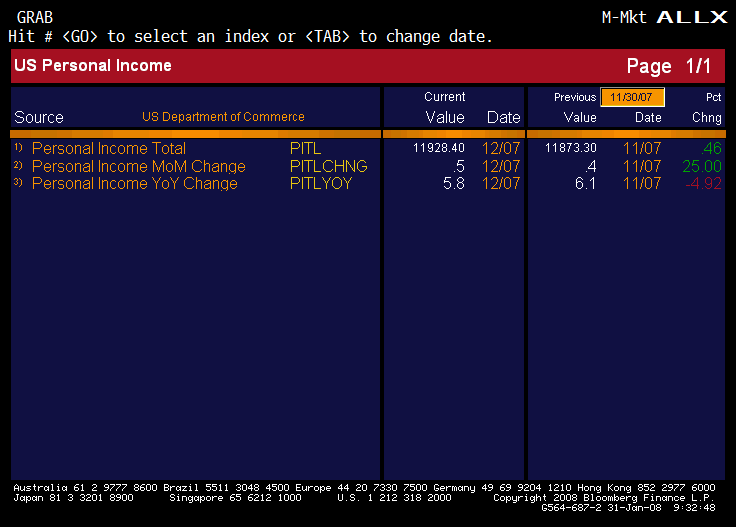
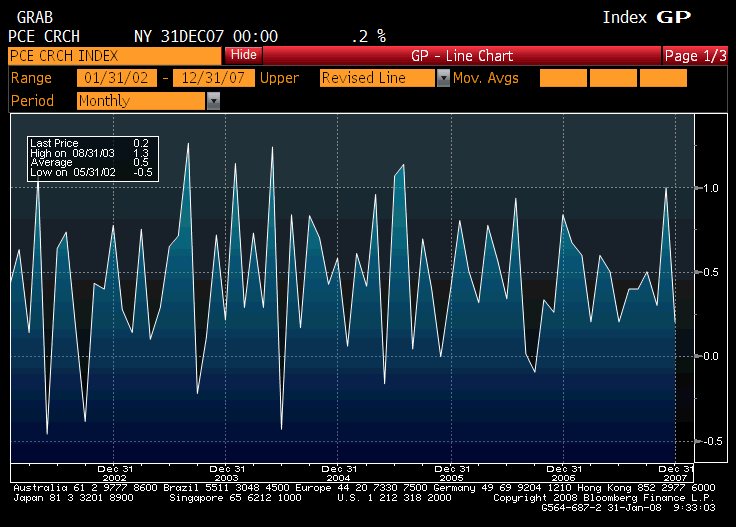
Personal income and spending are also consistent with current levels of employment and don’t yet show any sign of recession.
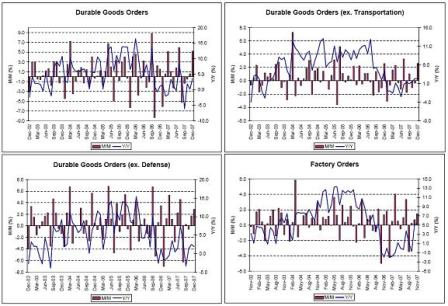
Durable goods are also not showing signs of recession yet.
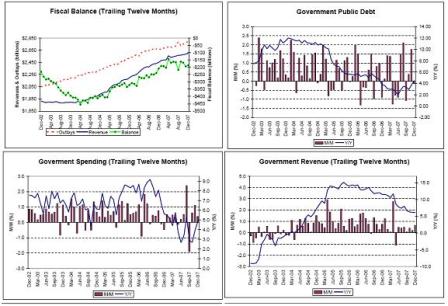
Both the non defense durable goods and the government spending charts seem to indicate government spending, including defense, may be accelerating back to previous levels. It is not impossible that some 07 govt. spending got moved forward and is beginning to kick in. Deficit spending is projected to increase by $25 billion in q1 due to increased govt. spending.
Additionally the proposed fiscal package scheduled for implementation in May could add a further 1% to q3 GDP.
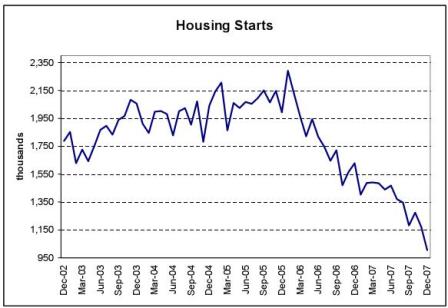

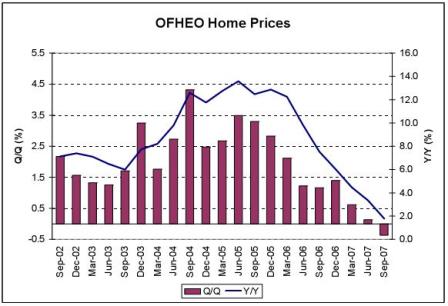
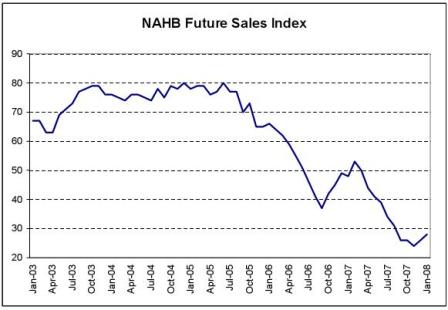
Housing remains weak, and continues to fall and subtract from GDP. And the risk that a wealth effect from falling home values could cut into consumer spending is pervasive.
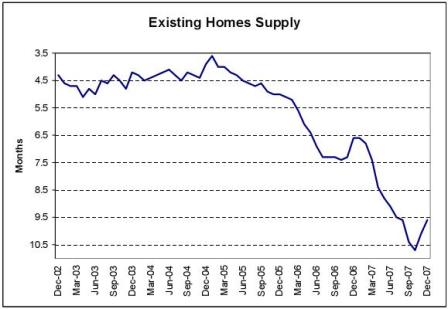
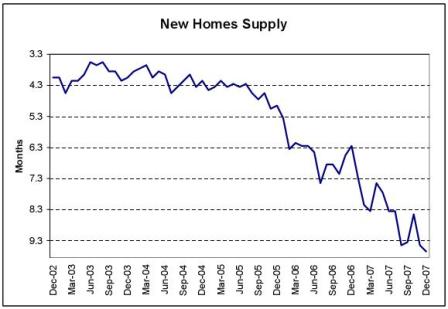

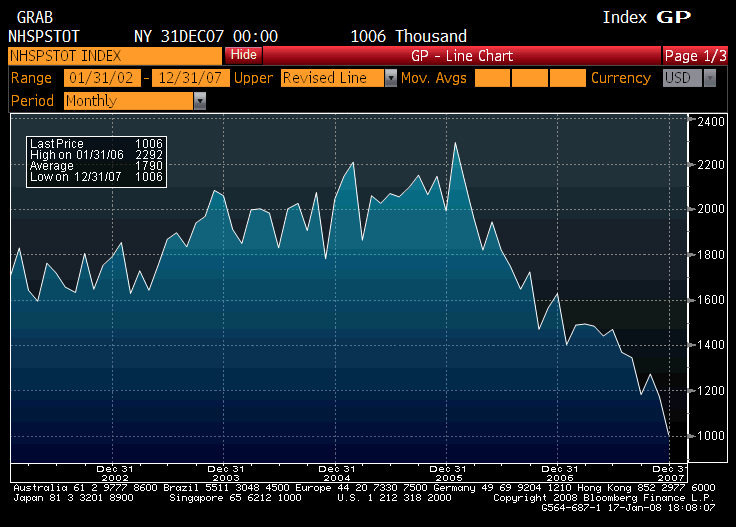
Existing Home Sales Inventory
Absolute inventories of new and existing homes have been going down for several months, even as the supply measure in months of sales kept falling due to falling monthly sales rates.
An increase in the rate of sales from current low levels will quickly reduce the months of inventory.
Sales may have bottomed in October/November.
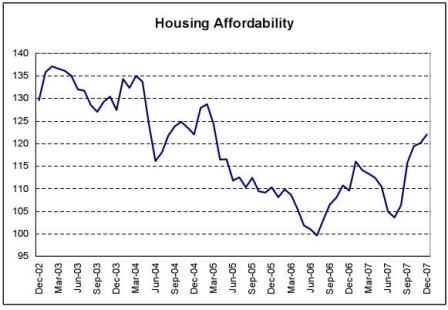
Lower prices, lower interest rates, and higher incomes all coming together.
This continues its modest, multi year decline. The Fed measures housing costs by calculating owner’s equivalent rent.
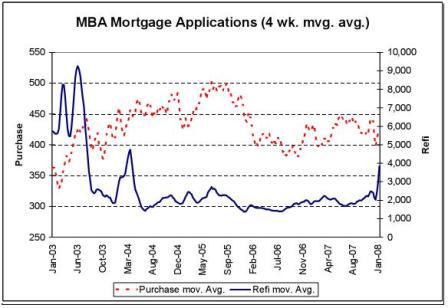
Refinance applications have spiked up indicating this market is functioning and credit worthy borrowers are able to obtain financing on favorable terms.
Purchase applications are also not showing signs of recession, assuming last week’s drop is not sustained.

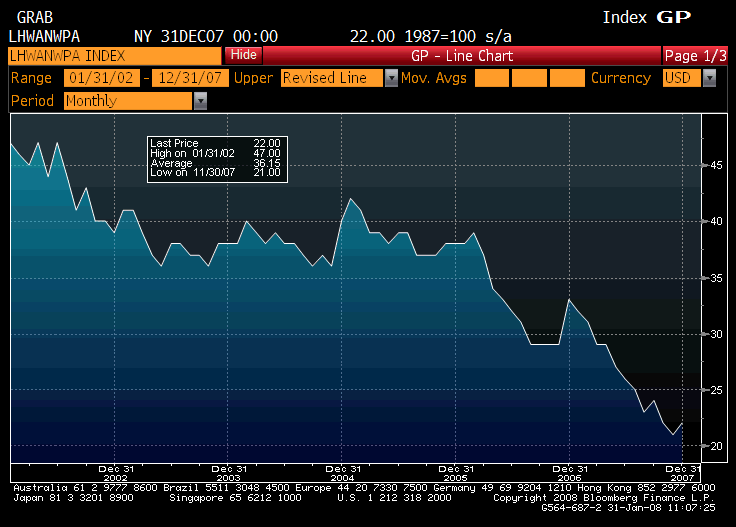
Commercial Paper Outstanding SA
Looks like the commercial paper market may be on the mend. Watch for bank loans losing steam as cp regains market share.
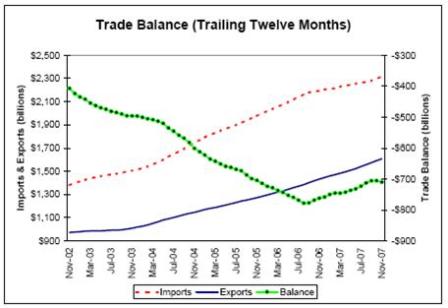
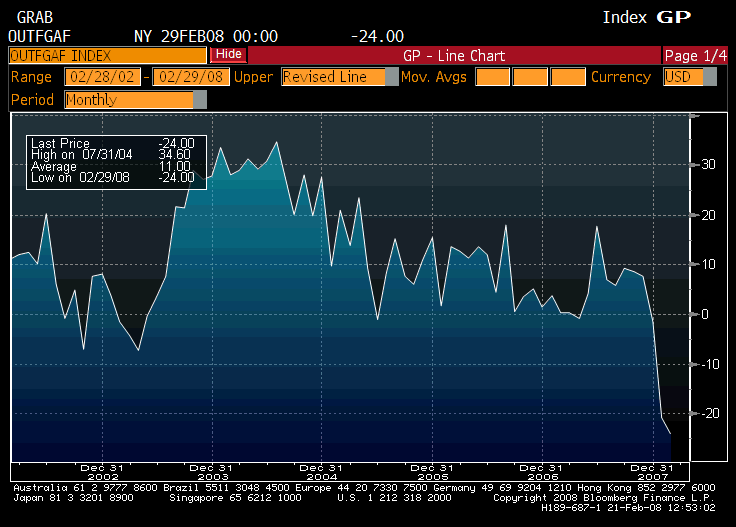
The big story for the US economy has been the rapidly growing exports. The additional GDP attributable to rising exports has so far more than offset the reduced contribution of housing.
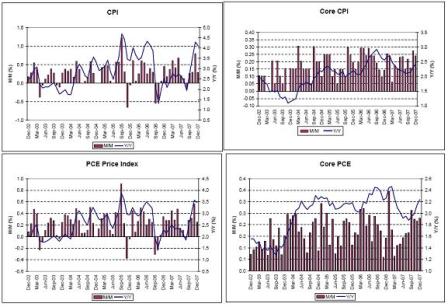
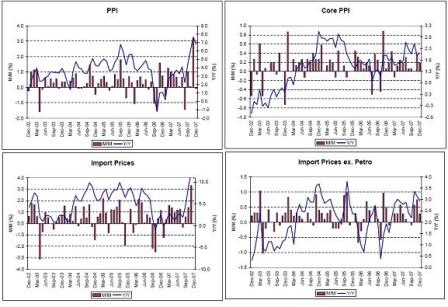
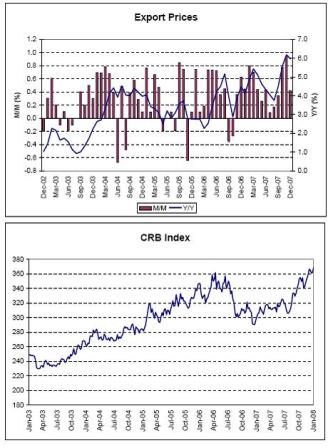
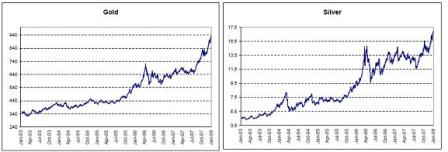
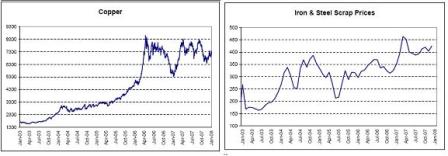
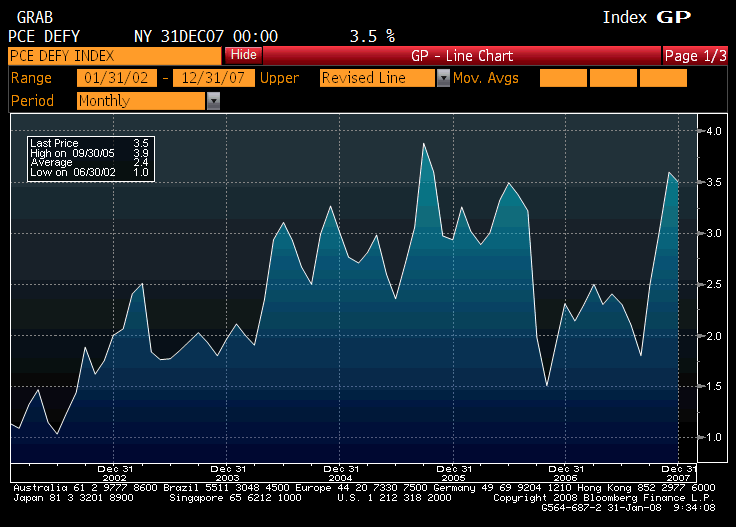
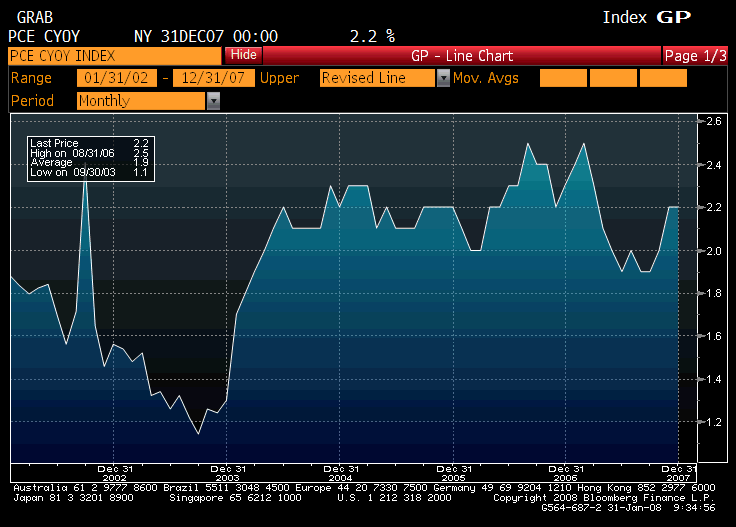
Prices have been rising at rates not seen since the great inflation of the 70’s began to wind down in the early 80’s, and the above numbers look a lot like those of the early 70’s. Additionally, it all started then and now with oil and other commodities trending sharply higher, and headline inflation indicators turning north for two or so years before core indicators followed.
The drop in prices the above charts show for the second half of 06 can be attributed to Goldman Sachs’ net reduction of the gasoline and crude oil weighting in its commodity index in Aug 06. This triggered substantial liquidations of long positions held by pension funds and other investors who were replicating the Goldman index for their investors, as well as the Goldman commodity fund itself selling gasoline and crude oil futures to reallocate to the new index. This had about run its course by year end, when at year end Goldman, and this time AIG as well, effectively further reduced the crude oil weighting in their indexes. This triggered yet another liquidation of positions. After prices bottomed and began rising again it was announced that control of the index had passed to S and P to avoid related party issues and conflicts of interest, and crude, gasoline, and other commodities resumed their former upward trends. Most have more than recovered and gone on to new highs.
Crude oil prices continue under the direct control of the Saudis, and probably the Russians as well. Saudis have been acting as ‘swing producer’ for several years, and Russia has now consolidated pricing so it can do the same. As any monopolist at the margin must do, they set price and then supply the quantity demanded at that price.
And as the Saudis have been posting ever higher prices (since the debacle of the second half of 06 previously described) the amount demanded at the higher prices has continued to increase. Last week OPEC announced that Saudi production was up to 9.2 million bpd, for example. Monthly production numbers are due out next week.
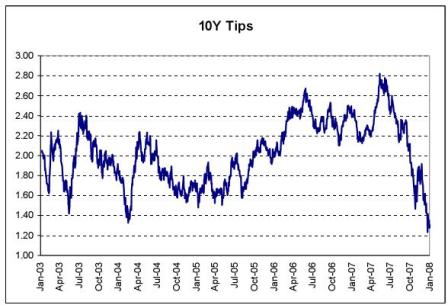
Meanwhile, the Fed has been aggressively cutting rates as what can most kindly be described as insurance against a recession. This has had an extreme effect on market expectations, as the 10 year tips are now discounting record low average ‘real rates’ by the Fed over the next 10 years, even as inflation continues to increase.
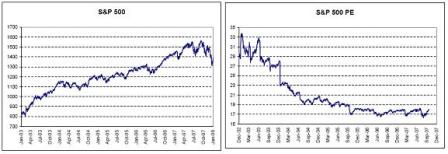
Equities remain at levels that look like very good value for long term investors.
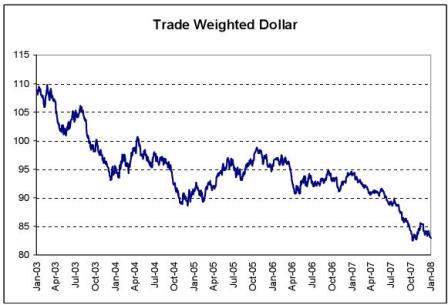
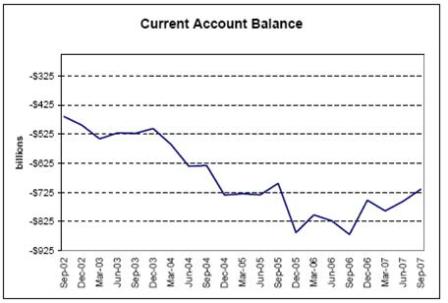
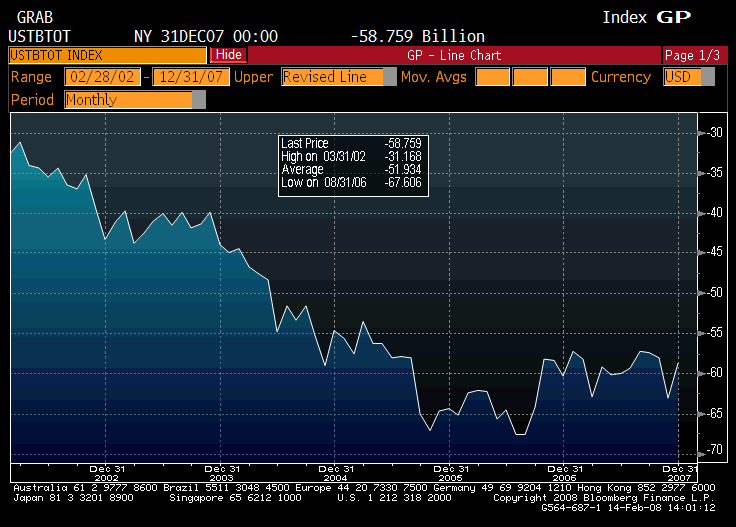
The US trade balance is a function of the desire of non residents to accumulate $US financial assets.
That desire had been increasing for a long time, as evidenced by the growing US trade deficit. And foreign Central Banks were the largest entities desiring to accumulate $US financial assets, thereby supporting their domestic export industries. Additionally, there is evidence US pension funds have been diversifying out of $US financial assets as well into both passive commodity strategies and (unhedged) foreign equities.
Three things have altered the rest of world (and our own pension fund) desire to accumulate $US financial assets, which are also evidence of a ‘weak dollar’ US policy:
- Treasury Secretary Paulson has labeled any Central Bank that adds to it’s holdings of $US financial assets a ‘currency manipulator’ and is deemed to be acting counter to US desires. This has led to reduced intervention in fx markets and curtailed the accumulation of $US financial assets by foreign CB’s.
- American military intervention in Iraq, and sanctions against Iran have led to a reduced desire to hold $US net financial assets in many nations in the mid east.
- The Fed chairman has pursued what looks like a pro inflation policy with aggressive interest cuts in the face of severe negative supply shocks and has also petitioned the President and Congress to increase the budget deficit with direct cash payments to tax payers.
This has triggered a general desire of non residents to decrease certain holding of $US financial assets. At the macro level, the way this happens is non residents first try to sell the $US in the market place, driving the price of the $US down. This continues until it reaches a level where the buyers of the $US are buying the currency because prices in the US are now low enough for them to buy US exports of goods and services, as well as US non financial assets including real estate.
Therefore I expect exports to continue to accelerate until non resident holdings of $US financial assets reach desired levels.
This is what export economies look like. Employment is high, but domestic prices are high enough so that domestic compensation (including government consumption) isn’t enough to buy the output, with the rest of the output being exported.
We are seeing that in the US. Domestic real consumption is moderating due to high energy and prices of other imports, while exports take up the slack in demand and support what the Fed considers near full employment levels.
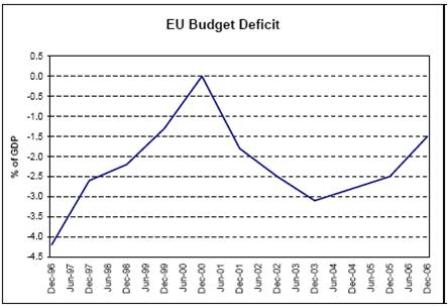
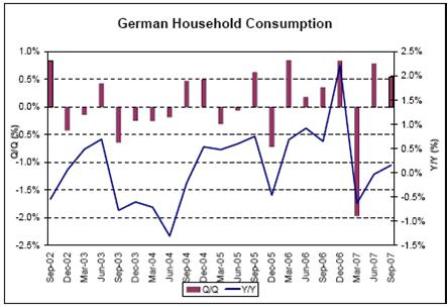
The Eurozone is seeing much the same thing. Declining budget deficits contribute to relatively low domestic demand and domestic consumption, ..
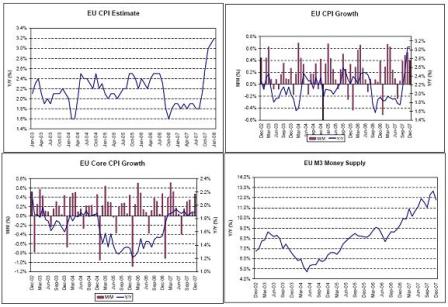
..while high inflation indicators persist even as growth slows.
♥


